


1. Introduction
Ambient delicate particulate matter (PM2.5) exposure has been linked to significant health risks, including increased mortality. Previous studies have shown a strong association between PM2.5 exposure and various health outcomes, such as cardiovascular disease mortality and exacerbation of respiratory conditions like asthma and bronchitis [1-5]. Furthermore, interactions between air pollution and genetic factors have revealed significant gene-environment interactions that complicate the health outcomes for affected individuals [6].
China’s rapid industrialization and urbanization have resulted in significant environmental challenges, notably air pollution. Over the past few decades, China’s energy-intensive development path has substantially increased particulate matter (PM2.5) and other pollutant emissions [7]. The health burden posed by air pollution is considerable and contributes to many deaths annually from respiratory diseases [3,5]. Yin [8] found that the relative risk of cause-specific mortality from long-term exposure to PM2.5 may be underestimated in China. Li [4] discovered that long-term exposure to PM2.5 was associated with an increased risk of all-cause mortality in Chinese adults who are 65 years and older.
Recent studies have highlighted the disproportionate impact of air pollution on vulnerable populations. They are more susceptible to the harmful effects of environmental pollutants. Older adults are particularly vulnerable due to their preexisting health conditions and reduced physiological resilience [9].
Other substantial gaps still need to be addressed. Many studies have not adequately accounted for the temporal dynamics of air pollution exposure and its health impacts. Yang [10] used average PM2.5 estimates over long periods without considering temporal changes, potentially missing dynamic health and mortality trends. Besides, the effects of high-level PM2.5 exposure in older adults can vary according to different risk factors. Li [4,5] estimated the effects of long-term PM2.5 exposures and mortality vary spatially between southern and northern regions and between urban and rural areas. However, previous research has not adequately studied crucial individual risk factors as physical function and mental health.
The China Longitudinal Healthy Longevity Survey (CLHLS) is helpful to understand the health conditions among older Chinese adults. This dataset collects comprehensive data on participants’ lives, including demographics, health conditions, lifestyle factors, and social support networks [6]. Xi [11] utilized the CLHLS data with time-varying Cox proportional hazards models. They found that older adults are particularly vulnerable to heatwaves, with those experiencing dependency in activities of daily living (ADL), social isolation, and cognitive impairment having higher hazard ratios.
Our research aims to address these limitations by incorporating time-varying Cox proportional hazards models and focusing on individual-level exposure data. By leveraging the CLHLS dataset and high-resolution air pollution data from the Tracking Air Pollution in China (TAP) database, we aim to provide a more nuanced understanding of air pollution's long-term impacts on mortality among older Chinese adults. Through this approach, we will evaluate the impact of individual risk factors on the long-term PM2.5-related survival of China’s elderly population, determine the association between increased mortality and critical risk factors caused by air pollution, and understand how these factors interact with environmental exposure over time. We hope to contribute to the growing body of literature on the health impacts of air pollution and inform policy measures to mitigate these effects.
2. Methodology
2.1. Study Population and Dataset Description
The dataset we use is from the 2000-2018 longitudinal dataset. It involves static and eighteen-year interval dynamic information for the respondents who were first interviewed in 2000. It contains 11,199 respondents who were interviewed in 2000, there were 1,541 respondents lost in the 2002 survey, 724 respondents lost in the 2005 survey, 505 respondents lost in the 2008 survey, 129 respondents lost in the 2011 survey, 19 respondents lost in the 2014 survey, and 45 respondents lost in the 2018 survey.
CLHLS captures comprehensive data on participants’ demographics, health status, behavior patterns, and social support, covering rural and urban areas in 23 of China’s 31 provinces. This dataset includes age, gender, race/ethnicity, education, marital status, tobacco and alcohol use, major physical diseases (diabetes, bronchitis, emphysema, asthma, and pneumonia), physical functional status measured by ADL scales, and mental health. Data were collected through face-to-face interviews with participants and, for deceased individuals, interviews with their closest relatives. There are also follow-up surveys to ensure the data’s accuracy and longitudinal integrity during the research period.
TAP provides PM2.5 concentration data from over 1,000 state monitoring stations. It is filled with satellite remote sensing data to achieve a 1 km × 1 km spatial resolution, covering the period from 2000 to 2018 and allows for assessing long-term PM2.5 exposure. The TAP dataset offers reliable and comprehensive data by combining ground-based observations with satellite-derived estimates.
2.2. Mortality
Mortality here is time to event and records the time from the baseline survey to the date of death or the end of the study period for those who survived. Mortality data are collected through follow-up surveys with information obtained from family members or official records. Because CLHLS is a longitudinal research, this allows for a detailed analysis of mortality related to PM2.5 exposure over time. By linking mortality with air pollution exposure and other relevant predictor variables, the study can assess the long-term health impacts of different factors on older adults in China. The detailed mortality records enable advanced statistical models to explore the complex interactions between air pollution, demographic factors, and health outcomes.
2.3. PM2.5
PM2.5 refers to particulate matter with a diameter of 2.5 micrometers or smaller. Inhalation of PM2.5 is associated with respiratory and cardiovascular health problems, including asthma, bronchitis, heart attacks, strokes, etc. Delicate particulate matter is a continuous variable ranging from 12.824 µg/m³ to 117.98 µg/m³ in our dataset, assigned with each province and year. Lv [9] found that the incidence of disability in ADL escalates when PM2.5≥33µg/m³; we refer to this threshold to split participation into high-pollution or low-pollution labels to investigate the effect of PM 2.5.
2.4. Demographic Variables
The sex variable is a binary indicator (male or female) recorded for each participant. Biological differences between men and women, such as hormonal variations and genetic factors, can affect vulnerability to air pollution. The age variable records the participant’s age at the time of each survey. Age is a crucial variable as it is a significant risk factor for mortality and health deterioration, particularly in older adults. The residence variable classifies participants as living in either urban or rural areas. The residence variable divides participants as living in either urban or rural areas. Urban areas are more likely to have higher levels of air pollution due to industrial activities, traffic emissions, and higher population density. Rural areas may have pollution sources such as agricultural activities and biomass burning.
2.5. Functioning Capacity
Functioning capacity uses the Activities of Daily Living (ADL) scales to measure the ability to perform basic self-care tasks for participants. The ADL scales include six components:
E1: Bathing
E2: Dressing
E3: Toileting
E4: Indoor transferring
E5: Continence
E6: Feeding
Each dimension is scored on a scale. The higher the score, the greater the impairment. This variable is particularly useful as it offers information about the physical capacity of the participants and their health status also essential to know in addressing the general health effects of air pollution. Impaired functioning capacity suggests susceptibility to environmental stressors, making the variable necessary for analysis. The ADL scores are obtained either by self-reports or proxy responses if the participant cannot provide information personally. The ADL scores had been obtained from the subjects' answers to six defined questions that rated their ability to carry out personal activities. The rating of activity levels was 1-No assistance required, 2-Some help required, and 3-Total help required. The score for each is summed up to acquire a broader ADL score, which in turn provides a composite score of between 6 to 18. The sum score results categorized ability into three dimensions and levels: Good (6 points), Moderate (7-12 points), and Poor (13-18 points). The classification is finer, enabling us further to do stratified analysis in our modeling and allowing a more precise estimation of the influence of health conditions on daily living and general well-being by including these detailed ADL measures.
2.6. Health Factors
Chronic diseases increase susceptibility to the harmful effects of air pollution and contribute to higher mortality risks. The presence of these diseases is determined through self-reports during the interviews and validated by medical records. Smoking status is categorized to two groups: smoke and non-smoke. Smoking is a significant risk factor for respiratory and cardiovascular diseases, and the effects compound the adverse health impacts of air pollution. Smoking history is collected by the interviews, including age at smoking initiation, cessation, and the number of cigarettes smoked per day, which is essential for controlling the confounding effects of smoking and accurately attributing health outcomes to PM2.5 exposure.
2.7. Data Preprocessing
Data preprocessing in the analysis of PM2.5 concentration data and longitudinal survey data involved several vital steps. With a sizeable raw data volume from the Tracking Air Pollution in China (TAP) dataset, it was decided to break it into smaller, more manageable subsets, allowing us to efficiently deal with over 10 million records. We obtained the provincial annual average level of PM2.5 concentration, which, in turn, could get a long-term exposure level with a reduced impact by short-term fluctuation. The information regarding PM2.5 was then geolocated and aligned with the geographic coordinates for China Longitudinal Healthy Longevity Survey (CLHLS) respondents. This step was necessary for the exposure to environmental data to be combined with individual health records accurately such that each participant's exposure to PM2.5 is correctly attributed based on location.
Data cleaning for the CLHLS dataset has been done to maintain the longitudinal structure of the data. We merged the records of the participants who were part of the survey at different waves while maintaining consistency and resolving inconsistencies, for instance, in the case of conflicting death records. This is achieved by carefully reevaluating each respondent's responses over several years.
Key covariates were re-calculated to fit in the Cox proportional hazards model. We defined 60 years of age as the beginning for each participant based on the World Health Organization’s definition of elderly persons. The death year was taken as the endpoint of the observation, while wave times were taken as interval stop points for each participant. This approach enabled us to capture the dynamic nature of participants' health status and environmental exposure over time.
2.8. Statistical Analysis
Past studies have assessed ambient PM2.5 concentration as a risk factor for mortality in older adults using time-varying Cox proportional risk models, which encouraged us to investigate how other vulnerability risks interact with PM2.5 to influence survival. A longitudinal cohort design used a time-varying Cox proportional hazard model to analyze the association between PM2.5 exposure and mortality in older adults. Analyses were done with R version 4.3.3.
\( h(t)={h_{0}}(t)exp({β_{1}}{x_{1}}(t)+{β_{2}}{x_{2}}(t)+...+{β_{k}}{x_{k}}(t)) \)
In the equation (1), \( {x_{k}}(t) \) represents covariates, including time-varying covariates such as age, smoking status, physical function (ADL), whether an individual has a disease (high blood pressure, diabetes, stroke, or cardiovascular disease, respiratory disease), and time-fixed covariates such as gender and residence. \( h(t) \) represents the risk function of exposure to PM2.5 and covariates for a given individual at time \( t \) . \( {h_{0}}(t) \) represents the risk function at time 0. β represents the influence coefficients of PM2.5 and covariate, respectively.
To reveal the potential individual risk factors for PM2.5 and elderly mortality, we conducted a comprehensive stratified analysis of disease-related risk factors and general physical functions. We conducted a subgroup analysis to explore if the association between PM2.5 and mortality in the elderly varied depending on whether or not they had a particular disease (e.g., having a respiratory disease vs not having a respiratory disease). We also assessed the potential impact on overall physical function, grouping participants according to ADL scores (6 for full function, vs7-12 for moderate impairment, and 13-18 for severe impairment).
3. Result
Table 1. Distributions of selected characteristics of the study population in 2000(N=11199)
Characteristics | N | Percent % |
Age less than 80 80-99 more than 100 | 38 8730 2431 | 0.3 78.0 21.7 |
Sex Male Female | 4651 6548 | 41.5 58.4 |
Urban/Rural Urban Rural | 6899 4300 | 61.6 38.3 |
Smoking Status Yes No | 1866 9333 | 16.6 83.3 |
ADL 6 7-12 13-18 Missing | 7241 3023 902 33 | 64.7 27.0 8.1 0.2 |
Chronic Respiratory Yes No Missing | 1253 9348 598 | 11.1 83.5 5.3 |
Hypertension Yes No Missing | 1559 9056 584 | 13.9 80.8 5.2 |
Stroke or CVD Yes No Missing | 439 10137 623 | 3.9 90.5 5.6 |
Diabetes Yes No Missing | 159 10392 648 | 1.4 92.7 5.8 |
3.1. Descriptive Statistics
As shown in Table 1, we used data following 11,199 participants aged 65 and above for a total time span, between 2000 and 2018. The focus of these analyses was on identifying vulnerability to PM2.5-attributable mortality related to declines in physical functioning, as captured by the ADL scale. Possible confounders considered here include demographic characteristics, health conditions, and smoking status. The average age of the study population was 87.1 (SD = 11.3) years at baseline. The age distribution showed that 27% were between 65-79 years old, and the remaining 73% were 80 years and over, while the age distribution is 26.2% for those ages 80-89 years, 27.4% for ages 90-99, and 19.4% ages 100 and older. The cohort was predominantly female (58.4%), and the majority were urban residents (61.6%); the remainder lived in rural areas. A very high majority of the participants, 83.3%, were non-smokers, while 16.6% were either current or ex-smokers. Physical functional independence, as evaluated by the ADL scale, represented 64.7% of fully functioning patients (ADL score = 6), 27.0% with moderate impairment (ADL score 7-12), and 8.1% with severe impairment (ADL score 13-18). Also, 11.1% had chronic respiratory diseases, 13.9% had hypertension, and 3.9% had a history of stroke or CVD. The important context is these covariates giving in understanding how susceptible the population is to the adverse effects of long-term PM2.5 exposure.
3.2. Exposure-response relationship
By fitting the time-varying COX model, we found that PM2.5 impacts the all-cause mortality of the elderly in China (Hazard Ratio (HR) = 1.0054, 95% CI:1.0038-1.0069 ). In addition, age, sex, individual physical functions, smoking, and certain diseases also influence the death of older persons. The decline in physical function increases the risk of death in older adults by nearly 20% (HR=1.19). Smoking results in a highly exaggerated increase in the risk of death (HR=22.9).
Figure 1 depicts the association between increased exposure to PM2.5 and the risk of death from PM2.5. The monotonous increase in mortality risk was associated with PM2.5 exposure, showing an approximately linear relationship over a wide range of PM2.5 concentrations. Figure 2 shows the Kaplan-Meier Curve for the participants. Participations were split into Group 1 with an initial PM2.5 <= 33µg/m³ and Group 2 with an initial PM2.5 > 33µg/m³ value in 2000-wave [9]. In the study, the P-value of the log-rank test is less than 0.05, indicated with this threshold value, PM2.5 has an effect on the survival time of the elderly.
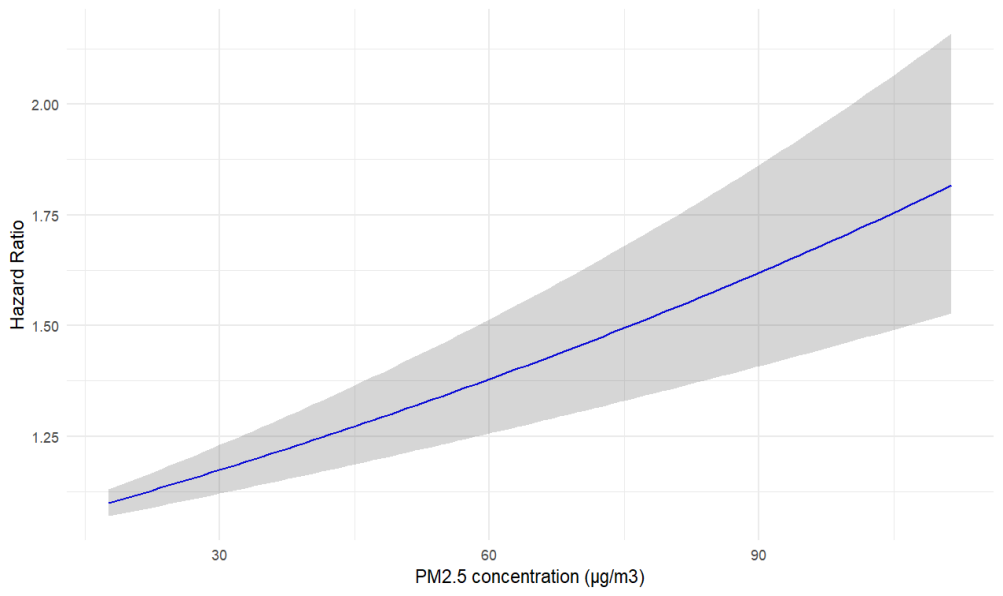
Figure 1. Hazard Ratio for Mortality in Relation to PM2.5 Concentration
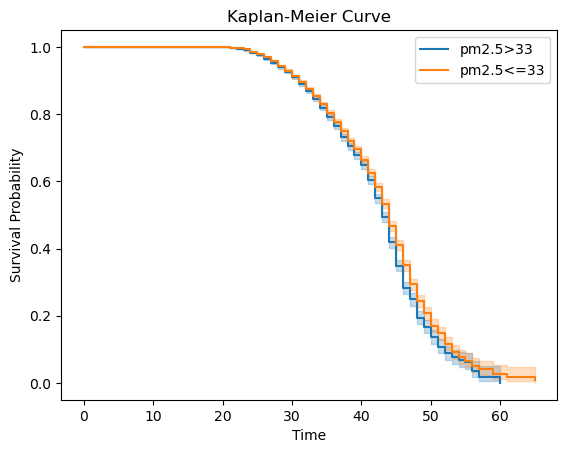
Figure 2. Kaplan-Meier curve for high pollution and low pollution ID
3.3. Diseases and PM2.5 mortality
Disease is a vulnerability factor affecting older people’s exposure to PM2.5. We examined hypertension, stroke, diabetes, and respiratory diseases. In the case of stroke and respiratory disease, the effect of PM2.5 exposure on death in the elderly was not significant. However, the effect varies depending on whether you have hypertension or diabetes. In the disease stratification analysis ( Figure 3), hypertension patients in the elderly were associated with a bigger risk of death from exposure to PM2.5 (HR = 1.007, 95% CI:1.003-1.011), compared to elderly people without the disease(HR = 1.0052, 95% CI:1.0036-1.0069). Compared with older adults without diabetes (HR = 1.0052, 95% CI:1.0036-1.0068), older adults with diabetes had a higher risk of death from exposure to PM2.5 (HR = 1.0131, 95% CI:1.0016-1.0248).
3.4. Physical function and PM2.5 mortality
We examined the mortality risk of PM2.5 under different physical conditions (Figure 4). We found that the decline in physical function in older adults actually reduced their PM2.5-related mortality. Older people with good physical function (ADL score of 6) have a bigger risk of PM2.5-related mortality (HR=1.0107,95% CI:1.007-1.014). Older people with impaired physical function had a lower risk of PM2.5-related death. The HRs of time-varying PM2.5 exposure in moderately and severely impaired individuals were 1.0057(1.0026, 1.0091) and 1.0027(1.0007, 1.005), respectively.
Taking into account the situation of each subscale, when the elderly had severe difficulties in going to the toilet, moving indoors, eating, and moderate difficulties in dressing, the effect of PM2.5 on death was not significant. Under the specific disability status (ADL subscale), the risk trend of PM2.5 was consistent with that of overall physical function, the aggravation of a certain disability makes PM2.5 less relevant to the death of the elderly.
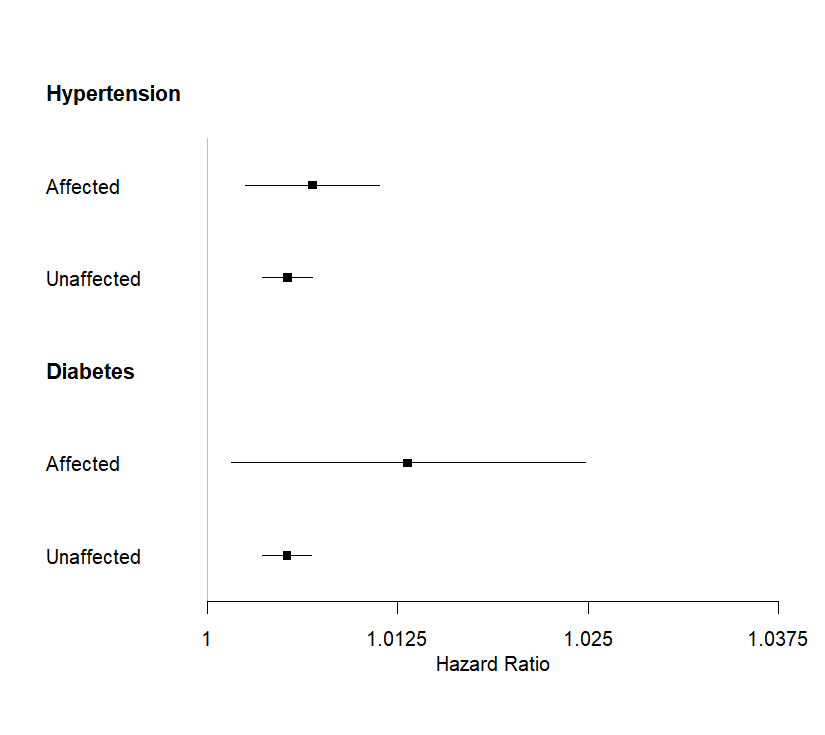
Figure 3. HRs of PM2.5 stratified according to disease characteristics
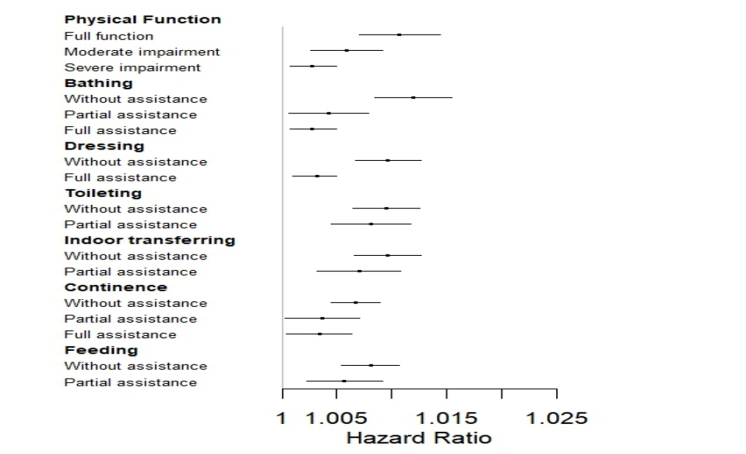
Figure 4. HRs of PM2.5 stratified according to physical function ADL scale score
Dots represent points show the hazard ratio for a different subgroup. The error bar represents a 95% confidence interval.
4. Discussion
Age was a significant factor in mortality, with older age unexpectedly associated with a lower risk of death (HR 0.64, 95% CI 0.63–0.65, p < 0.0001). This counterintuitive finding suggests that those who survive to older ages may be healthier, a phenomenon known as the healthy survivor effect. Additionally, right censoring and data gaps due to high dropout rates among the oldest individuals might skew results toward healthier survivors [12]. The sex factor shows that males have a lower mortality risk than females (HR 0.89, 95% CI 0.83–0.95, p < 0.001). This disparity might be attributed to data limitations and potential biases in reporting and follow-up surveys[4], [11]. Residence showed no significant difference in mortality risk (HR 0.99, 95% CI 0.91–1.07, p = 0.746). Despite urban areas typically having higher pollution levels, rural areas might pose significant health risks due to limited healthcare access and higher indoor pollution from biomass fuel use [9].
The association between physical function(ADL), and PM2.5-related mortality provides insightful findings. Our results indicate that older adults who have better physical function (ADL score of 6) have a higher risk of PM2.5-related mortality (HR = 1.0107, 95% CI: 1.007–1.014) than those who have impaired physical function, who exhibit a lower risk. Specifically, the hazard ratios of time-varying PM2.5 exposure in moderately and severely impaired individuals were 1.0057 (95% CI: 1.0026–1.0091) and 1.0027 (95% CI: 1.0007–1.005). This counterintuitive finding suggests that people with full physical function might engage more in outdoor activities, resulting in PM2.5 exposure quantity increase. However, those with impaired physical function will be likely to spend more time indoors to reduce their exposure to outdoor air pollution. This hypothesis is supported by a study from Chen that indicates higher outdoor activity levels correlate with increased exposure to environmental pollutants [13]. Additionally, for the very elderly, the substantial decline in physical function might make the impact of PM2.5 on mortality less significant to consider. High age is often associated with multiple chronic conditions and a general decline in physiological function, overshadowing the effects of PM2.5 exposure. Under such circumstances, mortality is more likely attributed to the progression of age-related diseases and overall frailty rather than exposure to air pollution [14]. These findings here show the complex interplay between physical function and environmental exposure for determining health outcomes among the older population.
Besides, several diseases are examined to assess their modifying effects on the relationship between PM2.5 exposure and mortality. Considering stroke and respiratory diseases, the effect of PM2.5 exposure on mortality did not present a significant result. However, significant interactions were observed for hypertension and diabetes. Hypertension was associated with a higher risk of death from PM2.5 exposure (HR = 1.007, 95% CI: 1.003–1.011) compared with those without hypertension (HR = 1.0052, 95% CI: 1.0036–1.0069). Similarly, older adults with diabetes had a higher risk of death from PM2.5 exposure (HR = 1.0131, 95% CI: 1.0016–1.0248) compared to those without diabetes (HR = 1.0052, 95% CI: 1.0036–1.0068). The finding highlights a specific group of people who have had some illness are more susceptible to the harm of air pollution [4]. Hypertension and diabetes might exacerbate the body’s response to pollutants by potential inflammation and compromised cardiovascular function [9]. The chronic inflammatory state associated with these conditions could amplify the inflammatory response triggered by PM2.5, causing increased cardiovascular strain and greater susceptibility to adverse outcomes [12]. The stratified analysis highlights the importance of considering individual health conditions for evaluating the impacts of air pollution. The heightened susceptibility of individuals with hypertension and diabetes indicates that public health interventions should prioritize these groups to reduce the harm of PM2.5 exposure [4]. Furthermore, differences in risk found may at least be partially caused by the variability in access to healthcare and treatment of those chronic conditions. Individuals with well-treated hypertension or diabetes are likely to experience less severe impacts from PM2.5 exposure than poorly controlled conditions [12]. The p-value of the log-rank test revealed a significant difference below 0.05. This suggests that exposure to PM2.5 has a considerable influence on the duration of older people’s survival and, in fact, those with chronic conditions. Such an important finding is consistent with those already reported in earlier studies and indicates that air pollution enhances the health impacts of chronic diseases and raises mortality risks [13]. Future studies should further be focusing on these interactions to develop more targeted strategies for protecting vulnerable populations from air pollution exposure. Understanding the way PM2.5 exacerbates chronic conditions could inform more effective public health policies and interventions.
The smoking status result indicated a highly significant impact on mortality risk (HR = 22.93, 95% CI: 20.67–25.43, p < 0.0001). This extremely high hazard ratio indicates smokers are prominently more vulnerable to dying compared to non-smokers. Several factors contribute to this amplified risk. A study from Chen [13] has shown that smokers have compromised lung function and increased susceptibility to respiratory infections and chronic diseases can be exacerbated by particulate matter in the air. Additionally, historical smoking patterns in China, particularly from the 1940s to the 1960s, likely contribute to the current high mortality risk observed among older smokers. Smoking became widespread, partly due to aggressive marketing by tobacco companies and the cultural normalization of smoking, especially among males [15]. The long-term effects of these historical smoking habits are now manifesting in increased mortality rates as the population ages. Moreover, the educational levels and awareness regarding the health risks of smoking were relatively low during the mid-20th century in China. Lack of awareness and combined with high smoking prevalence, it means that many older adults have long histories of heavy smoking, leading to severe health consequences in the presence of additional environmental stressors like PM2.5 [16]. Lower socioeconomic status (SES) of many smokers during this era also have higher smoking rates and increased health risks, as SES influences smoking behaviors and cessation success.
5. Limitation
Several limitations should be considered. First, the reliance here on self-reported data for health conditions and ADL scores introduces the potential for reporting bias. Participants might have overestimated or underestimated their health status and functional abilities, impacting the accuracy of our results. The problem is particularly relevant for older people with cognitive impairments, who might have difficulty accurately reporting their health status. Secondly, the exposure assessment was based on average annual PM2.5 concentrations at the provincial level might not accurately reflect individual-level exposure. Variations within provinces and changes in exposure during the research period were not fully accounted for, leading to potential exposure misclassification. Lastly, some of our results showed non-significant p-values, particularly for factors like hypertension, diabetes, and bronchitis, which might be due to insufficient sample sizes or misclassification in self-reported health conditions. Healthier individuals might have been more likely to participate in follow-up surveys, leading to a healthier survivor bias.
6. Conclusion
In conclusion, our study highlights the significant impact of PM2.5 exposure on mortality among older Chinese adults and shows different effects depending on individual health conditions and physical function. We found that exposure to PM2.5 is linked to a higher risk of mortality, particularly among those with better physical function, suggesting that active older adults might have higher exposure levels. Additionally, our findings emphasize the heightened vulnerability of individuals with pre-existing conditions such as hypertension and diabetes to PM2.5-related mortality. These findings highlight the importance of focused public health policies, especially for those with chronic health conditions, from the negative influences of air pollution. Future research should address our study’s limitations, such as improving the precision of exposure assessment to elucidate further interactions between environmental exposures and health conditions in older adults.
References
[1]. J. S. Apte, M. Brauer, A. J. Cohen, M. Ezzati, and C. A. Pope, “Ambient PM2.5 reduces global and regional life expectancy,” Environmental Science & Technology Letters, vol. 5, no. 9, pp. 546–551, Aug. 2018, doi: 10.1021/acs.estlett.8b00360.
[2]. Z. Wensu, C. Wen, Z. Fenfen, W. Wenjuan, and L. Li, “The Association between Long-Term Exposure to Particulate Matter and Incidence of Hypertension among Chinese elderly: a Retrospective cohort study,” Frontiers in Cardiovascular Medicine, vol. 8, Jan. 2022, doi: 10.3389/fcvm.2021.784800.
[3]. N. Gouveia, “Time series analysis of air pollution and mortality: effects by cause, age and socioeconomic status,” Journal of Epidemiology and Community Health, vol. 54, no. 10, pp. 750–755, Oct. 2000, doi: 10.1136/jech.54.10.750.
[4]. T. Li et al., “All-cause mortality risk associated with long-term exposure to ambient PM2·5 in China: a cohort study,” the Lancet. Public Health, vol. 3, no. 10, pp. e470–e477, Oct. 2018, doi: 10.1016/s2468-2667(18)30144-0.
[5]. Y. Zhang, “All-Cause Mortality Risk and Attributable Deaths Associated with Long-Term Exposure to Ambient PM2.5 in Chinese Adults,” Environmental Science & Technology, vol. 55, no. 9, pp. 6116–6127, Apr. 2021, doi: 10.1021/acs.est.0c08527.
[6]. Y. Yao, L. Liu, G. Guo, Y. Zeng, and J. S. Ji, “Interaction of Sirtuin 1 (SIRT1) candidate longevity gene and particulate matter (PM2.5) on all-cause mortality: a longitudinal cohort study in China,” Environmental Health, vol. 20, no. 1, Mar. 2021, doi: 10.1186/s12940-021-00718-x.
[7]. R.-J. Huang et al., “High secondary aerosol contribution to particulate pollution during haze events in China,” Nature, vol. 514, no. 7521, pp. 218–222, Sep. 2014, doi: 10.1038/nature13774.
[8]. P. Yin et al., “Long-term fine particulate matter exposure and nonaccidental and cause-specific mortality in a large national cohort of Chinese men,” Environmental Health Perspectives, vol. 125, no. 11, Nov. 2017, doi: 10.1289/ehp1673.
[9]. Y. Lv et al., “Long-term exposure to PM2.5 and incidence of disability in activities of daily living among oldest old,” Environmental Pollution, vol. 259, p. 113910, Apr. 2020, doi: 10.1016/j.envpol.2020.113910.
[10]. X. Yang et al., “Associations of long-term exposure to ambient PM2.5 with mortality in Chinese adults: A pooled analysis of cohorts in the China-PAR project,” Environment International, vol. 138, p. 105589, May 2020, doi: 10.1016/j.envint.2020.105589.
[11]. D. Xi et al., “Risk factors associated with heatwave mortality in Chinese adults over 65 years,” Nature Medicine, Mar. 2024, doi: 10.1038/s41591-024-02880-4.
[12]. J. Zhang, S. J. McLaughlin, and L. W. Li, “Cumulative exposure to air pollution and subsequent mortality among older adults in China,” Journal of Public Health, vol. 41, no. 3, pp. 518–526, Sep. 2018, doi: 10.1093/pubmed/fdy154.
[13]. R. Chen et al., “Fine particulate air pollution and daily mortality. a nationwide analysis in 272 Chinese cities,” American Journal of Respiratory and Critical Care Medicine, vol. 196, no. 1, pp. 73–81, Jul. 2017, doi: 10.1164/rccm.201609-1862oc.
[14]. Y. Tian and Z. Shi, “Effects of Physical Activity on Daily Physical Function in Chinese Middle-Aged and Older Adults: A Longitudinal Study from CHARLS,” Journal of Clinical Medicine, vol. 11, no. 21, p. 6514, Nov. 2022, doi: 10.3390/jcm11216514.
[15]. W. Zheng et al., “Burden of Total and Cause-Specific Mortality Related to Tobacco Smoking among Adults Aged ≥45 Years in Asia: A Pooled Analysis of 21 Cohorts,” PLoS Medicine, vol. 11, no. 4, p. e1001631, Apr. 2014, doi: 10.1371/journal.pmed.1001631.
[16]. Q. Wang, J. J. Shen, M. Sotero, C. A. Li, and Z. Hou, “Income, occupation and education: Are they related to smoking behaviors in China?,” PloS One, vol. 13, no. 2, p. e0192571, Feb. 2018, doi: 10.1371/journal.pone.0192571.
Cite this article
Guo,J.;Xu,R.;Tan,K. (2025). Individual Risk Factors associated with PM2.5 mortality in Chinese older adults. Theoretical and Natural Science,78,10-19.
Data availability
The datasets used and/or analyzed during the current study will be available from the authors upon reasonable request.
Disclaimer/Publisher's Note
The statements, opinions and data contained in all publications are solely those of the individual author(s) and contributor(s) and not of EWA Publishing and/or the editor(s). EWA Publishing and/or the editor(s) disclaim responsibility for any injury to people or property resulting from any ideas, methods, instructions or products referred to in the content.
About volume
Volume title: Proceedings of the 4th International Conference on Biological Engineering and Medical Science
© 2024 by the author(s). Licensee EWA Publishing, Oxford, UK. This article is an open access article distributed under the terms and
conditions of the Creative Commons Attribution (CC BY) license. Authors who
publish this series agree to the following terms:
1. Authors retain copyright and grant the series right of first publication with the work simultaneously licensed under a Creative Commons
Attribution License that allows others to share the work with an acknowledgment of the work's authorship and initial publication in this
series.
2. Authors are able to enter into separate, additional contractual arrangements for the non-exclusive distribution of the series's published
version of the work (e.g., post it to an institutional repository or publish it in a book), with an acknowledgment of its initial
publication in this series.
3. Authors are permitted and encouraged to post their work online (e.g., in institutional repositories or on their website) prior to and
during the submission process, as it can lead to productive exchanges, as well as earlier and greater citation of published work (See
Open access policy for details).
References
[1]. J. S. Apte, M. Brauer, A. J. Cohen, M. Ezzati, and C. A. Pope, “Ambient PM2.5 reduces global and regional life expectancy,” Environmental Science & Technology Letters, vol. 5, no. 9, pp. 546–551, Aug. 2018, doi: 10.1021/acs.estlett.8b00360.
[2]. Z. Wensu, C. Wen, Z. Fenfen, W. Wenjuan, and L. Li, “The Association between Long-Term Exposure to Particulate Matter and Incidence of Hypertension among Chinese elderly: a Retrospective cohort study,” Frontiers in Cardiovascular Medicine, vol. 8, Jan. 2022, doi: 10.3389/fcvm.2021.784800.
[3]. N. Gouveia, “Time series analysis of air pollution and mortality: effects by cause, age and socioeconomic status,” Journal of Epidemiology and Community Health, vol. 54, no. 10, pp. 750–755, Oct. 2000, doi: 10.1136/jech.54.10.750.
[4]. T. Li et al., “All-cause mortality risk associated with long-term exposure to ambient PM2·5 in China: a cohort study,” the Lancet. Public Health, vol. 3, no. 10, pp. e470–e477, Oct. 2018, doi: 10.1016/s2468-2667(18)30144-0.
[5]. Y. Zhang, “All-Cause Mortality Risk and Attributable Deaths Associated with Long-Term Exposure to Ambient PM2.5 in Chinese Adults,” Environmental Science & Technology, vol. 55, no. 9, pp. 6116–6127, Apr. 2021, doi: 10.1021/acs.est.0c08527.
[6]. Y. Yao, L. Liu, G. Guo, Y. Zeng, and J. S. Ji, “Interaction of Sirtuin 1 (SIRT1) candidate longevity gene and particulate matter (PM2.5) on all-cause mortality: a longitudinal cohort study in China,” Environmental Health, vol. 20, no. 1, Mar. 2021, doi: 10.1186/s12940-021-00718-x.
[7]. R.-J. Huang et al., “High secondary aerosol contribution to particulate pollution during haze events in China,” Nature, vol. 514, no. 7521, pp. 218–222, Sep. 2014, doi: 10.1038/nature13774.
[8]. P. Yin et al., “Long-term fine particulate matter exposure and nonaccidental and cause-specific mortality in a large national cohort of Chinese men,” Environmental Health Perspectives, vol. 125, no. 11, Nov. 2017, doi: 10.1289/ehp1673.
[9]. Y. Lv et al., “Long-term exposure to PM2.5 and incidence of disability in activities of daily living among oldest old,” Environmental Pollution, vol. 259, p. 113910, Apr. 2020, doi: 10.1016/j.envpol.2020.113910.
[10]. X. Yang et al., “Associations of long-term exposure to ambient PM2.5 with mortality in Chinese adults: A pooled analysis of cohorts in the China-PAR project,” Environment International, vol. 138, p. 105589, May 2020, doi: 10.1016/j.envint.2020.105589.
[11]. D. Xi et al., “Risk factors associated with heatwave mortality in Chinese adults over 65 years,” Nature Medicine, Mar. 2024, doi: 10.1038/s41591-024-02880-4.
[12]. J. Zhang, S. J. McLaughlin, and L. W. Li, “Cumulative exposure to air pollution and subsequent mortality among older adults in China,” Journal of Public Health, vol. 41, no. 3, pp. 518–526, Sep. 2018, doi: 10.1093/pubmed/fdy154.
[13]. R. Chen et al., “Fine particulate air pollution and daily mortality. a nationwide analysis in 272 Chinese cities,” American Journal of Respiratory and Critical Care Medicine, vol. 196, no. 1, pp. 73–81, Jul. 2017, doi: 10.1164/rccm.201609-1862oc.
[14]. Y. Tian and Z. Shi, “Effects of Physical Activity on Daily Physical Function in Chinese Middle-Aged and Older Adults: A Longitudinal Study from CHARLS,” Journal of Clinical Medicine, vol. 11, no. 21, p. 6514, Nov. 2022, doi: 10.3390/jcm11216514.
[15]. W. Zheng et al., “Burden of Total and Cause-Specific Mortality Related to Tobacco Smoking among Adults Aged ≥45 Years in Asia: A Pooled Analysis of 21 Cohorts,” PLoS Medicine, vol. 11, no. 4, p. e1001631, Apr. 2014, doi: 10.1371/journal.pmed.1001631.
[16]. Q. Wang, J. J. Shen, M. Sotero, C. A. Li, and Z. Hou, “Income, occupation and education: Are they related to smoking behaviors in China?,” PloS One, vol. 13, no. 2, p. e0192571, Feb. 2018, doi: 10.1371/journal.pone.0192571.