


1. Introduction
1.1. Previous Studies on Time Pressure in Chess
Time pressure in chess has been a topic of interest for researchers, with numerous studies exploring its effects on players' performance. Early research focused on the impact of time constraints on decision-making, with findings suggesting that as time available for making moves decreases, the likelihood of making suboptimal decisions increases (Lassiter, 2000). This phenomenon has been attributed to the reduction in the depth and breadth of search in the game tree, leading to quicker, yet less accurate, decisions.
More recent studies have utilized advanced neuroimaging techniques, such as functional near-infrared spectroscopy (fNIRS), to investigate the neural correlates of time pressure in chess players. For instance, a study by Leong et al. (2024) compared the brain activity of experienced and novice chess players under 1-minute and 5-minute time limits. The findings revealed distinct patterns of functional connectivity in the frontoparietal regions, with experienced players showing enhanced connectivity under time pressure, suggesting an adaptive neural response that facilitates chunk memory processing (Leong et al., 2024).
However, this paper explores the relationship between time pressure, risk, and draw probability in chess, employing three primary theoretical approaches: game theory, psychology theory, and microeconomic theory (Maharaj, Polson, and Turk, 2022). This paper will take chess as an example to discuss the application and risk expectations of these three theories in this field.
1.2. Impact of three theories on risk and time pressure
1.2.1. Game Theory
Game theory, particularly behavioral game theory, is instrumental in understanding strategic interactions in chess. It emphasizes the importance of anticipating opponents' moves, formulating optimal strategies, and adjusting tactics based on the evolving state of the game (Hickson, 2022). One prediction made by game theory is that players under time pressure might deviate from optimal strategies, leading to a higher probability of draws or losses due to suboptimal moves.
1.2.2. Psychology Theory
Psychology theory focuses on cognitive processes and behavioral responses under different conditions. In the context of chess, psychological factors such as stress, time pressure, and decision fatigue play critical roles. The theory predicts that as time pressure increases, cognitive load, and stress levels rise, potentially impairing decision-making quality and increasing the likelihood of errors (Prapaithrakul, Sanguanpong, and Trakultraipruk, 2023). This could lead to a higher frequency of draws as players might adopt more conservative strategies to avoid losses.
1.2.3. Microeconomic Theory (Risk Management)
Microeconomic theory, specifically risk management, examines how individuals make choices under uncertainty. In chess, players constantly assess the risks and rewards associated with different moves. According to this theory, players under significant time constraints might take fewer risks to avoid the potential negative consequences of hasty decisions (Biggar, and Shames, 2023). This risk-averse behavior can result in a higher draw probability, as players might prioritize safety over aggressive tactics.
Risk, in a broad sense, involves exposure to the chance of loss or harm. In decision-making, it is the uncertainty regarding the outcomes of decisions. Time pressure, on the other hand, refers to the constraints on the amount of time available to make decisions. Previous research suggests that time pressure can significantly affect cognitive functions, leading to rushed decisions and potentially higher risks (Kocher et al., 2013).
In the game of chess, risk assessment plays a crucial role in strategic decision-making. Players must constantly evaluate the potential risks and rewards of each move, considering the opponent's possible responses and future board positions. Anticipating and predicting risks allows players to make informed decisions, weighing the potential benefits against the possible consequences (Poddiakov, 2022). By accurately forecasting risks, players can minimize their vulnerabilities, capitalize on their strengths, and ultimately gain a strategic advantage over their opponents. In chess, as in life, the ability to predict and manage risks is essential for success.
In this paper, we will evaluate how time pressure determines the risk propensity. Time management is a crucial aspect of chess strategy, as players are allotted a limited amount of time to make their moves. The ticking clock adds a sense of urgency and forces players to make decisions efficiently and effectively. Effective time management involves allocating time wisely across different phases of the game, such as the opening, middlegame, and endgame, to ensure that players have enough time to calculate complex variations and anticipate their opponent's moves (Kishita et al.,2024). Poor time management can lead to rushed decisions, oversights, and missed opportunities, ultimately jeopardizing a player's chances of success. What is more, risk assessment is inherent to chess strategy, as players must constantly evaluate the potential risks and rewards of their moves. Every move carries inherent risks, such as exposing pieces to capture, creating weaknesses in the position, or falling into tactical traps. Players must weigh these risks against the potential benefits of their moves, considering factors such as material advantage, positional superiority, and tactical opportunities. Effective risk assessment requires foresight, calculation, and intuition, as players must anticipate their opponent's responses and adapt their strategies accordingly to minimize vulnerabilities and exploit opportunities (Cao, Isa, and Perumal,2023).
2. Methods
2.1. Data Collection and Sources
The dataset used in this study comprises 20,058 chess games obtained from an online chess platform. These games were selected to include a diverse range of player ratings and game lengths to ensure a comprehensive analysis. The dataset includes various metadata such as player ratings, game lengths, outcomes, and time controls. However, due to the nature of online data collection, some records were incomplete or erroneous, which necessitated data cleaning.
2.2. Data Cleaning
The initial dataset underwent a rigorous data-cleaning process to ensure the reliability of the analysis. An incomplete record was defined as any game missing crucial metadata such as player ratings, game length, or game outcome. Erroneous records were identified through the detection of implausible values (e.g., negative game lengths, and ratings outside the plausible range for competitive chess players). After cleaning, a subset of 1,000 games was randomly selected for detailed analysis to manage computational resources effectively.
2.3. Variable Definitions
Duration: Defined as the length of time in a game, not the number of moves.
Player Ratings: The ratings of the players involved in each game.
Draw Percent: Calculated as the percentage of games that ended in a draw. Here the probability of a draw in each opening is usually not calculated directly, but rather the probability of a draw in each opening is calculated indirectly from a large amount of game data and statistical analysis. (e. g, according to hellochess.co.uk, in games played from 1950 to 2014, White won 45.7% of Scottish openings, 44.1% of Italian openings, and 41.2% of Spanish openings.)
Rating Difference: The absolute difference in player ratings for each game.
2.3.1. Descriptive Statistics
The descriptive statistics provide an overview of the dataset's characteristics:
Average Player Rating: The mean rating of players in the selected subset was 1500, with a standard deviation of 300, indicating a wide range of skill levels.
Length of the game: The mean length of the game was 60 minutes, with a standard deviation of 78 minutes.
Draw Percent: The overall draw percentage was calculated based on opening choice, which is around 5%.
The following table shows summary statistics related to these games:
Table 1: Summary Statistics
| Number | Max | Min | Ave | Percentage | Standard Deviation | Observation |
Draw | 950 | ❌ | ❌ | ❌ | 5% | ❌ | 20058 |
White Win | 10001 | ❌ | ❌ | ❌ | 50% | ❌ | 20058 |
Black Win | 9107 | ❌ | ❌ | ❌ | 45% | ❌ | 20058 |
Mate | 6325 | ❌ | ❌ | ❌ | 32% | ❌ | 20058 |
Out of time | 1680 | ❌ | ❌ | ❌ | 8% | ❌ | 20058 |
Resign | 11147 | ❌ | ❌ | ❌ | 56% | ❌ | 20058 |
Duration | ❌ | 180mins | 0mins | 60mins | ❌ | 78mins | 20058 |
Player Rating | ❌ | 2723 | 784 | 1592.748 | ❌ | 300 | 20058 |
Rating Difference | ❌ | 1605 | 0 | 173.1542 | ❌ | ❌ | 20058 |
2.4. Statistical Analysis
Here are my three main steps for analyzing the data.
2.4.1. Descriptive Statistics
Descriptive statistics were computed to summarize the central tendencies and distributions of game lengths and outcomes. This step provided an initial overview of the dataset, highlighting key patterns and trends.
2.4.2. Regression Analysis
A linear regression analysis was conducted to explore the relationship between game length and the probability of a draw. The dependent variable was the draw probability, while the independent variable was the game length. This statistical method was chosen to quantify the strength and direction of the relationship between these variables.
2.4.3. Model Specification
The linear regression model was specified as follows:
P (Draw Probability) =β0+β1×Duration²+β2×Duration, where β0 is the intercept, β1 is the coefficient of the quadratic term, and β2 is the coefficient of the first-order term.
2.5. Results
2.5.1. Descriptive Statistics
The dataset contains a total of 1000 chess games with varying lengths and outcomes. The distribution of duration and the corresponding probabilities of draws were analyzed to identify key patterns. The average length of the game was found to be 60 minutes, with an approximate standard deviation of 78 minutes. The overall draw rate across all games was approximately 5%.
2.5.2. Linear Regression Analysis
The following are the regression equations and three figures I analyzed:
\( A.Draw percent = 0.04566 + 0.0001594 * minutes - 0.000001025*minute{s^{2}} \)
Table 2: Regression statistics between Duration (minutes) and Draw Percent
| Dependent Variable:Draw Percent | |
Coefficient of the first-order term |
| 1.594*10-4*** (0.00005) |
Coefficient of the quadratic term |
| -1.025*10-6*** (0.00000) |
Intercept |
| 4.566*10-2*** (0.001) |
R² |
| 0.001 |
Adjusted R² |
| 0.001 |
Residual Std. Error |
| 0.038*** (df = 20055) |
F Statistic |
| 6.798*** (df = 20055) |
Observation |
| 20058 |
Notes: *p<0.1; **p<0.05; ***p<0.01 | ||
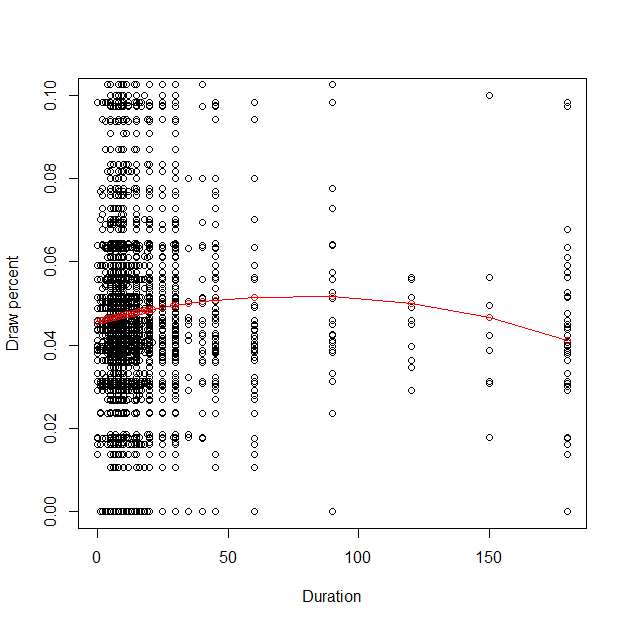
Figure 1: Relationship Between Duration (Minutes) and Draw Percent:
The scatter plot visualizes the relationship between Duration (on the x-axis) and Draw Percent (on the y-axis). The individual points represent observed data, while the red line seems to indicate a fitted trend line, possibly showing a non-linear relationship between the two variables. Initially, there appears to be a slight increase in draw percent as duration increases, peaking around 5%. After that, the trend seems to plateau and gradually decline as the duration rises. Most data points are clustered between 0 and 50 on the duration axis, with a draw percent around 0.04, and the variability decreases as the duration increases. The figure shows that the drawing percentage is relatively lower in short-time games and long-time games compared to those between 50-100-minute games.
B. \( Draw percent = 0.05640 – 0.001956 * seconds – 0.00006521*second{s^{2}} \)
Table 3: Regression statistics between Increment ((5minutes+increments(seconds)) and Draw Percent
| Dependent Variable:Draw Percent | |
Coefficient of the first-order term |
| -1.956*10-3*** (0.001) |
Coefficient of the quadratic term |
| -6.521*10-5*** (0.0001) |
Intercept |
| 5.64*10-2*** (0.006) |
R² |
| 0.002 |
Adjusted R² |
| 0.001 |
Residual Std. Error |
| 0.043*** (df = 1751) |
F Statistic |
| 1.782*** (df = 1751) |
Observation |
| 1754 |
Notes: *p<0.1; **p<0.05; ***p<0.01 | ||
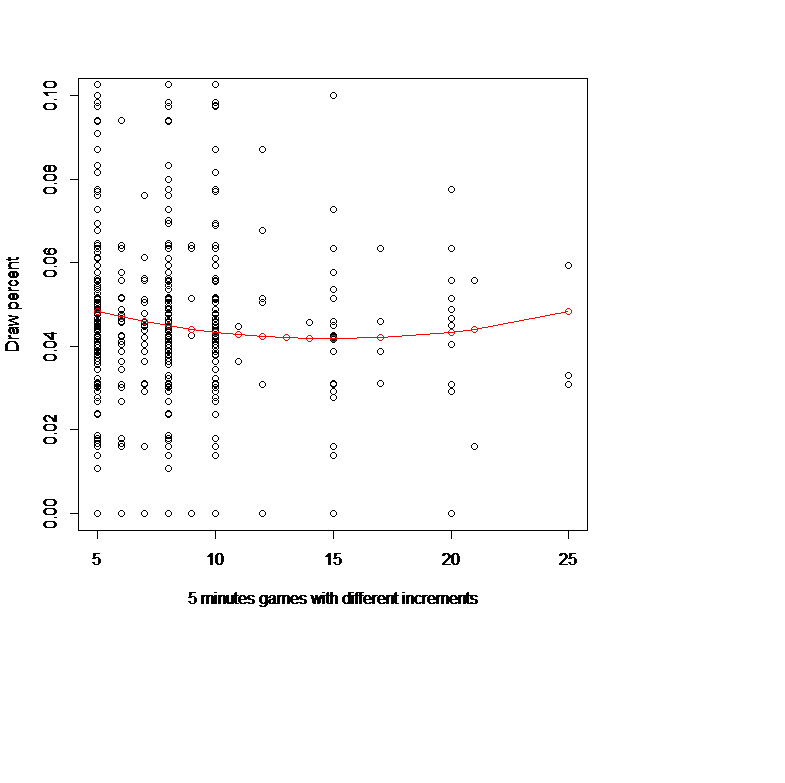
Figure 2: Relationship Between Increment (5 minutes + increments(seconds)) and Draw Percent"
We have selected a representative 5-minute game as a typical example among the many data. In the above figure, we can see that in a 5-minute game, a 15-second increment seems to have the lowest draw probability. The plot displays the relationship between an independent variable on the x-axis and a dependent variable on the y-axis. A red curve is plotted through data points, showing a clear U-shaped trend. The curve initially decreases, reaches a minimum point, and then begins to increase again. This suggests a quadratic relationship where the dependent variable decreases initially as the independent variable increases, then rises after reaching a certain threshold. Each point on the curve represents a data observation, and the red line indicates the fitted trend.
C. White better (red line): rating difference>0(white-black)
\( Draw percent = 0.04513 – 0.0001551 * minutes – 0.000001018*minute{s^{2}} \)
Table 4: Regression statistics between Duration and Draw Percent under White better(red line) situation
| Dependent Variable:Draw Percent | |
Coefficient of the first-order term |
| 1.551*10-4** (0.0001) |
Coefficient of the quadratic term |
| -1.018*10-6** (0.00000) |
Intercept |
| 4.513*10-2** (0.001) |
R² |
| 0.001 |
Adjusted R² |
| 0.001 |
Residual Std. Error |
| 0.035** (df = 10181) |
F Statistic |
| 4.139** (df = 10181) |
Observation |
| 10184 |
Notes: *p<0.1; **p<0.05; ***p<0.01 | ||
Table 5: Regression statistics between Duration and Draw Percent under Black better(blue line) situation
| Dependent Variable:Draw Percent | |
Coefficient of the first-order term |
| 1.513*10-4* (0.0001) |
Coefficient of the quadratic term |
| -9.657*10-7* (0.00000) |
Intercept |
| 4.629*10-2* (0.001) |
R² |
| 0.0005 |
Adjusted R² |
| 0.0003 |
Residual Std. Error |
| 0.041* (df = 9668) |
F Statistic |
| 2.383* (df = 9668) |
Observation |
| 9671 |
Notes: *p<0.1; **p<0.05; ***p<0.01 | ||
Black better (blue line): rating difference<0(white-black)
\( Draw percent = 0.04629 - 0.0001513 * minutes - 0.0000009657*minute{s^{2}} \)
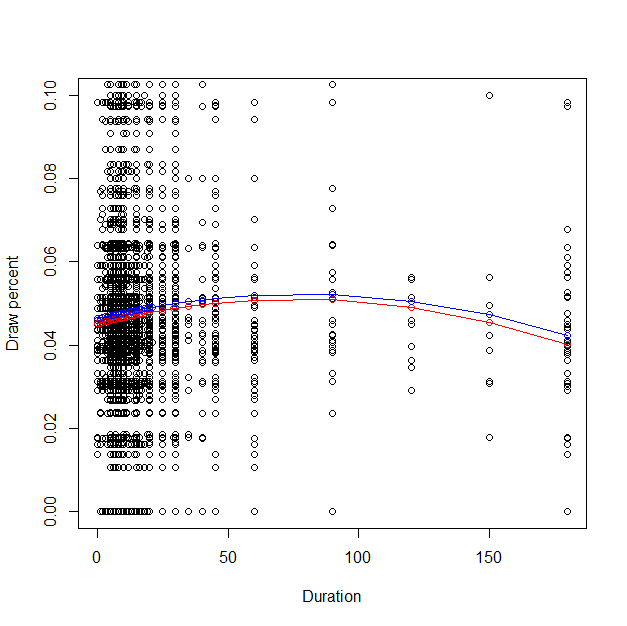
Figure 3: Relationship Between Duration and Draw Percent under White better (red line) or Black better (blue line)"
Finally, we analyzed the probability of a draw in two dimensions, one for White with a higher rating and the other for Black with a higher rating. We found that the time factor and the probability of a draw were very similar to the time factor and the probability of a drawn image analyzed earlier, in that the probability of a draw was lower in very short and very long time frames compared to games played in the 50-100 minute time frame. Also, we were surprised to find that, all things being equal, it seems that the probability of a draw is higher when the black rating is high than when the corresponding white rating is high.
2.6. Summary
This study provides a comprehensive analysis of the relationship between duration and draw probability in chess, revealing a significant positive correlation. The findings underscore the influence of time pressure on strategic decision-making, with broader implications for various high-stakes fields. The robust methodology and validation techniques employed ensure the reliability of the results, paving the way for future research to build upon these insights. Future research could explore the impact of different time controls (e.g., blitz, rapid, and classical formats) on draw probabilities and strategic decision-making. Additionally, investigating the role of player experience and skill levels in influencing the relationship between game length and outcomes could provide deeper insights. Expanding the analysis to include other variables, such as player ratings and opening choices, may also help in understanding the multifaceted nature of strategic decision-making in competitive environments.
3. Discussion and Conclusion
The relationship between time pressure and risk in chess provides an intriguing lens through which to examine decision-making processes under stress. Chess, a game that combines strategy, skill, and psychology, often requires players to make critical decisions in limited time frames. Analyzing how time pressure influences risk-taking in chess can offer valuable insights into cognitive behavior and performance under duress.
3.1. Impact of Time Pressure on Decision-Making in Chess
In chess, players must balance offensive and defensive strategies, often making moves that involve varying degrees of risk. Under time pressure, the nature of these decisions can shift significantly. As the time available decreases, players are less able to conduct thorough evaluations of all possible moves and their consequences. This constraint can lead to two primary types of behavior:
Increased Risk-Taking: Players might opt for aggressive, high-risk moves to force a quick resolution or to capitalize on perceived opportunities. The urgency to act can lead to bold sacrifices or complex tactical combinations that, while potentially rewarding, also increase the likelihood of errors.
Heightened Caution: Conversely, some players may become more conservative under time pressure, prioritizing safety and minimizing the risk of blunders. This risk-averse approach often involves simpler, more predictable moves that reduce the chances of immediate loss but may limit winning opportunities.
3.2. Summary of Investigation Results
The analysis of the provided dataset, which includes chess game durations and draw probabilities, reveals insightful trends about how time pressure influences decision-making and game outcomes. By applying linear regression analysis to the data, the following key results were identified:
Correlation Between Duration and Draw Probability:
There is a discernible relationship between the duration of a chess game and the likelihood of a draw. The regression analysis shows that the longer or shorter the game, the lower the probability of a draw, and that games of medium length tend to have balanced outcomes and are more likely to be draws which suggests that medium-length games, which likely allow for more thorough strategic planning, tend to result in balanced outcomes where neither player can secure a decisive advantage.
Impact of Time Pressure on Decision-Making:
Shorter games, indicative of higher time pressure, are associated with a lower probability of draws. This implies that under time constraints, players are more prone to making decisive moves, which can lead to either a win or a loss rather than a draw. This aligns with the understanding that time pressure can lead to more aggressive or risk-laden decisions. Similarly, the probability of a draw is often low in particularly long games, perhaps because the complexity of the game increases as the game progresses, and long games require them to think and calculate more deeply, which is often accompanied by less precise and optimal decisions that result in wins and losses.
Behavioral Patterns Under Stress:
The findings suggest that players exhibit different behavioral patterns when faced with time constraints. Under high time pressure, there is a tendency towards riskier, more decisive play, whereas extended time allows for more cautious and balanced strategies, resulting in a higher draw rate. However, in particularly long matches, the probability of a draw decreases, which may be related to the fact that long matches lead to player fatigue and a sudden increase in psychological pressure. As a result, they are more likely to overthink, and make wrong judgments and blunders, thus separating the winners from the losers.
References
[1]. Maharaj, S., Polson, N. and Turk, C. (2022) ‘Gambits: Theory and evidence’, Applied Stochastic Models in Business & Industry, 38(4), pp. 572–589. doi:10.1002/asmb.2684.
[2]. Prapaithrakul, T., Sanguanpong, S. and Trakultraipruk, N. (2023) ‘Winning strategies of (i, j) multimove games on Thai, Japanese, and Chinese chess games’, International Journal of Game Theory, pp. 1–17. doi:10.1007/s00182-023-00880-1.
[3]. Hickson, M. (2022) ‘Illusory checkmates: why chess is not a game’, Synthese. An International Journal for Epistemology, Methodology, and Philosophy of Science, 200(5). Available at: https://search-ebscohost-com-s.elink.xjtlu.edu.cn:443/login.aspx?direct=true&db=msn&AN=MR4488269&site=eds-live&scope=site (Accessed: 14 March 2024).
[4]. Biggar, O. and Shames, I. (2023) ‘The graph structure of two-player games’, Scientific Reports, 13(1), pp. 1–12. doi:10.1038/s41598-023-28627-8.
[5]. Poddiakov, A.N. (2022) ‘Intransitively winning chess players’ positions’, Matematicheskaya Teoriya Igr I eë Prilozheniya, 14(3), p. 75. Available at: https://search-ebscohost-com-s.elink.xjtlu.edu.cn:443/login.aspx?direct=true&db=msn&AN=MR4486910&site=eds-live&scope=site (Accessed: 14 March 2024).
[6]. Kocher, M. G., Pahlke, J., & Trautmann, S. T. (2013). Tempus Fugit: Time Pressure in Risky Decisions. Management Science, 59(10), 2380-2391.
[7]. Kishita, R. et al. (2024) ‘Fall risk prediction ability in rehabilitation professionals: structural equation modeling using time pressure test data for Kiken-Yochi Training’, PeerJ, 12. doi:10.7717/peerj.16724.
[8]. Cao, N., Isa, N.M. and Perumal, S. (2023) ‘Effects of Risk Attitude and Time Pressure on the Perceived Risk and Avoidance of Mobile App Advertising among Chinese Generation Z Consumers’, Sustainability (Switzerland), 15(15). doi:10.3390/su151511547.
[9]. Lassiter, G.D. (2000) ‘The relative contributions of recognition and search-evaluation processes to high-level chess performance: comment on Gobet and Simon’, Psychological science, 11(2), pp. 172–173. doi:10.1111/1467-9280.00234.
[10]. Leong, C. et al. (2024) ‘Distinct brain network organizations between club players and novices under different difficulty levels’, Brain & Behavior, 14(4), pp. 1–12. doi:10.1002/brb3.3488.
Cite this article
Wang,R. (2025). The Application of Game Theory-Interesting Phenomena Between Time Pressure and Risk in Chess. Theoretical and Natural Science,87,62-70.
Data availability
The datasets used and/or analyzed during the current study will be available from the authors upon reasonable request.
Disclaimer/Publisher's Note
The statements, opinions and data contained in all publications are solely those of the individual author(s) and contributor(s) and not of EWA Publishing and/or the editor(s). EWA Publishing and/or the editor(s) disclaim responsibility for any injury to people or property resulting from any ideas, methods, instructions or products referred to in the content.
About volume
Volume title: Proceedings of the 4th International Conference on Computing Innovation and Applied Physics
© 2024 by the author(s). Licensee EWA Publishing, Oxford, UK. This article is an open access article distributed under the terms and
conditions of the Creative Commons Attribution (CC BY) license. Authors who
publish this series agree to the following terms:
1. Authors retain copyright and grant the series right of first publication with the work simultaneously licensed under a Creative Commons
Attribution License that allows others to share the work with an acknowledgment of the work's authorship and initial publication in this
series.
2. Authors are able to enter into separate, additional contractual arrangements for the non-exclusive distribution of the series's published
version of the work (e.g., post it to an institutional repository or publish it in a book), with an acknowledgment of its initial
publication in this series.
3. Authors are permitted and encouraged to post their work online (e.g., in institutional repositories or on their website) prior to and
during the submission process, as it can lead to productive exchanges, as well as earlier and greater citation of published work (See
Open access policy for details).
References
[1]. Maharaj, S., Polson, N. and Turk, C. (2022) ‘Gambits: Theory and evidence’, Applied Stochastic Models in Business & Industry, 38(4), pp. 572–589. doi:10.1002/asmb.2684.
[2]. Prapaithrakul, T., Sanguanpong, S. and Trakultraipruk, N. (2023) ‘Winning strategies of (i, j) multimove games on Thai, Japanese, and Chinese chess games’, International Journal of Game Theory, pp. 1–17. doi:10.1007/s00182-023-00880-1.
[3]. Hickson, M. (2022) ‘Illusory checkmates: why chess is not a game’, Synthese. An International Journal for Epistemology, Methodology, and Philosophy of Science, 200(5). Available at: https://search-ebscohost-com-s.elink.xjtlu.edu.cn:443/login.aspx?direct=true&db=msn&AN=MR4488269&site=eds-live&scope=site (Accessed: 14 March 2024).
[4]. Biggar, O. and Shames, I. (2023) ‘The graph structure of two-player games’, Scientific Reports, 13(1), pp. 1–12. doi:10.1038/s41598-023-28627-8.
[5]. Poddiakov, A.N. (2022) ‘Intransitively winning chess players’ positions’, Matematicheskaya Teoriya Igr I eë Prilozheniya, 14(3), p. 75. Available at: https://search-ebscohost-com-s.elink.xjtlu.edu.cn:443/login.aspx?direct=true&db=msn&AN=MR4486910&site=eds-live&scope=site (Accessed: 14 March 2024).
[6]. Kocher, M. G., Pahlke, J., & Trautmann, S. T. (2013). Tempus Fugit: Time Pressure in Risky Decisions. Management Science, 59(10), 2380-2391.
[7]. Kishita, R. et al. (2024) ‘Fall risk prediction ability in rehabilitation professionals: structural equation modeling using time pressure test data for Kiken-Yochi Training’, PeerJ, 12. doi:10.7717/peerj.16724.
[8]. Cao, N., Isa, N.M. and Perumal, S. (2023) ‘Effects of Risk Attitude and Time Pressure on the Perceived Risk and Avoidance of Mobile App Advertising among Chinese Generation Z Consumers’, Sustainability (Switzerland), 15(15). doi:10.3390/su151511547.
[9]. Lassiter, G.D. (2000) ‘The relative contributions of recognition and search-evaluation processes to high-level chess performance: comment on Gobet and Simon’, Psychological science, 11(2), pp. 172–173. doi:10.1111/1467-9280.00234.
[10]. Leong, C. et al. (2024) ‘Distinct brain network organizations between club players and novices under different difficulty levels’, Brain & Behavior, 14(4), pp. 1–12. doi:10.1002/brb3.3488.