


1. Introduction
Trace the history of the development of optical phenomena, in 1869, the British physicist John Tyndall conducted a series of experiments on the scattering of light, Tyndall found that the light beam through the medium containing small particles, such as suspensions and colloidal solutions, will be scattered, when the light passes through the colloid, from the perpendicular to the direction of the incident light can be observed in the direction of a pathway of light, this light "! This bright "pathway" is formed due to the scattering of light by colloidal particles. The Tyndall effect is a colloid-specific property, which originates from particles with a size of about 1-100 nm in the colloidal dispersed phase. However, the lack of understanding of the nanoparticle and molecular scales at that time resulted in Tyndall's inability to fully explain this phenomenon and to fully understand the effects of particle size, shape, and distribution on scattering. It was not until the twentieth century that Rayleigh scattering and Mie scattering further developed the theory of light scattering, explaining the scattering behavior of small and large particles, respectively [3,4]. Rayleigh scattering occurs when the particle size is much smaller than the wavelength of light, and the scattering intensity is inversely proportional to the fourth power of the wavelength of light. Mie scattering occurs when the particle size is greater than or equal to the wavelength of light, and the scattering intensity and directivity are affected by the particle size, shape, and refractive index of the medium. The two scattering mechanisms, Rayleigh scattering and Mie scattering, work together to cover most of the particle size range and explain the Tyndall effect more fully[5,6].
The Tyndall effect is influenced by a number of factors including particle size, concentration, shape, refractive index of the medium, the as well as the wavelength of light and the intensity and type of light source. The size of the particles is one of the most important influences on the Tyndall effect, and the aim of this experiment was to investigate the effect of particle size on the Tyndall effect, so in order to control the variable, only the particle size of the solution was varied when all other factors were the same, and three types of milk with different fat contents were used for the solutions in this experiment: whole milk, low-fat milk and skimmed milk. Whole milk has a high fat content and therefore large fat globule sizes, usually between 1-10 microns, and low-fat milk has lower fat globule sizes than whole milk, at Between 0.5 and 5 microns, skimmed milk has a very low-fat content, with fat globules much smaller than the previous two types of milk.
In addition to this, before deciding on the microscopy system for this experiment, I went online and researched the three most common microscopy systems available on the market: light microscopy, confocal microscopy and scanning electron microscopy [7-10].
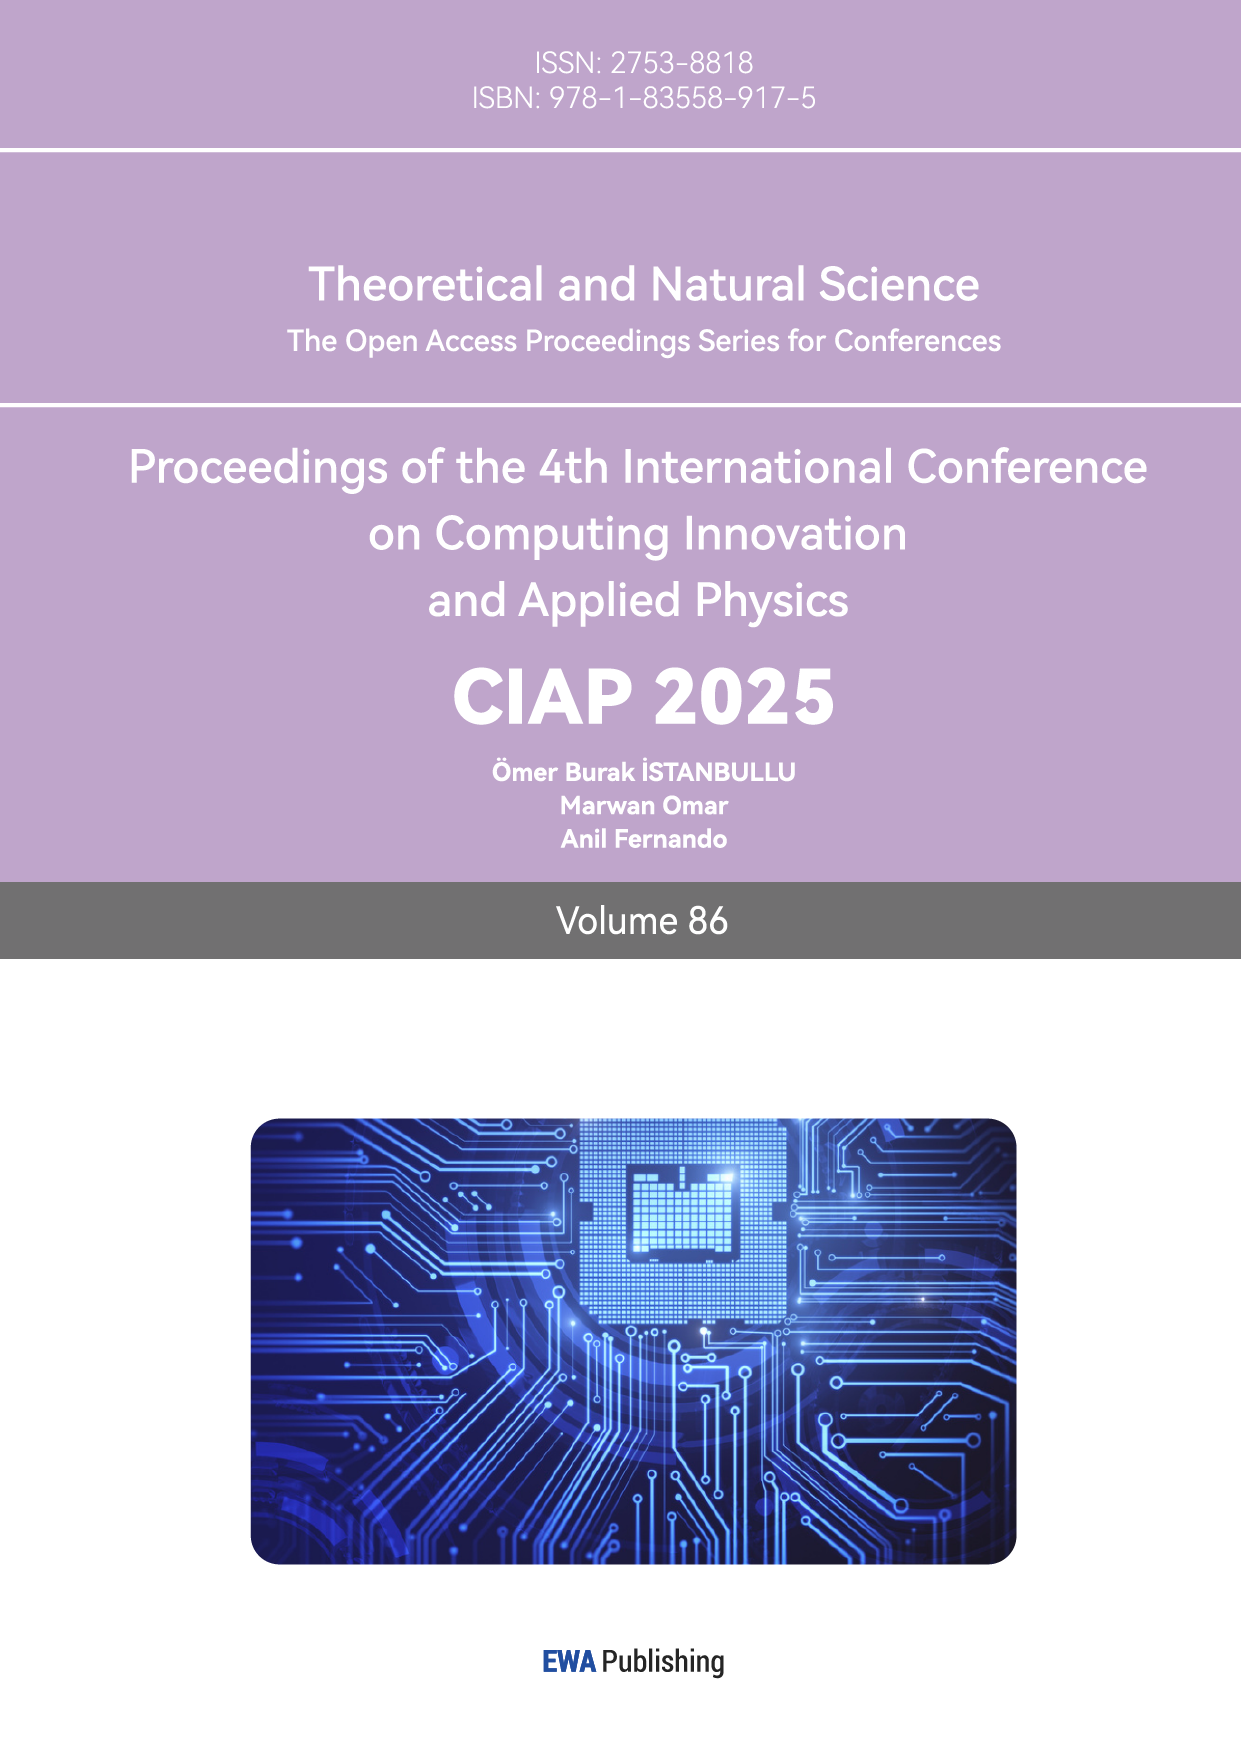
The first type of optical microscope is the most basic and commonly used microscopic techniques, using visible light and lens system imaging, through the transmission or reflection of light to generate magnified images of the sample, the operation is simple and low-cost, but there are also shortcomings, his resolution depends on the objective lens of the microscope and the wavelength of the light source, the optical microscope's resolution limit is limited by the wavelength of the light, usually around 200 nanometers, unable to image smaller nanostructures, and is unable to observe small.
Secondly, an optical microscope requires a complex lens system and alignment that requires regular maintenance and calibration. Secondly, optical microscopes require complex lens systems and alignment that need to be regularly maintained and calibrated, and lastly, optical microscopes cannot simultaneously acquire three-dimensional information about Young & Flat because they can only image at a specific focal plane.
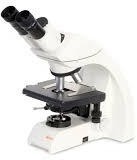
Figure 1: Optical microscope
The second type of confocal microscope uses a laser as a light source whose wavelength can be adjusted so that the sample is at a specific fluorescence at wavelengths by precisely controlling the focus of the laser and the filtering function of the pinhole, removing the light from the sample its ,
Scattered light and uncorrelated light signals from other planes or out-of-focus regions, and only light from the focal plane, enter the detector, improving imaging clarity and creating clear optical slices. The sample is then scanned several times to form a series of optical slices, which ultimately results in three-dimensional information about the sample. However, confocal microscopy requires a laser and a high-precision optical system, which is costly. The confocal microscope needs to scan the sample point by point, collect the optical signals row by row and column by column, then adjust the focal length to scan the sample at different depths and finally demonstrate the 3D reconstruction of the sample based on a series of optical slices, which makes the imaging speed slower, and the operation consumes a lot of time.
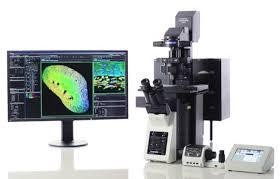
Figure 2: Confocal microscope
The last type of scanning electron microscope principle is based on the interaction of the electron beam with the surface of the sample and generates images by detecting signals such as secondary electrons, backscattered electrons etc. However, electron microscopes require a vacuum environment, which is a major limitation for liquid samples, which must be treated in a special way, making the preparation of the experiment complicated. Secondly, electron microscopes are very expensive and require specialized technicians to operate.
Figure 3: Scanning electron microscope
In summary, the three commonly used microscope systems on the market have major drawbacks, so in order to reduce the cost of this experiment, complexity, operational difficulties, and improve the efficiency of the experiment, this experiment choose to build their own simple
The advantages of a single digital holographic imaging system over the first three microscopy systems are: 1. Inexpensive, only the cost of the CMOS chip, LED light source and resin holder can be controlled within 2000 RMB. 2. Simple experimental operation, compared with the cumbersome and time- consuming operation of the focusing microscope, digital holographic imaging can record and capture the whole sample area at one time without scanning the samples one by one, and the imaging speed is fast, which greatly enhances the efficiency of the experiment. 3. Simple sample preparation, unlike the electron microscope which requires special treatment of the samples, digital holographic lensless imaging can be performed in an atmospheric environment. Unlike electron microscopy, which requires special treatment of the sample, digital holographic lensless imaging can be carried out in an atmospheric environment, so there is no need for complex sample preparation to capture the scattering paths and intensity changes of light in the medium, and quantitatively analyze the light scattering characteristics of the Tyndall effect.
In this paper, we hope to quantitatively analyze the light scattering characteristics of the Tyndall effect by capturing the scattering path and intensity changes of light in a medium using lensless microimaging techniques, observe and record the size of particles in a suspension and thus gain a deeper understanding of the microscopic mechanism of the Tyndall effect by comparing the microscopic images of different suspensions.
2. Pre-laboratory
The experiment in this paper is a pre-experiment that uses simple equipment to perform a basic Tyndall effect experiment in order to directly observe the difference in the phenomenon of the Tyndall effect in colloids with different particles, as an aid to the introduction of holographic microscopy at a later stage. The equipment I used in the pre-experiment were: four 50mL beakers, droppers, LED light source, and milk.
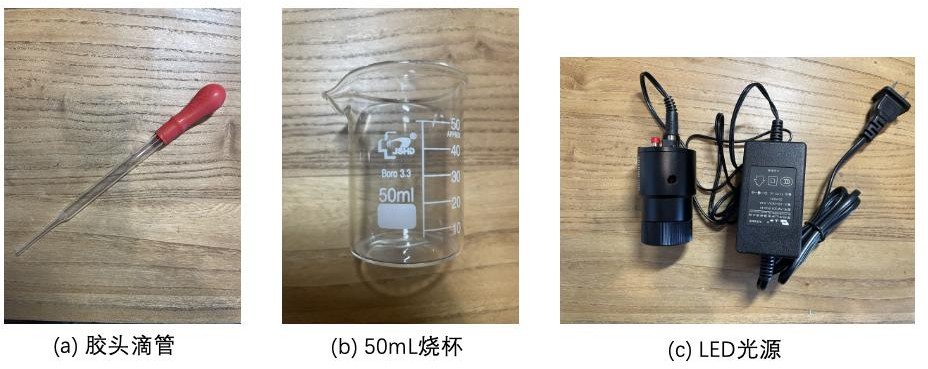
Figure 4: (a) Glue tip burette (b) 50 mL beaker (c) LED light source
This pre-experiment used the same brand of milk with different fat contents to ensure that the milk contains nothing but fat
Other than the size of the balls, the other ingredients are almost identical, including skimmed milk: 0 grams of fat per 100 ml; low-fat milk: 1.4g of fat per 100ml; whole milk: 3.5g of fat per 100 ml
The other nutrients in these three types of milk are almost equal. The other nutrients in these three types of milk are almost equal, with about 3.5 grams of protein, calcium about 130 mg and sodium about 50 g. It was hoped to vary the fat globule content of the milk at almost the same level of other particulate content, so that the effect of 🎧 particulate content on the intensity of scattering of the Tyndall effect could be observed directly with the naked eye.
In the pre-experiment, skimmed milk was pipetted into two drops of 50mL of water, stirred thoroughly, and then a green LED light source was directed into the colloid, and the same procedure was repeated twice using low-fat milk and whole milk. At first I used concentrated milk directly without dilution and did not observe a clear light path, later I diluted the milk and prepared a milk solution by putting two drops of concentrated milk into 50mL of water with a dropper and eventually observed a bright path. It was later found that this was because the high density of the concentrated milk particles prevented significant penetration and scattering of the light and hence the Tyndall effect was not observed, whereas the diluted milk solution had a low density of particles so that it could be scattered, thus producing the Tyndall effect.
Eventually, it can be observed that in all three types of milk, clear light paths can be seen.
However, the desired effect was not achieved, and we were unable to directly observe a clear difference in the Tyndall effect in the three experiments. Therefore, the lensless microimaging technique was next invoked to obtain more comprehensive information on particle properties to analyze the light scattering characteristics in milk with different fat contents for microscopic particle measurements in liquids. The effect of particle size on the Tyndall effect was observed in a more detailed and comprehensive manner at the microscopic level.
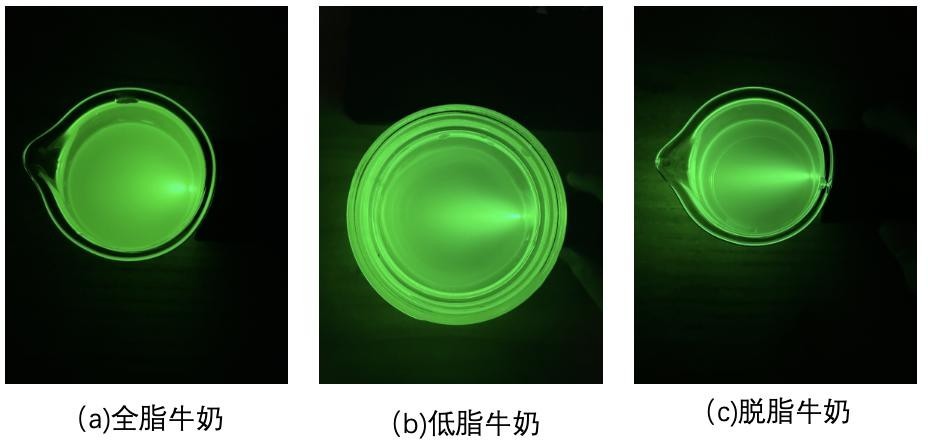
Figure 5: The Tyndall effect in milk:( a ) Tyndall effect in whole milk,( b ) Tyndall effect in low-fat milk, (c) Tyndall effect in skimmed milk
In order to explore the microscopic mechanism of the Tyndall effect more accurately, this paper adopts a digital holographic microscopy-based approach to carry out microscopic measurements of particles. Therefore, the explanation of the basic principles in this paper is divided into two main parts: the basic principle of light scattering and the principle of digital holographic microscopy. The first part explains the nature of the Tyndall effect by combining the formulae: the scattering of light, including Mie scattering and Rayleigh scattering; the second part explains the principles of the microscope system used in this experiment, which is used to record the information of reproducing three-dimensional objects and recovering the phase information of the objects, respectively.
3. Basic principles of light scattering
3.1. Principles of Lensless Microscopic Imaging
The Tyndall effect occurs when light is scattered by colloidal particles, making light beams visible in the medium. Light, as an electromagnetic wave, polarizes particles into dipoles that emit electromagnetic waves when they vibrate, causing scattered light. Scattering occurs when light encounters inhomogeneities like particles or molecules. The Tyndall effect involves both Rayleigh and Mie scattering, depending on particle size. Mie scattering dominates when particles are close to or larger than the light's wavelength, and its scattered light intensity is influenced by particle size.
Rayleigh scattering, relevant for much smaller particles, is more sensitive to light wavelength, with scattered intensity inversely proportional to the fourth power of the wavelength and proportional to the sixth power of the particle radius. Scattered light intensity also varies with observation angle, showing a polarization pattern.
This study explores the relationship between particle size and scattering intensity using milk with different fat contents, which alters fat globule size. Lensless microimaging was employed to analyze light scattering in milk, providing detailed insights into particle characteristics.
3.1.1. Holographic Microscopic Recording
This experiment uses holographic imaging to measure and record three-dimensional objects, observing the size, shape, and distribution of particles in suspension. Since this technique records phase information, it offers high resolution and does not require lenses. The principle of holographic imaging consists of two main processes: interference recording and diffraction reproduction, which together capture the object's phase, amplitude, and light field information.
In interference recording, a laser beam is split into two: a reference light wave R(x,y)R(x, y)R(x,y) and an object light wave O(x,y)O(x, y)O(x,y). The interference pattern between these two waves is recorded by a CCD as a hologram. The recorded intensity I(x,y) is the square of the sum of the object and reference light:
I(x, y) = |O(x, y) + R(x, y)|^2
Expanding this gives:
I(x, y) = |O(x, y)|^2 + |R(x, y)|^2 + O(x, y)R^*(x, y) + O^*(x, y)R(x, y)
The first two terms |O(x, y)|^2 and |R(x, y)|^2 are constants representing self-interference of the object and reference waves. The latter two terms, O(x, y)R^*(x, y), contain the object's light field information, and O^*(x, y)R(x, y) is the conjugate term, recording phase information.
In diffraction reproduction, the hologram is illuminated by the same light source as the object wave. This diffraction process reproduces the true and conjugate images of the object. The light field O′(x,y) is expressed as:
O'(x, y) ∝ O(x, y) ⋅ R(x, y)
Substituting the intensity I(x,y) gives:
O'(x, y) ∝ |O(x, y)|^2 + |R(x, y)|^2 + O(x, y)R^*(x, y) + O^*(x, y)R(x, y)
This equation can be split into three parts:
1. O(x, y)R(x, y): the first-level image, which represents the true light field of the object and contains its 3D information.
2. O^*(x, y)e^{2iϕ_r}: the conjugate term, which is the mirror image of the object light.
3. |R(x, y)|^2: the background light.
By using Fourier transform, the distribution of the reproduced light field in different spatial locations can be calculated, allowing predictions of how the image will appear on various surfaces.
The experiments in this paper are divided into three main sections, the recording of the Tyndall effect for skimmed milk, low-fat milk and whole milk.
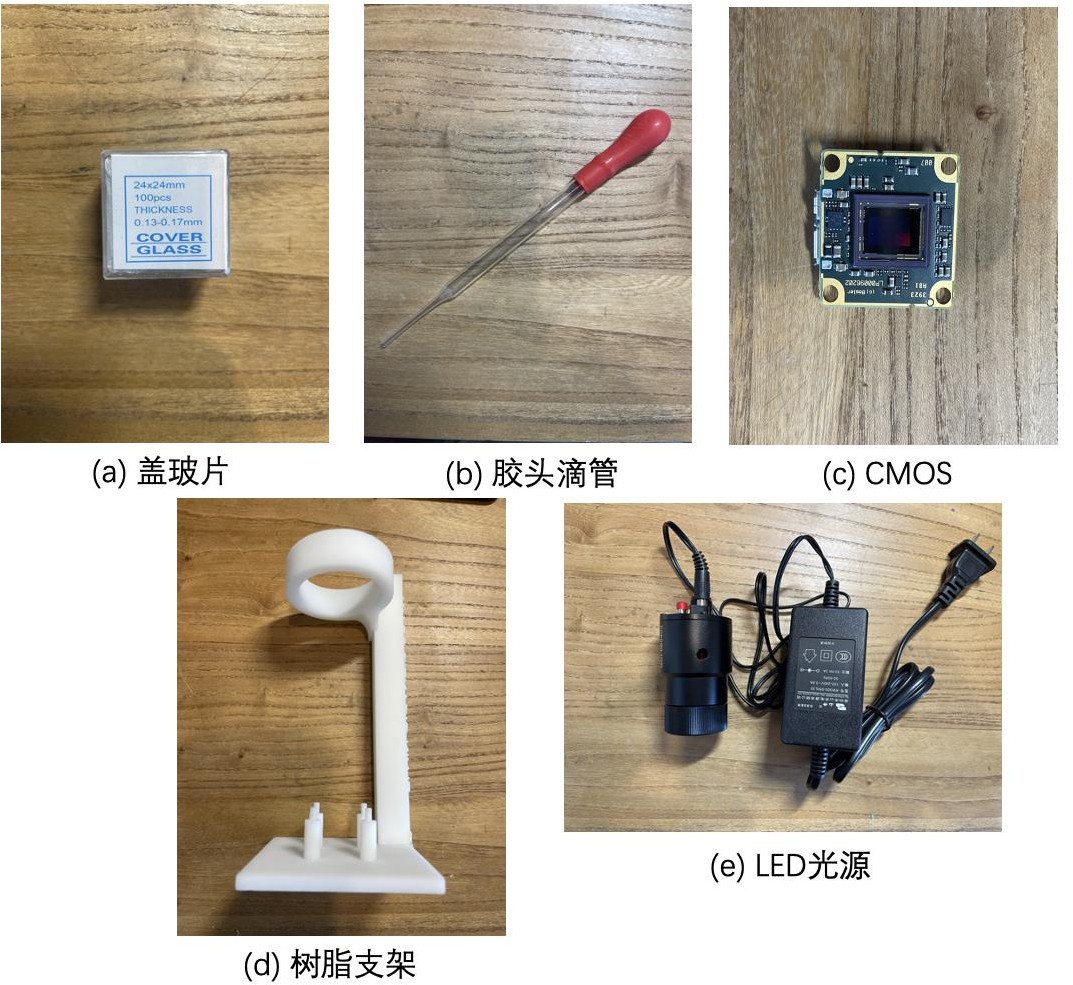
Figure 6: (a) Coverslip (b) Glue tip burette (c) CMOS (d) Resin holder,(e) LED light source
The DHC GCI-0604 series LED light source was used in this experiment, which is a green LED with a wavelength of 632 nm.
The light source, with good monochromaticity, has a fixed wavelength, thus better interacting with the particles in the solution, enhancing the light scattering effect, making the scattering more uniform and clearer, facilitating the observation of the light beam path, and making the light path clearer in the visible light range. As this experiment was taken in a dark environment, the clear light path can be recorded more intuitively and accurately, facilitating quantitative analysis in the later stage. In addition, this experiment used a Basler dart R daA3840-45um (CS-Mount), and the Sony IMX334CMOS chip in the camera was removed from the camera, and only the CMOS chip was used in the experiment, with a pixel size of 2 μm × 2 μm, so that the smaller pixel size can improve the resolution of the sensor, and obtain a more detailed and clear image, retaining details when zoomed in, with are solution of 3840px*2160px.Since no color-based analysis is required for this experiment, this chip is black and white (mono).
In preparation for the formal lensless microscopy experiment, I also designed a resin holder for this experiment ( d ), which was 3D printed and modelled to hold the CMOS and the LED light source. In order to allow the beam from the LED light source to reach the center of the CMOS, the center of the circular structure above the bracket is aligned with the center of the rectangle formed by the four pillars below. The four pillars are spaced 25.6mm apart, equal to the distance between the holes in the four vertices of the CMOS chip, and the four holes are 3mm in diameter, allowing them to fit into the convex structure above the bracket's pillars. In addition to this, the upper circular structure can be slid to adjust the distance between the light source and the CMOS. The lower column structure holds the CMOS in the air so that the CMOS can dissipate heat in time during the experiment.
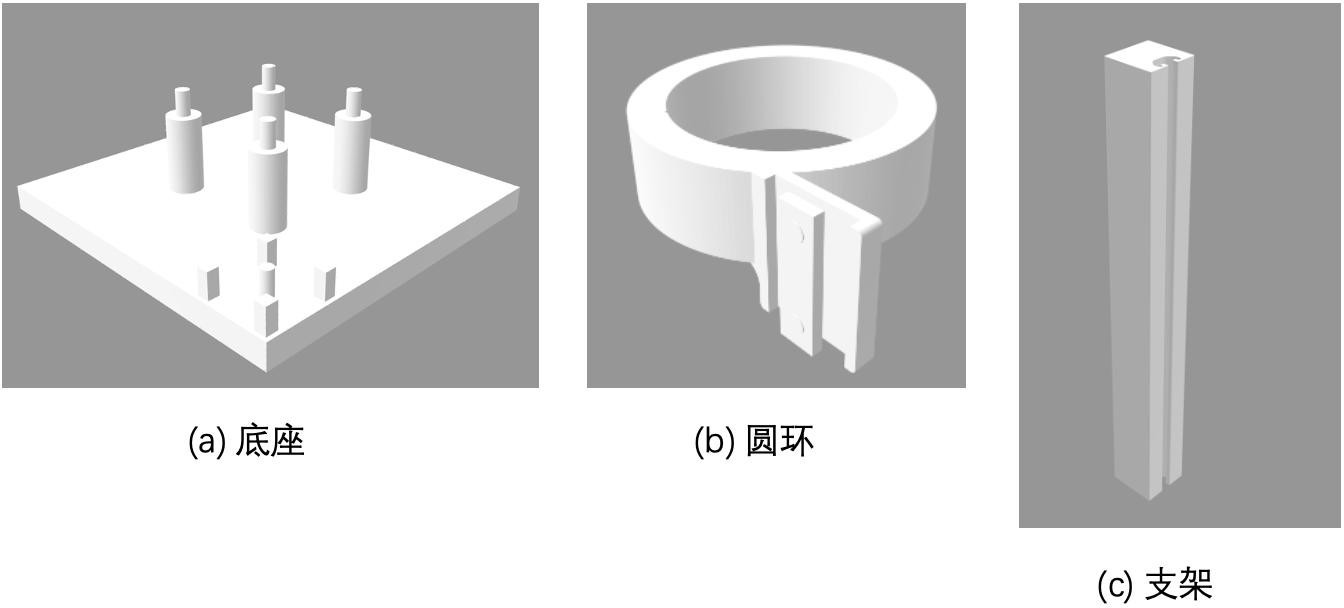
Figure 7: Bracket model:(a) base,(b) ring,(c) bracket
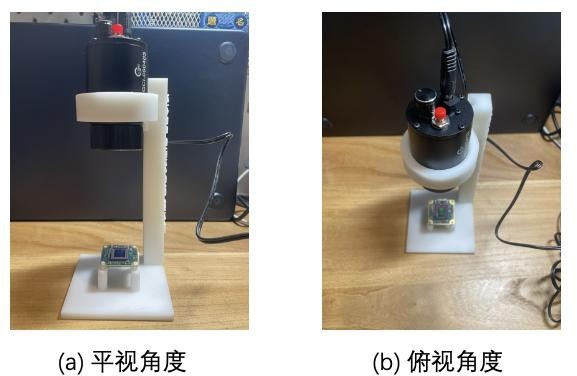
Figure 8: Bracket placement: (a) flat view angle,(b) top view angle
The first step was to place all the experimental equipment on the corresponding positions of the stand and fix them. Connect the CMOS to the computer and open the Pylon viewer to record the holographic microscope image. Step 2 Place a coverslip on the CMOS, turn off all other light sources in the lab to create a dark environment, and turn on the LED light source. Use Pylon viewer to record the image, this image is the background image of the experiment.
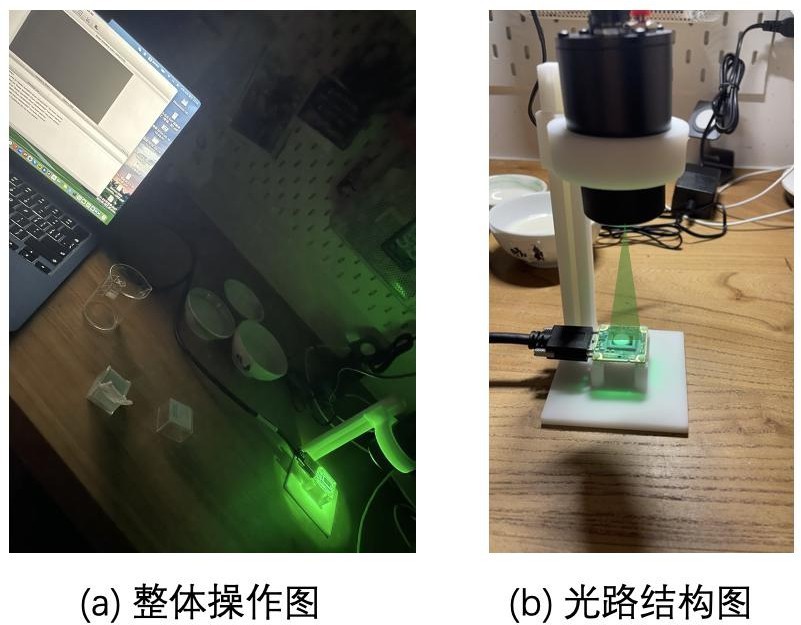
Figure 9: Experimental operation diagrams:(a) overall experimental operation diagram,(b) optical path structure diagram
Next a different coverslip was changed and a solution of different levels of milk was started to be dropped on it. This experiment was the same as the pre-experiment in that different fat content of milk was used so as to control the variables. Two drops of skimmed milk were placed on the coverslip and then the coverslip was placed over the CMOS, this step prevented the CMOS from coming into direct contact with the experimental solution and prevented the CMOS from being damaged by the liquid. Next, repeat the above steps to turn off its
If you have a light source of your choice, switch on the LED light source and record the corresponding image with Pylon viewer.
The milk method was the same, during which the coverslips were changed for each experiment to prevent them from being contaminated with the solution from the previous experiment and interfering with the results.
3.2. Experimental data processing
3.2.1. Acquisition of holograms
Eventually, through the experiment above, we obtained three images of the Tyndall effect for different milks as well as a background image for post reference.
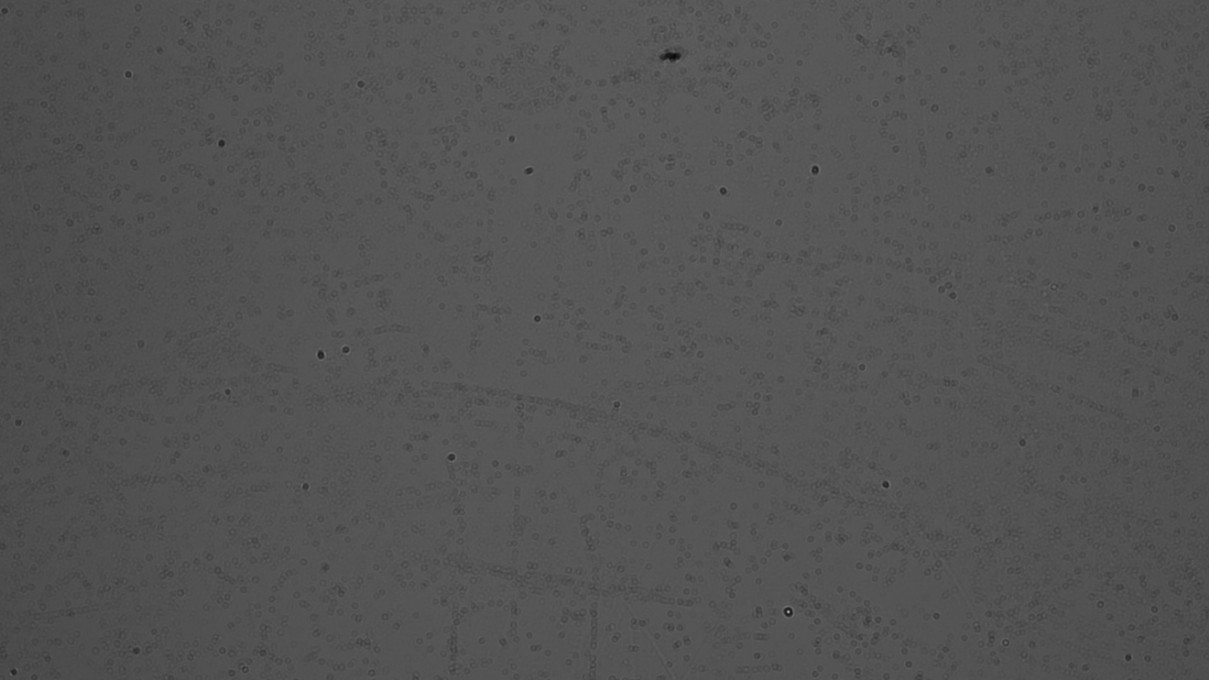
Figure 10: Background hologram
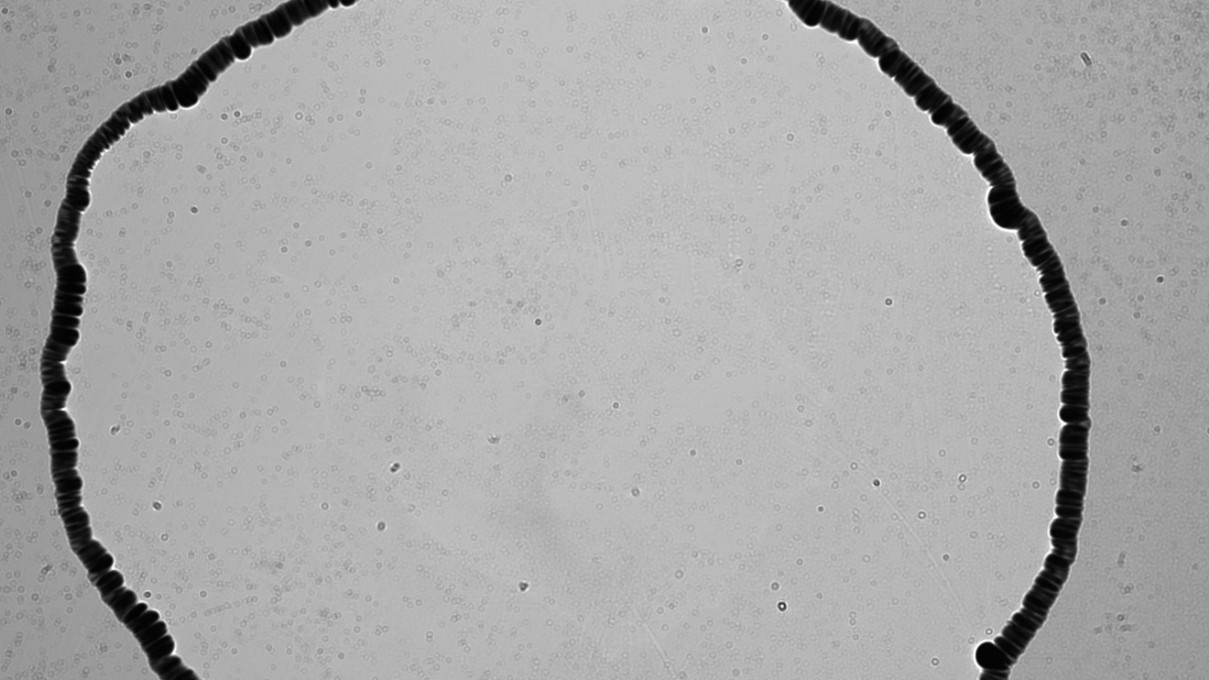
Figure 11: Hologram of the Tyndall effect for skimmed milk
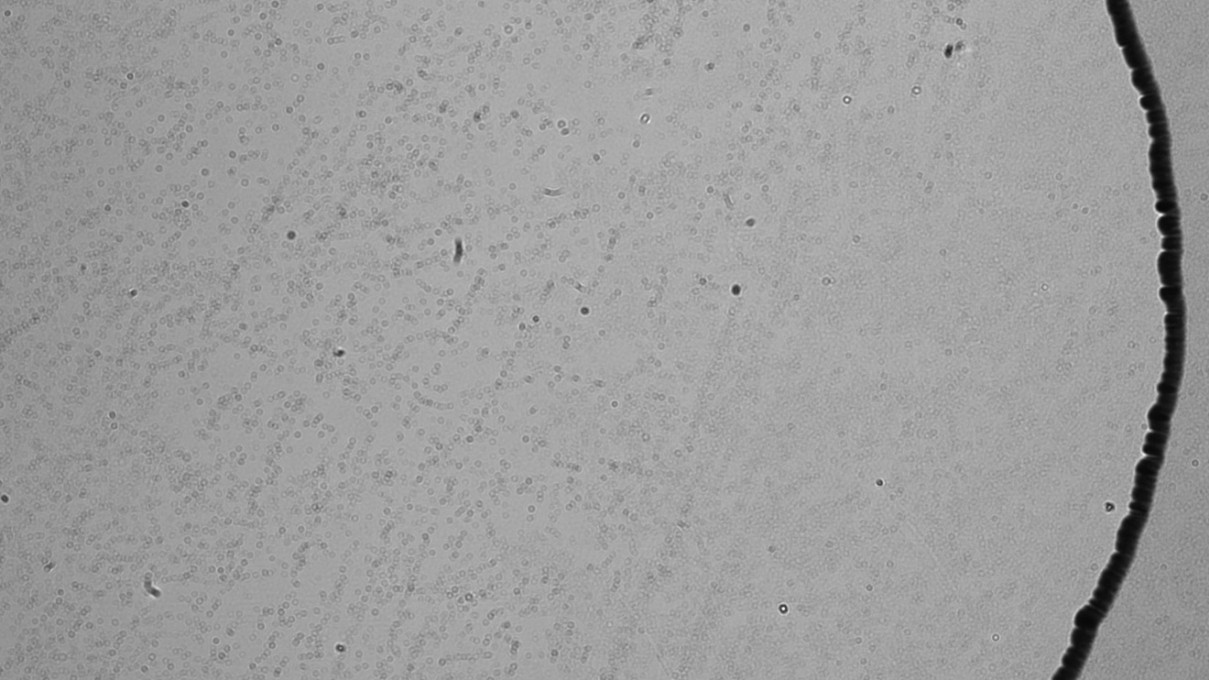
Figure 12: Hologram of the Tyndall effect for low-fat milk.
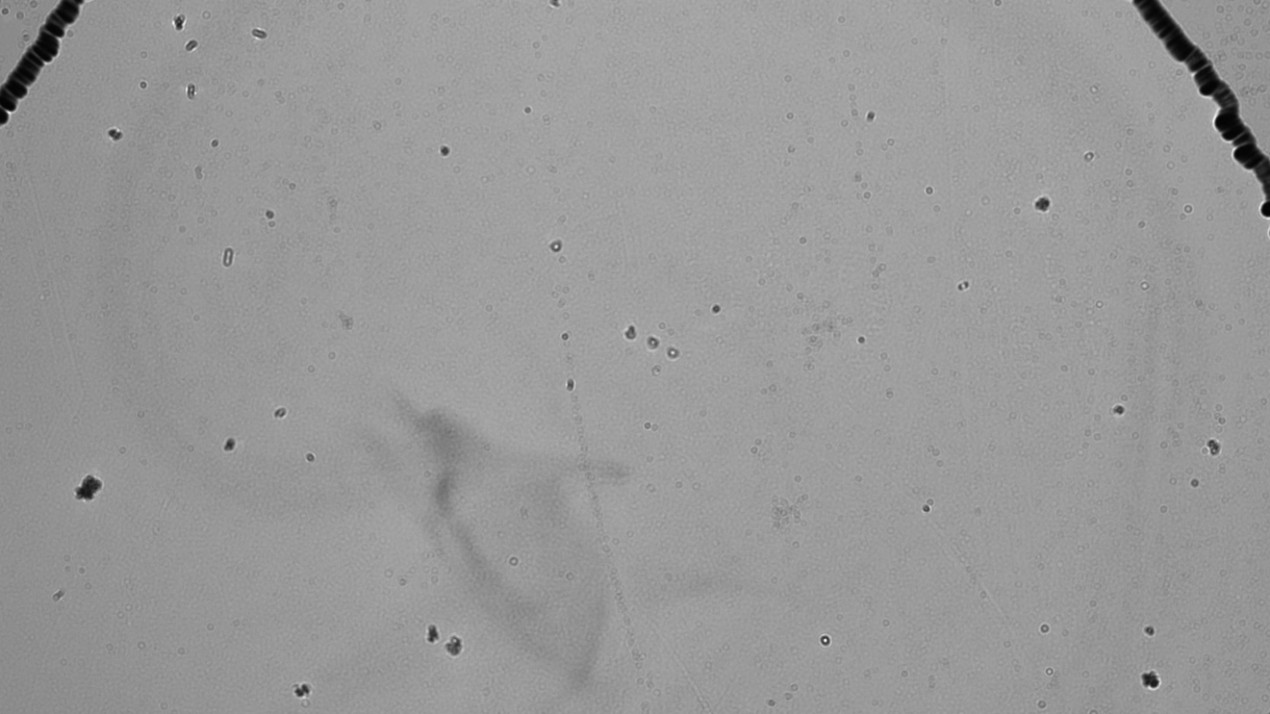
Figure 13: Hologram of the Tyndall effect for whole milk
3.2.2. Holographic micro reconstruction
When the holograms are acquired, the original holograms are processed based on the basic principles of digital holographic reconstruction (GS iteration) in Section 3.2 to obtain the two-dimensional light intensity information and the three-dimensional phase images of low-fat, full-fat, and skimmed milk, respectively, and based on the obtained images, further qualitative analyses are performed.
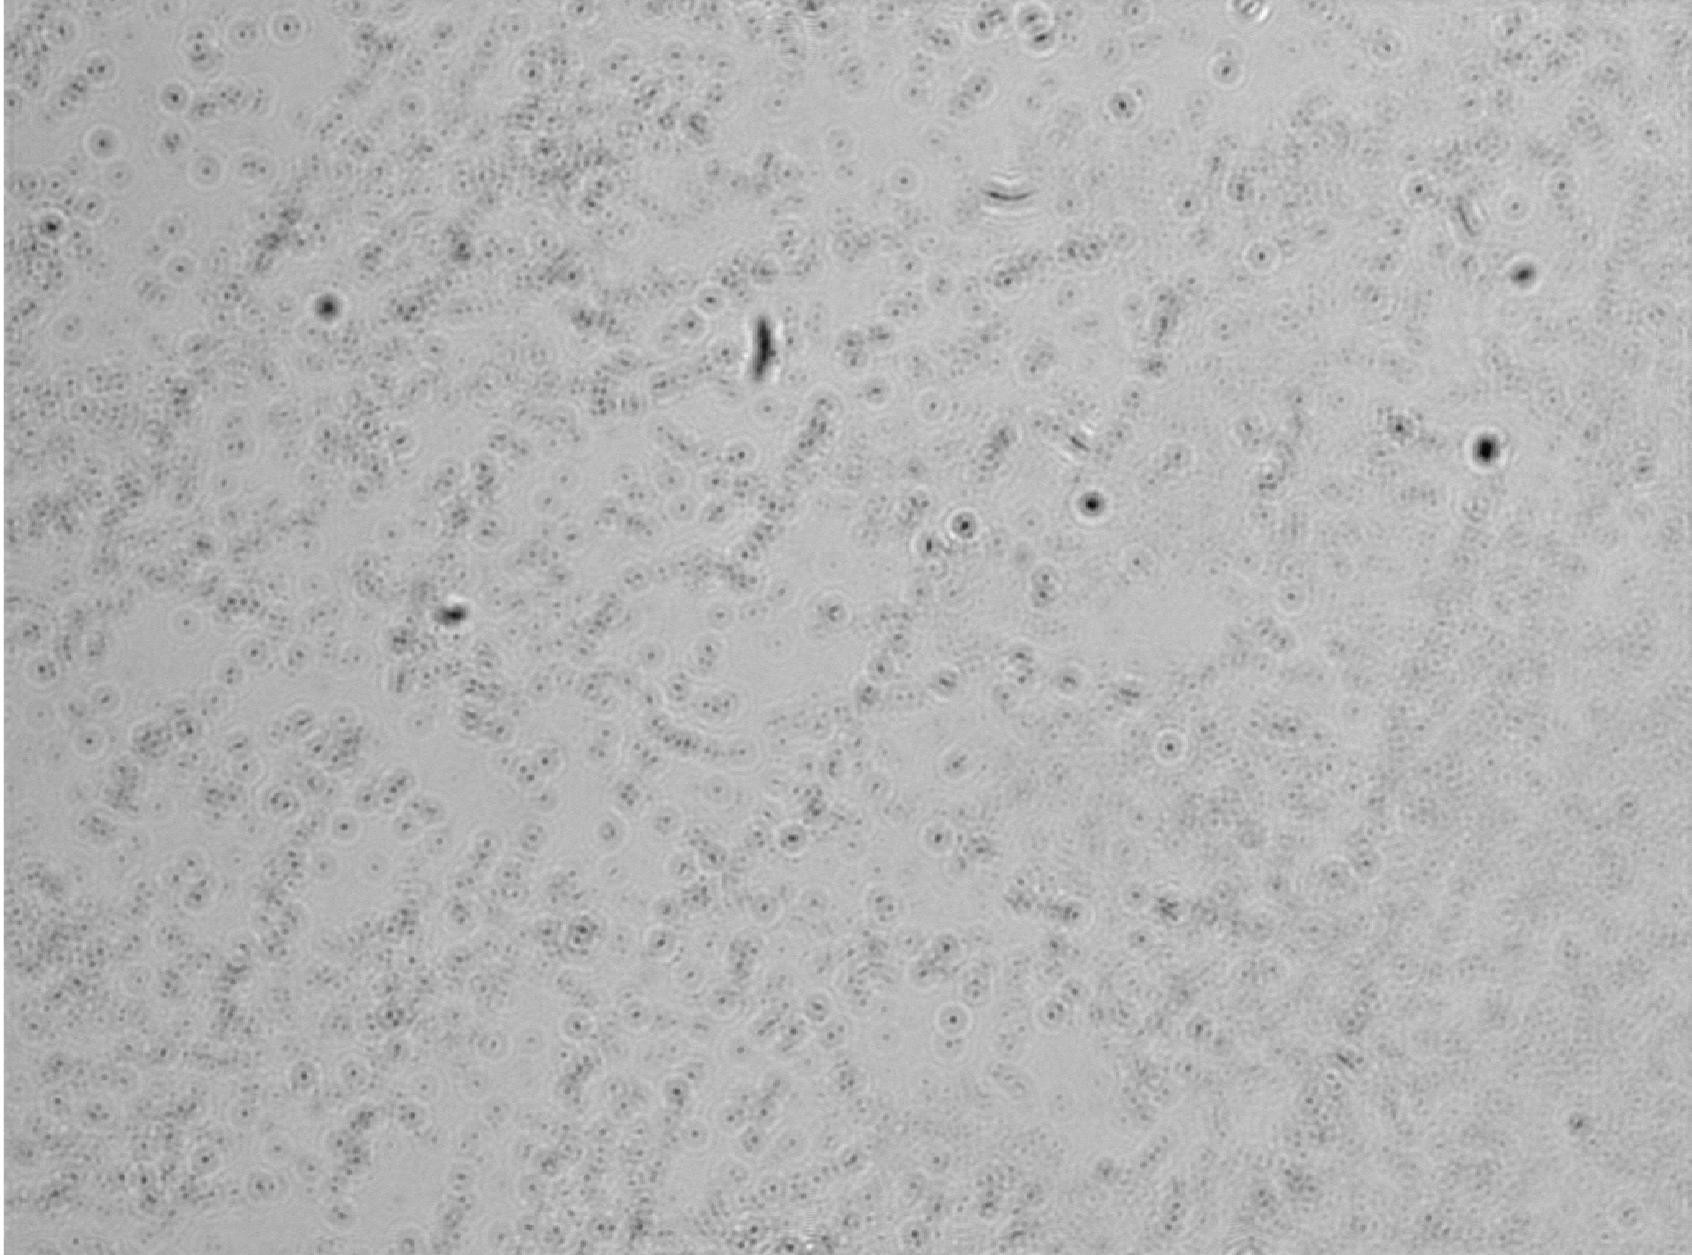
Figure 14: Low-fat milk Tyndall effect light intensity plot
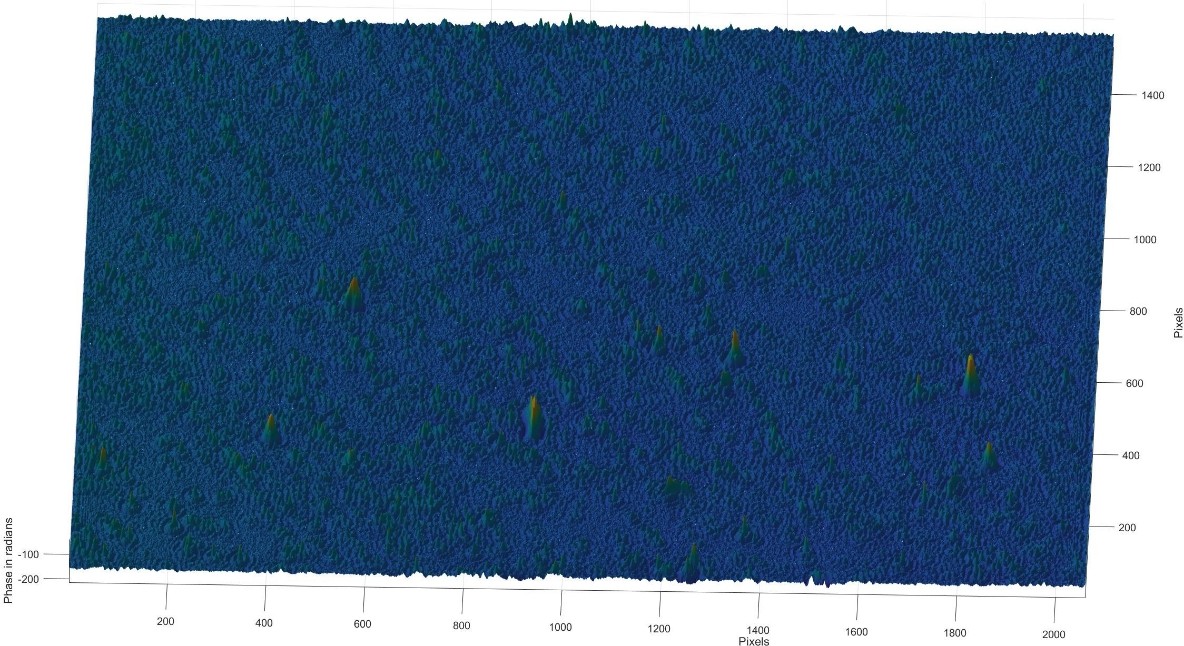
Figure 15: 3D phase diagram of the Tyndall effect for low-fat milk.
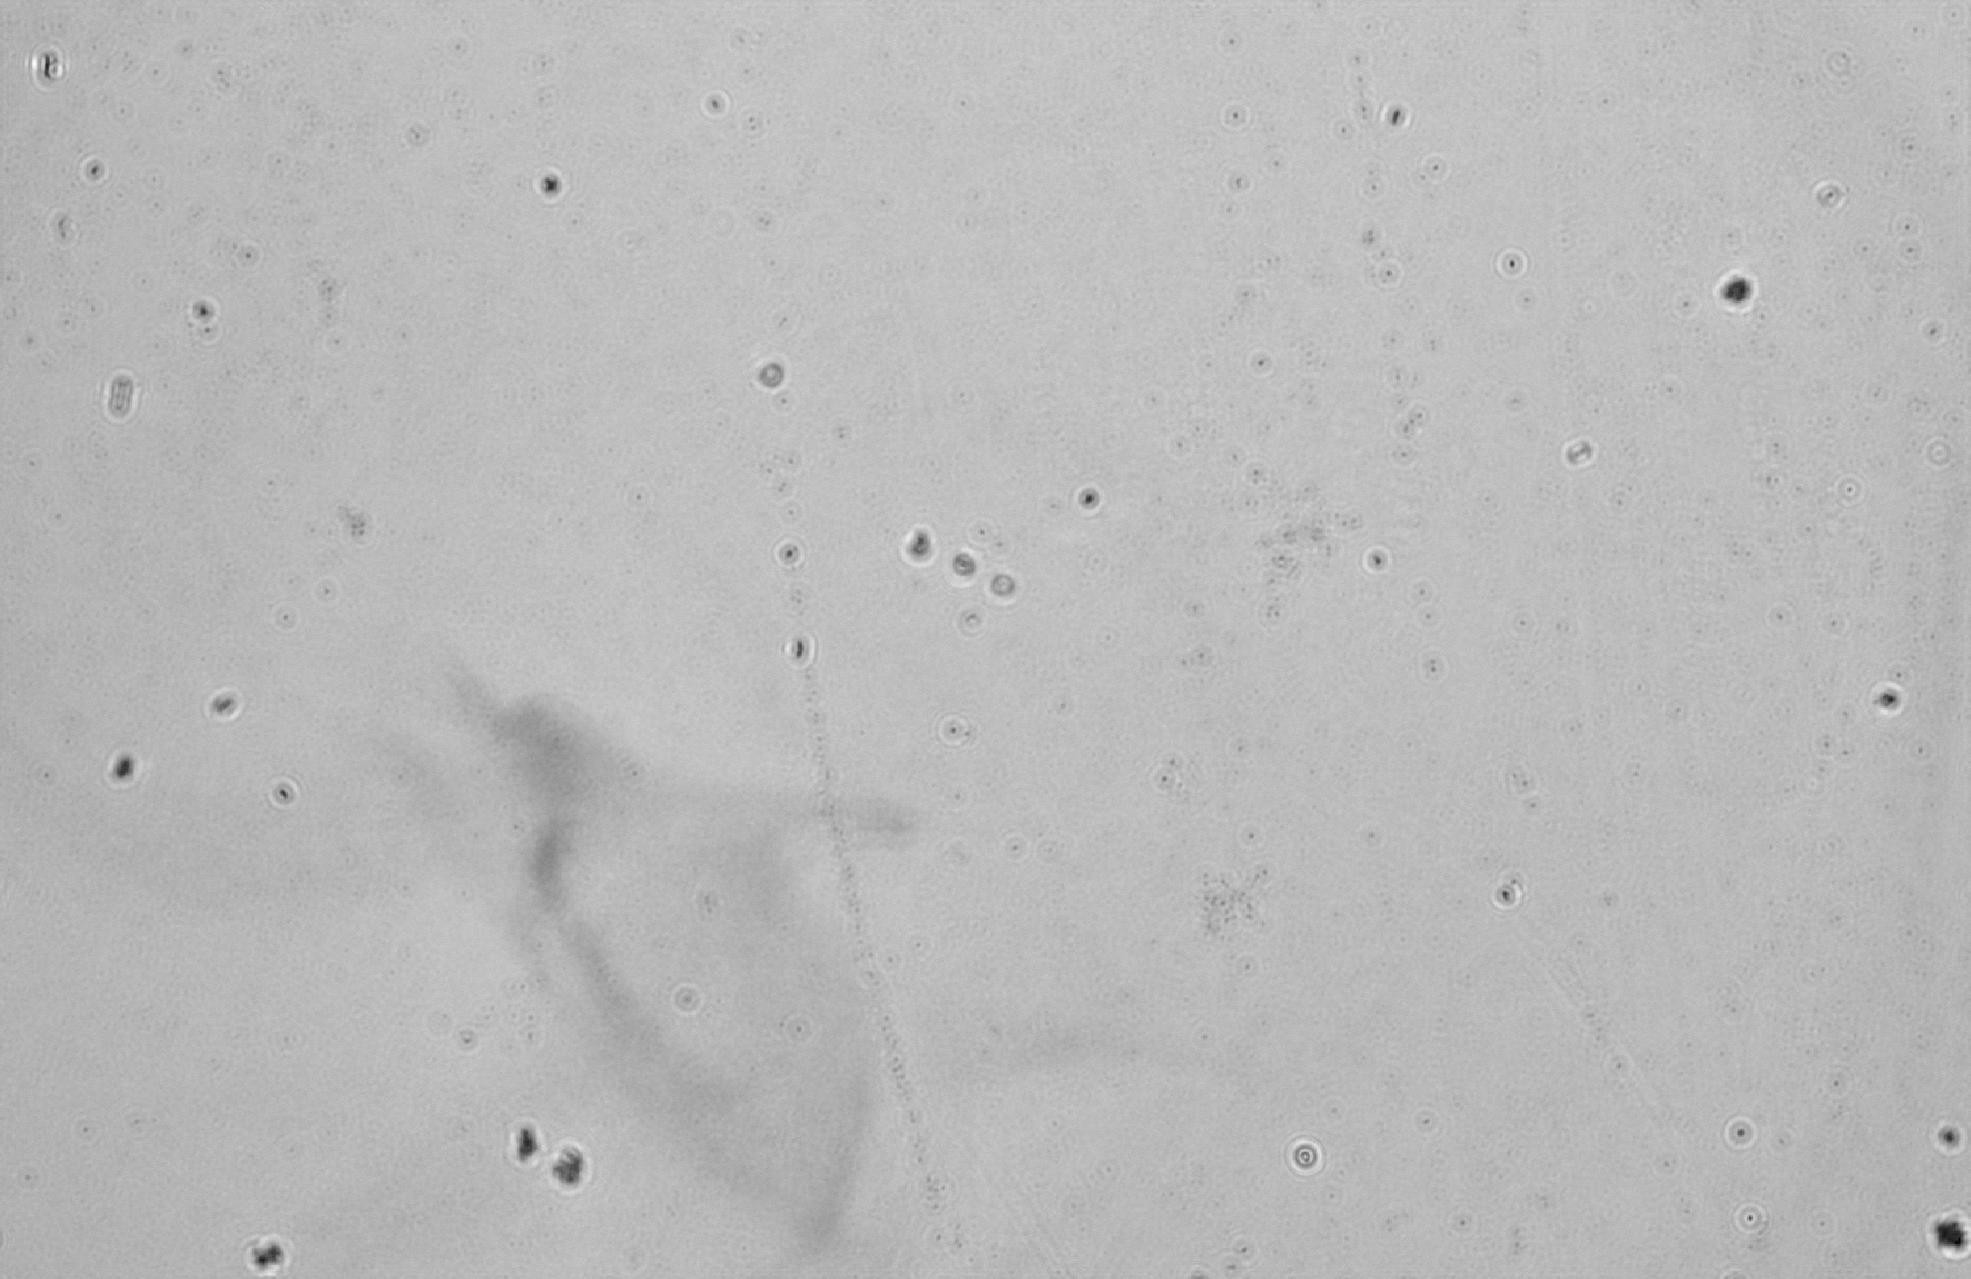
Figure 16: Whole milk Tyndall effect light intensity plot
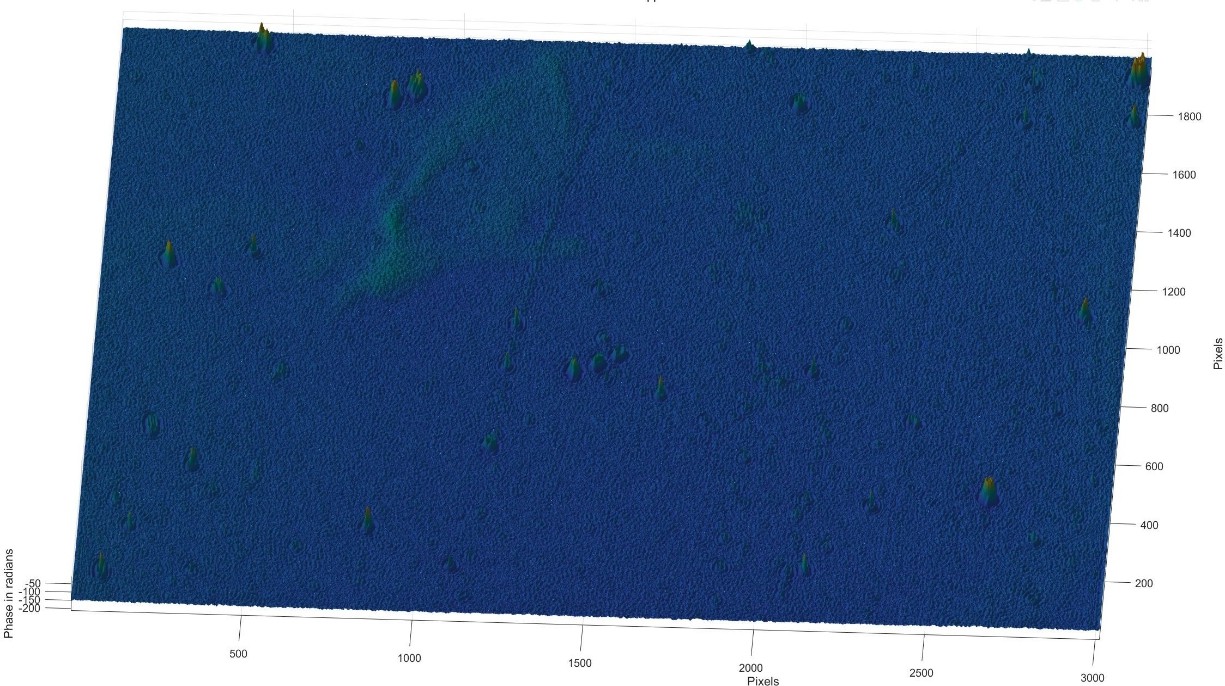
Figure 17: 3D phase diagram of the Tyndall effect for whole milk
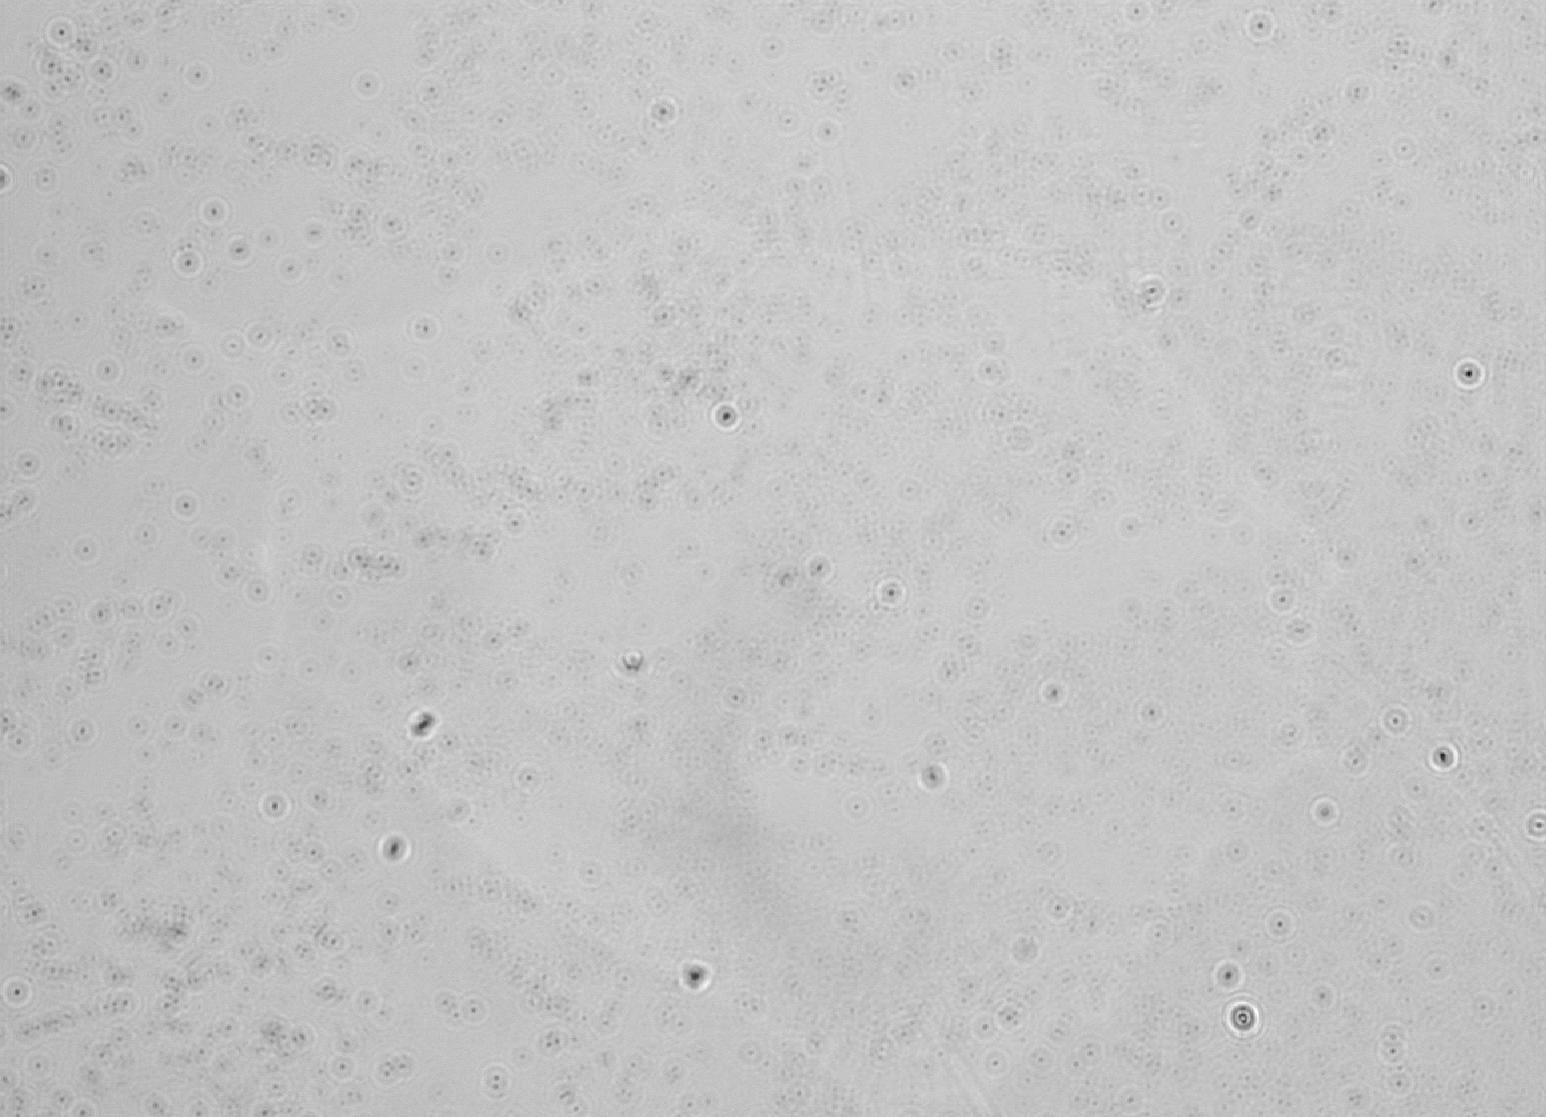
Figure 18: Two-site light intensity plot of the Tyndall effect for skimmed milk
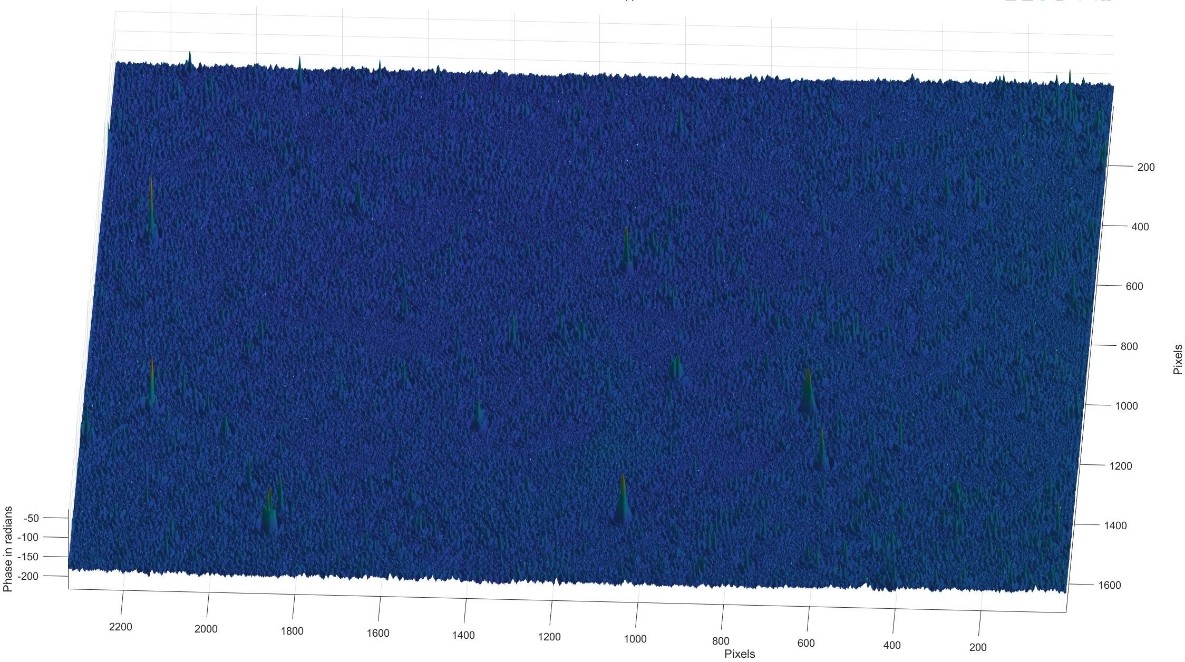
Figure 19: 3D phase diagram of the Tyndall effect for skimmed milk
3.3. data analysis
Based on the images of low-fat, skimmed and whole milk particle sizes measured by digital holographic microscopy, we can perform detailed comparative analyses and summaries.
3.3.1. Low-fat milk
As can be seen from the images, the particles of low-fat milk are relatively uniformly distributed in the full field of view, with relatively small particles and an overall smooth surface. In low-fat milk, the fat globules are generally smaller in size and denser due to the reduced fat content. As a result, the height of the particles does not vary significantly in the hologram, indicating a lower phase difference.
Particle size: The particles are small and evenly distributed.
Phase variation: Lower phase variation indicates a more uniform thickness and density of particles.
3.3.2. Skimmed milk
Images of skimmed milk show a very even distribution of particles, with few visible protrusions or larger particles. This is because skimmed milk has a very low-fat content and fat globules are almost non-existent, so the particles are very small. In the holograms, skimmed milk shows the least amount of phase variation, indicating that it has a very fine particle structure and uniform.
Particle size: very small and uniform particle structure.
Phase change: The phase change is almost insignificant, indicating almost zero fat content.
3.3.3. Whole milk
Uneven and relatively large. Whole milk contains a higher percentage of fat, so the fat globules are larger and more numerous, which also leads to larger phase changes in the holograms, especially in some of the higher raised areas.
Particle size: the particles are noticeably large and relatively unevenly distributed.
Phase variation: larger phase variations, especially in areas of dense particles, show higher fat content.
3.3.4. Comparison Summary
By comparison, it is clear that fat content has a significant effect on the size and distribution of particles in milk. Skimmed milk has the smallest and uniform particles due to its very low-fat content; low-fat milk has slightly larger particles, while whole milk has larger and non-uniform particles due to its high fat content.
Particle size: skimmed milk has the smallest and uniform particles, low-fat milk has relatively small particles, and whole milk has the largest and unevenly distributed particles.
Phase change: The phase change goes from skimmed milk (least change) to low-fat milk to whole milk (most change). This is consistent with the change in fat content, the higher the fat content and the larger the particle size, the more significant the phase change.
Based on the results of digital holographic microscopy, the differences in the particle structure of these milks with different fat contents are very obvious, and the size of the particles directly contributes to the different Tyndall phenomena.
References
[1]. Chou, L. T., & Lin, W. P. (2010). Understanding the Tyndall Effect in Colloidal Systems. Journal of Colloidal Science, 35(3), 245-252.
[2]. Smith, J. P., & Tanaka, H. (2012). Light Scattering and the Tyndall Effect: Applications in Colloidal Research. Physical Chemistry Journal, 47(2), 183-195.
[3]. Bohren, C. F., & Huffman, D. R. (1983). Absorption and Scattering of Light by Small Particles. wiley-VCH.
[4]. Hulst, H. C. van de (1957). Light Scattering by Small Particles. Dover Publications.
[5]. Mie, G. (1908). Beiträge zur Optik trüber Medien, speziell kolloidaler Metallösungen.Annalen der Physik, 330(3), 377-445.
[6]. Kerker, M. (1969). The Scattering of Light and Other Electromagnetic Radiation. Academic Press. ISBN: 978-0124045509.
[7]. Born, M., & Wolf, E. (1999). Principles of optics: Electromagnetic theory of propagation, interference and diffraction of light (7th ed.). Cambridge University Press.
[8]. Pawley, J. B. (Ed.). (2006). Handbook of biological confocal microscopy (3rd ed.). Springer.
[9]. Goldstein, J. I., Newbury, D. E., Joy, D. C., Lyman, C. E., Echlin, P., Lifshin, E., & Michael, J. R. (2003). Scanning electron microscopy and X-ray microanalysis (3rd ed.). Springer.
[10]. Murphy, D. B., & Davidson, M. W. (2012). Fundamentals of light microscopy and electronic imaging (2nd ed.). Wiley-Liss.
[11]. Javidi, B., Carnicer, A., & Chen, W. (2015). Digital holography and 3D imaging.Journal of Display Technology, 11(11), 889-890.
[12]. Kreis, T. (2005). Digital holographic interference-phase measurement using the Fourier- transform method. Journal of Optical Engineering, 41(8), 1829-1837.
[13]. Schnars, U., & Jüptner, W. (2005). Digital recording and numerical reconstruction of holograms. Measurement Science and Technology, 13(9), R85-R101.
[14]. Zhang, Y., & Yamaguchi, I. (1998). Three-dimensional microscopy with phase-shifting digital holography. Optics Letters, 23(15), 1221-1223.
[15]. Xu, W., Jericho, M. H., & Kreuzer, H. J. (2001). Digital in-line holography for biological applications. Proceedings of the National Academy of Sciences of the United States of America, 98(20), 11301 -11305.
[16]. Gerchberg, R. W., & Saxton, W. O. (1972). A practical algorithm for the determination of phase from image and diffraction plane pictures. Optik, 35(2), 237-246.
[17]. Fienup, J. R. (1982). Phase retrieval algorithms: a comparison. Applied Optics, 21(15), 2758- 2769.
[18]. Yang, G. Z., & Gu, B. Y. (1994). Phase retrieval using the hybrid input-output method and its application to image reconstruction. Optics Communications, 116(5), 343-348.
[19]. Mudanyali, O., Oztoprak, C., Tseng, D., Erlinger, A., & Ozcan, A. (2010). Compact, light-weight and cost-effective microscope based on lensless incoherent holography for telemedicine applications. lab on a Chip, 10(11), 1417-1428.
[20]. Greenbaum, A., Zhang, Y., Feizi, A., Chung, P. L., Luo, W., Kandukuri, S. R., & Ozcan, A. (2014). Wide-field computational imaging of pathology slides using lens-free on-chip microscopy. Science Translational Medicine, 6(267), 267ra17
Cite this article
Wang,S. (2025). The Shape of Light: Exploring Lensless Holographic Microscopy and the Tyndall Effect. Theoretical and Natural Science,86,163-176.
Data availability
The datasets used and/or analyzed during the current study will be available from the authors upon reasonable request.
Disclaimer/Publisher's Note
The statements, opinions and data contained in all publications are solely those of the individual author(s) and contributor(s) and not of EWA Publishing and/or the editor(s). EWA Publishing and/or the editor(s) disclaim responsibility for any injury to people or property resulting from any ideas, methods, instructions or products referred to in the content.
About volume
Volume title: Proceedings of the 4th International Conference on Computing Innovation and Applied Physics
© 2024 by the author(s). Licensee EWA Publishing, Oxford, UK. This article is an open access article distributed under the terms and
conditions of the Creative Commons Attribution (CC BY) license. Authors who
publish this series agree to the following terms:
1. Authors retain copyright and grant the series right of first publication with the work simultaneously licensed under a Creative Commons
Attribution License that allows others to share the work with an acknowledgment of the work's authorship and initial publication in this
series.
2. Authors are able to enter into separate, additional contractual arrangements for the non-exclusive distribution of the series's published
version of the work (e.g., post it to an institutional repository or publish it in a book), with an acknowledgment of its initial
publication in this series.
3. Authors are permitted and encouraged to post their work online (e.g., in institutional repositories or on their website) prior to and
during the submission process, as it can lead to productive exchanges, as well as earlier and greater citation of published work (See
Open access policy for details).
References
[1]. Chou, L. T., & Lin, W. P. (2010). Understanding the Tyndall Effect in Colloidal Systems. Journal of Colloidal Science, 35(3), 245-252.
[2]. Smith, J. P., & Tanaka, H. (2012). Light Scattering and the Tyndall Effect: Applications in Colloidal Research. Physical Chemistry Journal, 47(2), 183-195.
[3]. Bohren, C. F., & Huffman, D. R. (1983). Absorption and Scattering of Light by Small Particles. wiley-VCH.
[4]. Hulst, H. C. van de (1957). Light Scattering by Small Particles. Dover Publications.
[5]. Mie, G. (1908). Beiträge zur Optik trüber Medien, speziell kolloidaler Metallösungen.Annalen der Physik, 330(3), 377-445.
[6]. Kerker, M. (1969). The Scattering of Light and Other Electromagnetic Radiation. Academic Press. ISBN: 978-0124045509.
[7]. Born, M., & Wolf, E. (1999). Principles of optics: Electromagnetic theory of propagation, interference and diffraction of light (7th ed.). Cambridge University Press.
[8]. Pawley, J. B. (Ed.). (2006). Handbook of biological confocal microscopy (3rd ed.). Springer.
[9]. Goldstein, J. I., Newbury, D. E., Joy, D. C., Lyman, C. E., Echlin, P., Lifshin, E., & Michael, J. R. (2003). Scanning electron microscopy and X-ray microanalysis (3rd ed.). Springer.
[10]. Murphy, D. B., & Davidson, M. W. (2012). Fundamentals of light microscopy and electronic imaging (2nd ed.). Wiley-Liss.
[11]. Javidi, B., Carnicer, A., & Chen, W. (2015). Digital holography and 3D imaging.Journal of Display Technology, 11(11), 889-890.
[12]. Kreis, T. (2005). Digital holographic interference-phase measurement using the Fourier- transform method. Journal of Optical Engineering, 41(8), 1829-1837.
[13]. Schnars, U., & Jüptner, W. (2005). Digital recording and numerical reconstruction of holograms. Measurement Science and Technology, 13(9), R85-R101.
[14]. Zhang, Y., & Yamaguchi, I. (1998). Three-dimensional microscopy with phase-shifting digital holography. Optics Letters, 23(15), 1221-1223.
[15]. Xu, W., Jericho, M. H., & Kreuzer, H. J. (2001). Digital in-line holography for biological applications. Proceedings of the National Academy of Sciences of the United States of America, 98(20), 11301 -11305.
[16]. Gerchberg, R. W., & Saxton, W. O. (1972). A practical algorithm for the determination of phase from image and diffraction plane pictures. Optik, 35(2), 237-246.
[17]. Fienup, J. R. (1982). Phase retrieval algorithms: a comparison. Applied Optics, 21(15), 2758- 2769.
[18]. Yang, G. Z., & Gu, B. Y. (1994). Phase retrieval using the hybrid input-output method and its application to image reconstruction. Optics Communications, 116(5), 343-348.
[19]. Mudanyali, O., Oztoprak, C., Tseng, D., Erlinger, A., & Ozcan, A. (2010). Compact, light-weight and cost-effective microscope based on lensless incoherent holography for telemedicine applications. lab on a Chip, 10(11), 1417-1428.
[20]. Greenbaum, A., Zhang, Y., Feizi, A., Chung, P. L., Luo, W., Kandukuri, S. R., & Ozcan, A. (2014). Wide-field computational imaging of pathology slides using lens-free on-chip microscopy. Science Translational Medicine, 6(267), 267ra17