


1. Introduction
With the rapid development of economy and society, tourism has become one of the fastest growing industries in the world, especially in China, it is not only an important driving force for economic growth, but also an important symbol of the improvement of people’s living standard, and it has become a hotspot for people’s entertainment consumption. In the post epidemic era, China’s tourism consumer market is recovering rapidly. Meanwhile, with the improvement of people’s living standards and the rapid development of the tourism market, tourists’ demand for personalised and customised tourism is also expanding rapidly [1].
Beijing, as the political, cultural and international communication centre of China, has a rich historical heritage and a dense concentration of places of interest, making it a preferred destination for both domestic and foreign tourists. However, the huge volume of visitors has also brought challenges to Beijing’s tourism market, especially during peak periods, when crowding at major attractions seriously affects the quality of visitors’ experience. The sequence and routes for visitors to experience the attractions have also become key to enhancing the visitor experience and easing the pressure on traffic transfers. Therefore, how to effectively manage and allocate tourism resources, and help tourists plan the tourism path with the shortest commute and the best experience has become an urgent issue.
In this context, the importance of the research on personalised recommendation algorithms for travel routes is particularly prominent. In the era of big data, the information about tourist attractions, hotels, restaurants and other locations is unprecedentedly huge, only on the Ctrip website, the number of tourist attractions under the keyword search of “Beijing” reaches more than 3,000, which generates a huge number of tourist route combinations and point-of-interest (POI) evaluations, and poses a great challenge to the information collection and collation ability of individual users.
This study crawls representative locations through Ctrip, Tongcheng, and Qunar websites, classified into three major categories: attractions, hotels, and restaurants, and uses natural language processing techniques to analyse the evaluations of the corresponding locations in the web reviews. Based on the Technique for Order Preference by Similarity to an Ideal Solution method(TOPSIS), candidate objects are selected based on user interests. A greedy algorithm is introduced for path planning and solution comparison by constructing basic assumptions and constraints. Users can get the best route planning for travelling in one-stop by simply inputting their interest categories.
2. Literiture Review
In terms of the intelligence of travel recommendation algorithms, the personalised travel recommendation problem stems from the travel itinerary design problem (TTDP), and the implementation of a personalised travel itinerary design algorithm using artificial intelligence and meta-heuristics on mobile devices by Wouter Souffriau et al [2] marks the beginning of the personalised travel recommendation system’s progress towards automation and intelligence. Y. Bachrach et al [3] introduces machine learning into personalised travel recommendation, through crowdsourcing workers manually annotated to obtain user interest information and attraction evaluation information to train linear regression models, based on tourists’ personalised features to recommend travel paths. Khalid AL Fararni et al [4] focus on the “noise” problem of excessive evaluation information and proposed a travel recommendation system architecture based on hybrid recommendation methods, laying a theoretical foundation for the use of big data, artificial intelligence and other methods to achieve intelligent personalised recommendation. Xiang Nan et al [5] also pay attention to the overload problem caused by tourism big data and proposed to control the data processing overhead based on data mining, using collaborative filtering algorithms to calculate the similarity between users and matching to recommend attractions visited by people with higher similarity.
In recent years, some scholars have tried to use hybrid recommendation models to enhance the accuracy and effectiveness of personalised travel recommendations. Jongsoo Lee et al [6] propose aspect personalisation for the first time, and construct a score to recommend travel paths from the diversity, distance and popularity of travel destinations in an integrated way, which significantly improve the precision and recall of the model, and verify the significant facilitation of the combination of multiple metrics for recommendation. Hala M. Alshamlan et al [7] propose a weighted parallel hybrid recommender system considering the difference in weights between different aspects with a classification accuracy of 80%.
In addition, Kevin Jasberg et al [8] study reacted to the existence of inconsistency in user behaviour and user feedback, which generally stems from the volatility of human decision-making. This propagation of uncertainty can lead to errors in algorithmic ranking. Kevin Jasberg et al. in another study [9] propose the use of a probabilistic framework to weigh this inconsistency and show that this form takes into account the potential benefits of inconsistency and performs better than filtering alone.
3. Data Sources and Pre-prepration
3.1. Data Sources
In this study, python based crawling technique is used to collect relevant public data from internet travel platforms such as Ctrip, Tongcheng, and Qunar. The raw dataset of names, categories, ratings and user reviews of three major categories of attractions, hotels and restaurants is constructed.
Among them, for the attraction dataset, this paper selects more than 200 representative places in Beijing to constitute the original dataset. Table 1 below gives an example of some of the data.
Table 1: Attractions Dataset Example.
Attractions | Open Time | Reviews | Score |
798ArtDist | open all day | Beijing's 798 Art District is...a great place to be! | 4.6 |
798ArtDist | open all day | 798, A Second Spring in a Dilapidated Factory...A Day of Rejoicing | 5 |
798ArtDist | open all day | 798 Art District is really big...the environment is better than before! | 4.6 |
798ArtDist | open all day | I've been there many times, it's not bad, I recommend it! | 4.6 |
For catering, nearly 500 well-known restaurants in Beijing are selected, taking into account various cuisines and tastes. Table 2 below gives an example of some of the data
Table 2: Restaurants Dataset Example.
Restaurants | Price | Taste Rating | Environment Rating | Service Rating | Number of Comments | Cuisine |
Zi Guang Yuan | 74 | 9.1 | 9.0 | 9.1 | 1213 | Beijing food |
Old Beijing Home Cooking | 30 | 7.0 | 7.0 | 7.1 | 18 | Beijing food |
Lao Hu Ji | 99 | 9 | 8.2 | 8.1 | 806 | Beijing food |
Hundred Flowers Home | 100 | 8.5 | 8.6 | 8.3 | 11848 | Beijing food |
For hotel, nearly 400 hotels in Beijing are selected to form the original dataset. Table 3 below gives an example of some of the data
Table 3: Hotels Dataset Example.
Hotels | Total Rating | Number of Comments | Reviews | Star Rating | Price |
7 Days Hotel | 4.8 | 1136 | The room was ok...overall it was pretty good! | 5 | 239 |
7 Days Hotel | 4.8 | 1136 | Close to the metro station...but the room was clean and new! | 5 | 239 |
7 Days Hotel | 4.8 | 1136 | Super happy with the shop next time...come on! | 5 | 239 |
7 Days Hotel | 4.8 | 1136 | The hotel was very nice...a rare find! | 5 | 239 |
3.2. Data Pre-prepration
A large amount of user comment text data exists in the original scenic spots and hotels dataset, in order to solve the problems of data redundancy and poor usability, this paper merges the user comments and location annotation processing on the original data. The paper uses the word cloud map, geographic information system (GIS) and other technologies to present the data in a visual way.
Data Cleaning. The attractions and hotels dataset are cleaned. The paper removes locations with less than 100 total reviews to ensure that the selected locations have a certain degree of activity. Remove more than 40,000 data with duplicate user comments to prevent the phenomenon of brushing comments and ensure the reliability of the data. Remove the data in which the comments are null values to ensure the validity and usability of the data.
User comment merging. The paper groups user comments based on attraction names, merge the text of user comments of the same group, and replaces the original user comment attribute column with the merged comment text, which greatly reduces data redundancy.
Longitude and latitude labelling. To facilitate travel route optimisation, this paper adds longitude and latitude attribute columns to the dataset to describe its geographic location based on the GaodeMap API. Figure 1 below shows the visualisation of the coordinates of all locations.
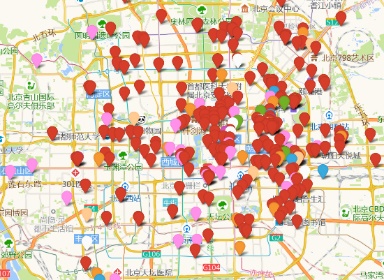
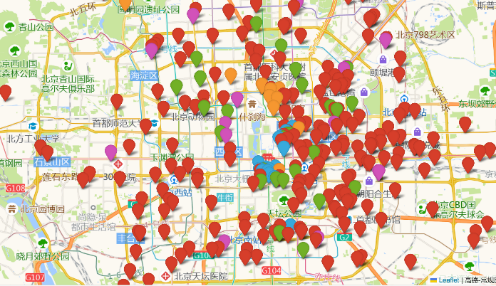
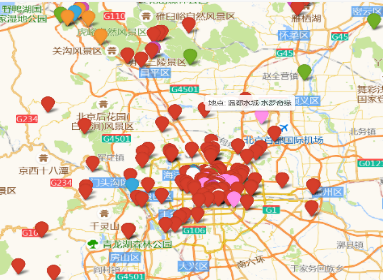
Figure 1: Beijing Attractions, Hotels, Restaurants.
4. Modelling Study and Building Process
4.1. Description of Topic Distribution Based on Latent Dirichlet Distribution
4.1.1. Description of the Topic Distribution
To facilitate the selection of POIs such as attractions and hotels based on personalised metrics, this study uses the LDA model to analyse the topic distribution of 218 attractions and 396 hotels in the dataset. The key topics are extracted as feature identifiers of POIs based on topic distribution.
Comment-Topic prior. The topic distribution \( {θ_{c}} \) is first extracted and initialised using the Delicacy distribution as the prior distribution. Set the topic distribution \( {θ_{c}} \) for each comment \( c \) to be drawn from the Delicacy distribution \( Dir(α) \) .
Topic-Word Prior. Continuing to use the Delicacy distribution as the prior distribution, words are extracted and matched for topics, with words topic labelled as \( {Z_{cw}} \) . The word distribution \( {β_{k}} \) for each topic \( k \) is the one drawn from the Delicacy distribution \( Dir(η) \) .
Construct the likelihood function. After initialisation by the Dirichlet distribution, the likelihood function for a given set of reviews \( C \) is the probability of occurrence of words in all reviews. For the words \( w \) in the comments \( c \) , the probability can be expressed as:
\( P(w|c,α,η)=\sum _{z=1}^{K}P(w∣z,β)*P(z∣{θ_{c}}) \) (1)
Where \( P(w∣z,β) \) is the probability of selecting a word \( w \) from the distribution of words in a topic \( z \) and the probability of \( P(z∣{θ_{c}}) \) selecting a topic \( z \) from the distribution of topics in a comment \( c \) .
Gibbs sampling. For each word \( w \) in each comment \( c \) , iteratively reassign the topic label of each word to make the likelihood function increase for the entire set of comments until convergence. Randomly select a word \( w \) and its position in the comment \( c \) . Record the current topic label \( z \) of the word \( w \) and then remove the word from the comment \( c \) , using as a probability \( P({z_{cw}}=k∣others) \) , a new topic \( {z_{cw}} \) randomly sampled as the topic label of the word \( w \) , updating the comment's topic count and the global topic count. Based on the current distribution \( {θ_{c}} \) of comment topics and the global word distribution under each topic, the probability of the word \( w \) being assigned to each possible topic k is calculated. This probability is given by the following equation:
\( P({z_{cw}}=k∣others)∝{θ_{ck}}*\frac{{n_{wk}}+η}{{n_{c}}+ηK} \) (2)
Estimating topic distribution. After convergence of the likelihood function, the topic distribution for each document can be estimated by calculating the number of words assigned to each topic in the document as a proportion of the total number of words in the document:
\( {θ_{ck}}=\frac{{n_{wk}}}{{n_{c}}} \) (3)
4.1.2. Number of Category Evaluations
To select the optimal number of subject distributions, the LDA model is evaluated using perplexity and coherence score.
Perplexity is an indicator that characterises the extent to which the model is confused about the differences between topics. Coherence score is another indicator used to assess the consistency of topics. In determining the number of topics, this paper considers both the perplexity and coherence score and chooses a balance point within a practically acceptable range.
Obtain LDA model perplexity metrics by calculating cross entropy and plot perplexity curves. Calculate the coherence score through the log-likelihood of the LDA model and plot the curve.
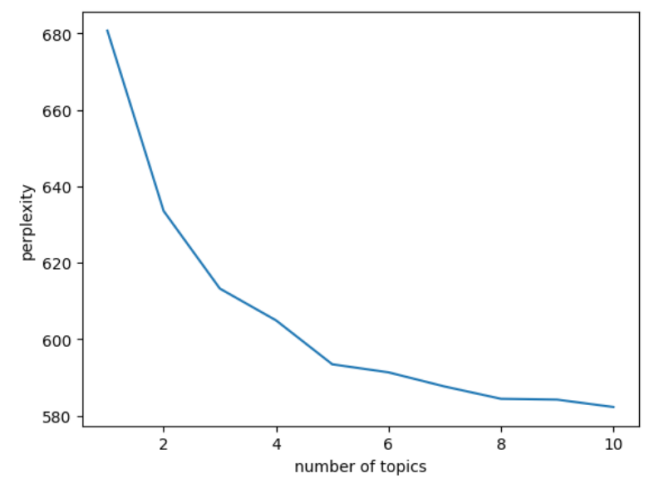
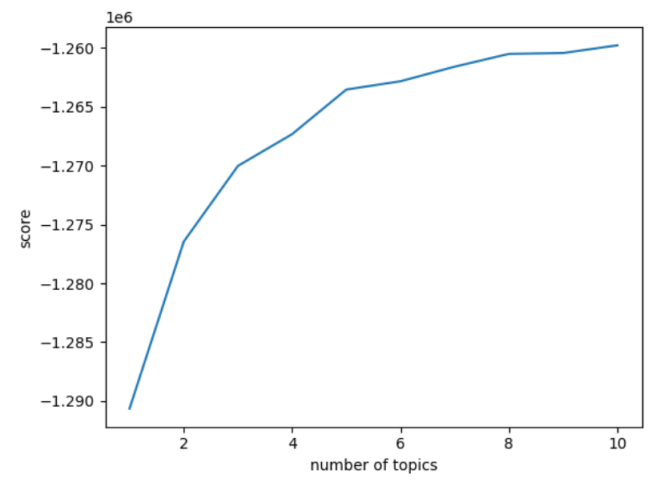
Figure 2: Hotel Perplexity and Coherence Score.
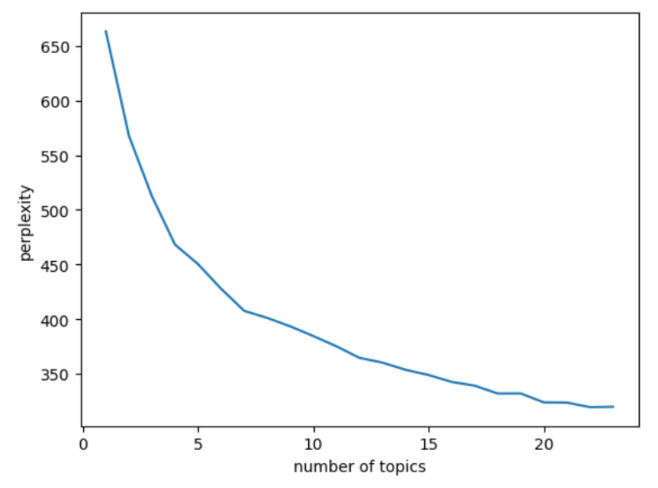
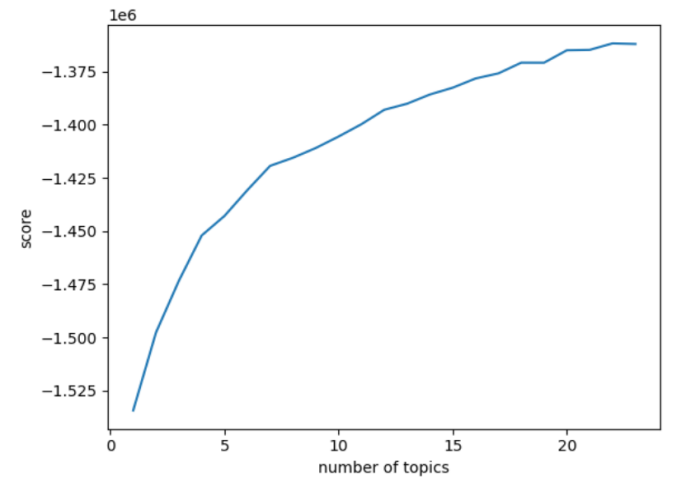
Figure 3: Attractions Perplexity and Coherence Score.
Figures 2 to 3 below depict the curves of attractions and hotels perplexity and coherence score with respect to the number of topics, with the horizontal coordinate indicating the number of categories and the vertical coordinate indicating the perplexity or coherence score. The smaller the perplexity, the better the clustering is likely to be; the larger the coherence score, the better the clustering is indicated.
Figure 3 above shows that there is a small upward mutation in the coherence score of the attractions graph at the number of topics 19 to 21. In Figure 3, when the number of topics is from 19 to 21, there is a sudden change in the change of perplexity of the attraction graph and the coherence score is close to the lowest value, while the lowest place may be a serious overclassification phenomenon, so for the attractions in this paper, 21 topics are selected to describe the content of the review.
For hotels, this paper uses the same analysis method as above. So, for hotels this paper selects 8 topics to describe the review content is more effective.
Based on the topic distribution, 218 attractions are divided into 20 categories and 396 hotels are divided into 8 categories.
Meanwhile, assuming that users’ personalised demand for catering is based on cuisine style, this study classifies catering based on cuisine indicators.
Based on the above classification results, the dataset is modified. The paper adds the “theme” attribute column in the attractions and hotels dataset, and take the points with the largest probability value in the vector \( {θ_{ck}} \) as the category labels, and fills in the “topic” attribute column as the factor to evaluate the user’s interest.
4.2. Sentiment Analysis of Reviews Based on Naive Bayes Model
Using this algorithm to analyse the review data of attractions and hotels for sentiment propensity, a sentiment threshold of 0.5 is set, then if \( P(em∣c) \gt 0.5 \) , it is considered as a positive review and if \( P(em∣c) \lt 0.5 \) , it is considered as a negative review. The value of \( P(em∣c) \) measures the degree of positivity of the comment, the user’s perception of the attraction and hotel actual experience. The “user experience score” of the actual experience of the attraction or hotel is measured by the positive degree of the comments.
At the same time, the star rating index used in the original data above is actually a “user behaviour score” that is derived from the user’s feedback actions weighed against the influence of various factors. In this study, a collaborative recommendation method based on a probabilistic framework is used to form the “attractions and hotels evaluation score”, which is a measure of users’ actual emotions, by considering the two indicators together.
In order to solve the problem of inconsistency between the text of user comments and the scores of user platforms, this paper adds a “user experience” attribute column to the dataset. The dual metrics of user experience and user platform scores are assigned different weights to measure the actual service level, which effectively improves the systematic bias of evaluation such as ranking error.
Considering the actual problem, the maximum combined score value of user experience score and user behaviour score is specified to be 100. Define the attraction evaluation score and hotel evaluation score as follows:
Total rating (attractions) = 10*user behaviour score (attractions) + 50*user experience score (attractions)
Total rating (hotels) = 5*average rating (hotels) + 5*user behaviour score (hotels) + 50*user experience score (hotels)
Among them, the user behaviour score, total score, and user behaviour score take the value range of 0-5, the user experience score, and user experience score take the value range of 0-1, and the evaluation score take the value range of 0-100. The total score is used as one of the important bases for the ranking of attractions and hotels in the following TOPSIS method.
4.3. Ranking Based on the Technique for Order Preference by Similarity to an Ideal Solution Method
4.3.1. Entropy Weighting
In order to distinguish the actual quality of attractions and hotels, the entropy weight method is used to determine the weights of indicators.
In this study, objective weights are derived by using subjective weights entered by the user and processed by the entropy weight method. The entropy weight method is based on the principle of information entropy and can objectively reflect the importance of each attribute.
Calculate and normalise the entropy \( {E_{j}} \) of attribute j and then calculate the objective weights \( {W_{j}} \) ;
\( E_{j}^{ \prime }=\frac{{E_{max}}-{E_{j}}}{{E_{max}}} \) (4)
\( {W_{j}}=\frac{1-E_{j}^{ \prime }}{m-\sum _{j=1}^{m}E_{j}^{ \prime }} \) (5)
Finally, the objective weights are combined with the subjective weights \( {ω_{j}} \) given by the users to get the final weights \( {λ_{j}} \) .
\( {λ_{j}}=\frac{{W_{j}}{ω_{j}}}{\sum _{j=1}^{m}{W_{j}}{ω_{j}}} \) (6)
4.3.2. Ordered List of Pros and Cons
Using normalisation of the data, the distance of each alternative from the ideal solution is calculated and the closeness is calculated based on the distance. The closeness \( {C_{i}} \) is the ratio of the distance of an alternative to the optimal ideal solution to the sum of the distances of that alternative to the optimal and worst ideal solutions. The higher the closeness, the more similar the alternative is to the ideal solution and the higher the ranking [10].
\( D_{i}^{+}=\sqrt[]{\sum _{j=1}^{n}{({λ_{j}}y_{ij}^{ \prime }-{λ_{j}}y_{ideal}^{j})^{2}}} \) (7)
\( D_{i}^{-}=\sqrt[]{\sum _{j=1}^{n}{({λ_{j}}y_{ij}^{ \prime }-{λ_{j}}y_{ideal}^{j})^{2}}} \) (8)
\( {C_{i}}=\frac{D_{i}^{+-}}{D_{i}^{+}+D_{i}^{-}} \) (9)
Based on the calculated closeness \( {C_{i}} \) , all alternatives are ranked and the one with the highest closeness is selected as the optimal recommendation. Based on the closeness, the evaluation \( {F_{i}} \) is calculated, the larger the value is, the closer the alternatives are to the ideal solution, and the higher the ranking is:
\( {F_{i}}=k(1-\sum _{i=1}^{m}{λ_{j}}(d_{j}^{*}-{d_{ij}})+{C_{i}}) \) (10)
4.3.3. Evaluation of Output Indicators
This study includes probability, total score for attractions, price, total score, hotel price, taste score, service score, environment score, number of reviews indicator for restaurants and the classification of attractions, hotels based on LDA and restaurants based on cuisine, and the TOPSIS algorithm was performed in each category and found that the value of the F-rating of the attractions increased with the total score of the attractions and the topic experience increases. Table 4 shows some of the results.
Table 4: TOPSIS Evaluation Indicator Results.
Topic | Attractions | Probability | Total Score | Longitude | Latitude | Relative Proximity | F-value |
0 | Chinese National Museum | 0.357184 | 87.6884 | 39.9853 | 116.3911 | 0.162393 | 1.148974 |
0 | Seventeen Hole Bridge | 0.412224 | 92.50561 | 39.9907 | 116.2775 | 0.271136 | 1.260064 |
0 | Fortune Underwater World | 0.298884 | 89.16384 | 39.92859 | 116.4472 | 0.132804 | 1.1181 |
0 | De Yun She Comedy Convention | 0.67058 | 77.89098 | 39.94434 | 116.3733 | 0.663062 | 1.656206 |
4.4. Travel Path Planning Based on Greedy Algorithm
4.4.1. Assumptions and Constraints
This study takes general tourists travelling to Beijing as the research object. Through more than 100 questionnaire surveys and four interviews with tourists, the paper summarised three basic assumptions and eight constraints of the planning model.
Tourist habits are assumed to be consistent with the following basic assumptions:
The model assumes that tourists visit only two attractions in a day
The model assumes a uniform mode and speed of transport for tourists.
The model assumes good weather at all times of the tour
This study sets eight constraints:
Limit on the total number of attractions to be visited
Distance limitation between hotels and attractions
Choice of attractions to visit each day
Tour days limit
Daily restaurant collection restrictions
Limit on the number of restaurants per day
Attraction Review Value Limit
Hotel Selection Restrictions
4.4.2. Personalised Path Optimisation
In this study, a new solution is proposed based on the greedy algorithm, which is improved by combining the tourism path planning problem. The model not only considers the distance between attractions, but also integrates the selection of hotels and restaurants to maximise the tourist experience.
Generating candidate sets. This study synthesises the evaluation index system constructed by the previous studies, and selects attractions and hotels that meet the classification topic, as well as all hotels to generate the attraction set, the hotel set and the hotel set. It constitutes the basic candidate set for path planning. The selection of the attraction collection that can be visited within the time-permissible range is filtered against the hotel collection, and the top 10 rated hotels are retained, which further limits the scope of the candidate set.
Path Planning. Path planning is the core part of the model. Initialised path setting based on greedy algorithm marks all attractions as unvisited. The highest rated hotel from the candidate set is selected as the starting point. For each day’s itinerary iterate and select the attraction with the closest distance to the current attraction (or hotel) as the next attraction from the unvisited attractions. Mark the status of the selected attraction as visited and use it as the current attraction for the next iteration. Ends the iteration when all attractions have been visited or when no more attractions can be visited within the same day’s time.
5. Model Use and Case Testing
5.1. Case Description
Based on the integration of the above four algorithms, this paper achieves the personalised travel customisation for tourists, and the following is an actual system experiment.
The tourist in this case is called Xiao Zhang (a pseudonym). Xiao Zhang wishes to experience a personalised three-day tour in Beijing. Xiao Zhang has never been to Beijing before, he wishes to visit some of the city’s attractions, especially the opulent imperial palaces, as well as some of the hotspots, and at the same time, he also wishes to taste Beijing’s special dishes.
5.2. Model Inputs
In the model input section, Xiao Zhang made inputs for the following sixteen metrics. Xiao Zhang’s inputs are shown in table 5:
Table 5: Case Input.
Questions | Input |
attraction’s topic experience | 3 |
other users comments about attraction | 7 |
hotel’s topic experience | 2 |
hotel price | 6 |
other users comments about hotel | 2 |
hotel price tendency | cheap |
restaurant price | 5 |
restaurant taste | 2 |
restaurant environment | 1 |
restaurant service | 1 |
restaurant popularity | 1 |
restaurant price tendency | cheap |
travel days | 3 days |
select attraction topic | 2,6,8,11 |
select hotel topic | 4,8 |
cuisine | Beijing |
As can be seen from Xiao Zhang’s input, a higher weight will be set on the option of user rating of attractions since Xiao Zhang favours hotspots. Since Xiao Zhang’s price weights on the hotel and restaurant inputs are very high, and at the same time, he takes a bias towards underweighting the price factors of hotels and restaurants, it will eventually cause the model to match him with hotels and restaurants that are more cost-effective. Zhang chooses 2, 6, 8 and 11 for the attraction topics, which correspond to the topics of Animal Interaction, Historical Royalty, Fun and Excitement, and Shopping and Fashion. For the hotel topic, he chose 4 and 8, which correspond to the topics of intimate experience and affordable convenience.
5.3. Model results
The final model gives a recommendation strategy:
Day 1 Itinerary is shown in Figure 4.
Meicheng Qingju Hotel (Wangfujing Xiehe Hospital) -> Wangfujing -> Guoji - Beijing Cuisine (Wangfujing) -> Jiaolou -> Quanfude Roast Duck Restaurant (Forbidden City Branch)-> Meicheng Qingju Hotel (Wangfujing Xiehe Hospital)
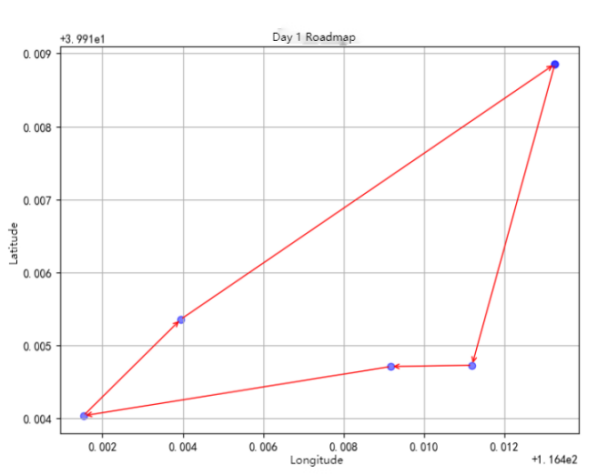
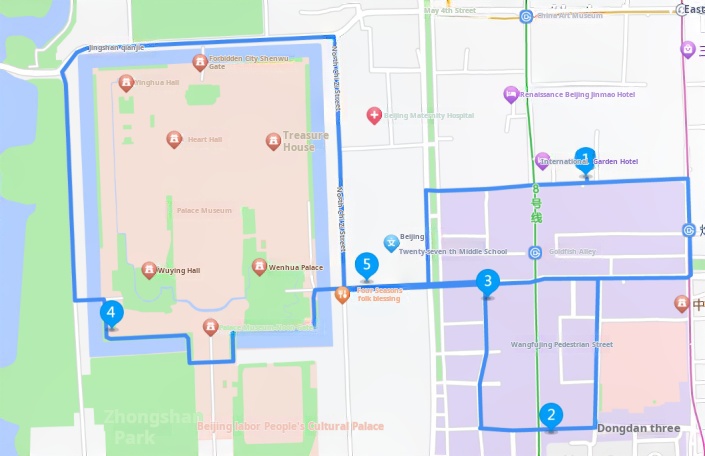
Figure 4: Day 1 Itinerary.
Day 2 Itinerary is shown in Figure 5.
Meicheng Qingju Hotel (Wangfujing Xiehe Hospital) -> Qianqing Palace -> Tanjia Cuisine (East Chang'an Street) -> Hall of Supreme Harmony -> Beijing Hotel -> Meicheng Qingju Hotel (Wangfujing Xiehe Hospital)
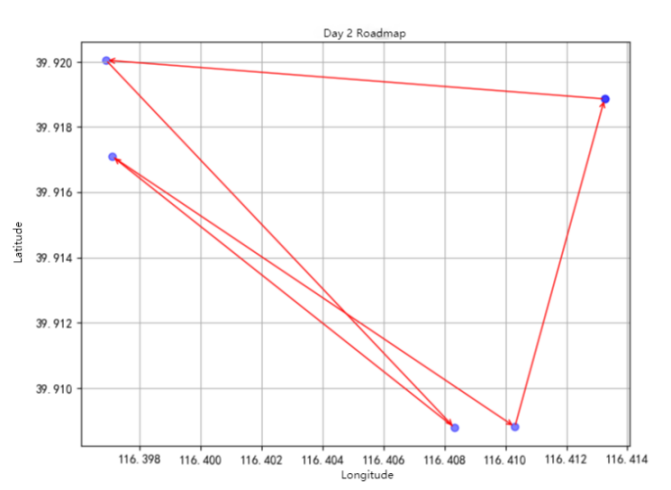
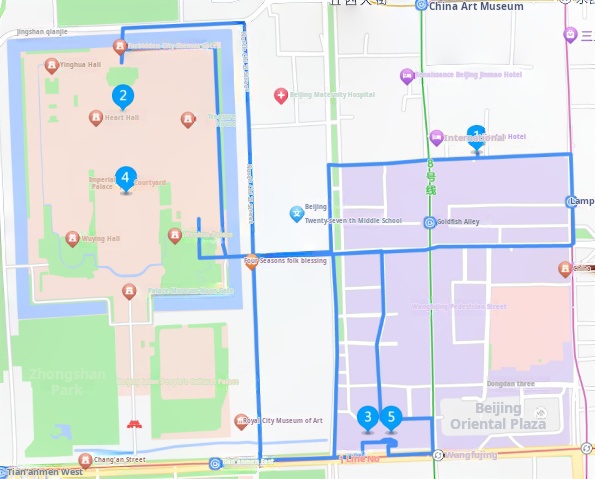
Figure 5: Day 2 Itinerary.
Day 3 Itinerary is shown in Figure 6.
Meicheng Qingju Hotel (Wangfujing Xiehe Hospital) -> Water Cube (National Aquatics Centre) -> Koi Carp (North Star) -> Bird's Nest (National Stadium) -> Gong Xi - Roast Duck Restaurant (Anzhen Puppet Theatre) -> Meicheng Qingju Hotel (Wangfujing Xiehe Hospital)
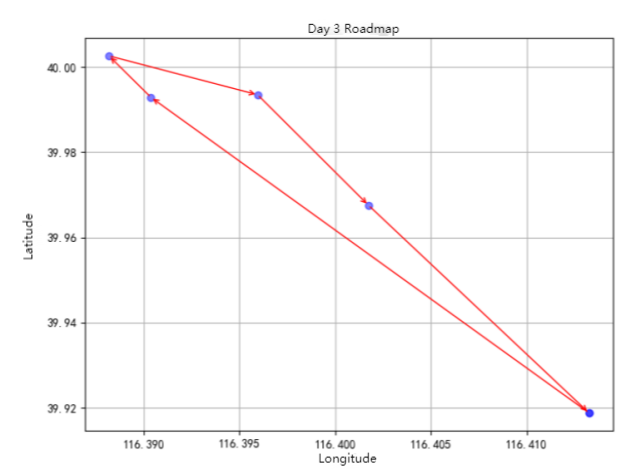
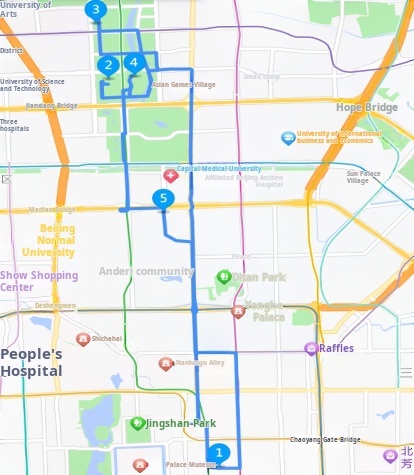
Figure 6: Day 3 Itinerary.
In this itinerary recommendation, the results recommended by the model show a high degree of consistency with the topics and weights entered by Xiao Zhang, recommending as much as possible for Xiao Zhang to visit the palace buildings, commercial centres and hotspots. At the same time, the recommended hotels and restaurants are also very high price, reducing Zhang’s expenses during the trip.
5.4. Testing and Evaluation of Results
5.4.1. Vertical Analysis
From the above cases, this paper analyses and evaluates the model, from which it can be obtained that the recommendation of the model is very effective in the urban area, and shows very high user satisfaction and high consistency with the user’s interest in the recommendation of attractions, hotels, restaurants and paths. However, the recommendation model in the suburb section shows inconsistency with the actual location, as well as missing data including hotels and restaurants in the suburb section, which leads to a larger total distance being recommended in the end, reducing user satisfaction.
In this paper, subjects are recruited, and in the form of a case study, personalised travel itineraries are recommended for the subjects based on their specific circumstances and needs, and their satisfaction and perceptions of the recommended itineraries are ascertained through interviews with the subjects. The results show that subjects are highly satisfied with the recommended routes and sequences, which are perceived as fulfilling the requirements of personalisation in line with interest and time cost of closest proximity.
5.4.2. Issues and improvements
However, the tests also identify issues such as the model’s poor performance for individual places that are geographically far from place clusters, and its insensitivity to changes in the measurement factors.
6. Conclusions
In summary, this study focuses on the Beijing cultural tourism market and establishes a travel recommendation model based on natural language processing and multifaceted personalisation, which provides users with an efficient and personalised travel planning solution by comprehensively considering factors such as attraction selection, hotel recommendation, restaurant selection and path shortening. This study also tests the model’s recommendation effect, and recommendation load. The test results show high satisfaction with the model’s recommended effects, no logic errors under load tests, and rapid response and run times. Overall, the model has a good performance and fills the gap in the field of tourism recommendation models in the field of tourism path models based on user interest personalised direct matching of recommended attractions and supporting facilities.
Meanwhile, based on the problems identify in the test, future research will further explore how to integrate real-time traffic information, user feedback, and multi-day route planning into the model to improve its usefulness and adaptability.
References
[1]. Zhong, Y. Q., Liu, Z. (2019). Research on Personalised Tourism Services Based on Consumer Demand. Modern Business Trade Industry, 40(25):14-15.
[2]. Wouter, S., Vansteenwegen, P. et al. (2008). A PERSONALIZED TOURIST TRIP DESIGN ALGORITHM FOR MOBILE TOURIST GUIDES. Applied Artificial Intelligence, 964 - 985.
[3]. Bachrach Y., Ceppi S. et al. (2014). Building a personalized tourist attraction recommender system using crowdsourcing. Adaptive Agents and Multi-Agent Systems.
[4]. Khalid, A. F., Fouad, N. et al. (2021). Hybrid recommender system for tourism based on big data and AI: A conceptual framework. Big Data Mining and Analytics, 47-55.
[5]. Xiang, N., Kayo, K. et al. (2022). Design and Implementation of a Personalized Tourism Recommendation System Based on the Data Mining and Collaborative Filtering Algorithm. Computational Intelligence and Neuroscience.
[6]. Jongsoo, L., Jung, A. S. et al. (2022). Personalized Tour Recommendation via Analyzing User Tastes for Travel Distance, Diversity and Popularity. Electronics.
[7]. Hala, M. A., Ghala, A. et al. (2023). Promoting Sustainable Travel Experiences: A Weighted Parallel Hybrid Approach for Personalized Tourism Recommendations and Enhanced User Satisfaction. Sustainability.
[8]. Kevin, J., Sergej, S. (2018). Human uncertainty and ranking error: fallacies in metric-based evaluation of recommender systems. In: Proceedings of the 33rd Annual ACM Symposium on Applied Computing.
[9]. Kevin, J., Sergej, S. (2018). Dealing with Uncertainties in User Feedback: Strategies Between Denying and Accepting. arXiv abs/1802.05895.
[10]. Chen, L., Wang, Z. Y. (2003). Research on TOPSIS integrated evaluation and decision method based on entropy coefficient. Control and Decision (04): 456-459.
Cite this article
Qin,J. (2025). Research on One-stop Intelligent Tourism Planning Based on User Interests -- A Case Study of Beijing. Theoretical and Natural Science,101,1-13.
Data availability
The datasets used and/or analyzed during the current study will be available from the authors upon reasonable request.
Disclaimer/Publisher's Note
The statements, opinions and data contained in all publications are solely those of the individual author(s) and contributor(s) and not of EWA Publishing and/or the editor(s). EWA Publishing and/or the editor(s) disclaim responsibility for any injury to people or property resulting from any ideas, methods, instructions or products referred to in the content.
About volume
Volume title: Proceedings of CONF-MPCS 2025 Symposium: Mastering Optimization: Strategies for Maximum Efficiency
© 2024 by the author(s). Licensee EWA Publishing, Oxford, UK. This article is an open access article distributed under the terms and
conditions of the Creative Commons Attribution (CC BY) license. Authors who
publish this series agree to the following terms:
1. Authors retain copyright and grant the series right of first publication with the work simultaneously licensed under a Creative Commons
Attribution License that allows others to share the work with an acknowledgment of the work's authorship and initial publication in this
series.
2. Authors are able to enter into separate, additional contractual arrangements for the non-exclusive distribution of the series's published
version of the work (e.g., post it to an institutional repository or publish it in a book), with an acknowledgment of its initial
publication in this series.
3. Authors are permitted and encouraged to post their work online (e.g., in institutional repositories or on their website) prior to and
during the submission process, as it can lead to productive exchanges, as well as earlier and greater citation of published work (See
Open access policy for details).
References
[1]. Zhong, Y. Q., Liu, Z. (2019). Research on Personalised Tourism Services Based on Consumer Demand. Modern Business Trade Industry, 40(25):14-15.
[2]. Wouter, S., Vansteenwegen, P. et al. (2008). A PERSONALIZED TOURIST TRIP DESIGN ALGORITHM FOR MOBILE TOURIST GUIDES. Applied Artificial Intelligence, 964 - 985.
[3]. Bachrach Y., Ceppi S. et al. (2014). Building a personalized tourist attraction recommender system using crowdsourcing. Adaptive Agents and Multi-Agent Systems.
[4]. Khalid, A. F., Fouad, N. et al. (2021). Hybrid recommender system for tourism based on big data and AI: A conceptual framework. Big Data Mining and Analytics, 47-55.
[5]. Xiang, N., Kayo, K. et al. (2022). Design and Implementation of a Personalized Tourism Recommendation System Based on the Data Mining and Collaborative Filtering Algorithm. Computational Intelligence and Neuroscience.
[6]. Jongsoo, L., Jung, A. S. et al. (2022). Personalized Tour Recommendation via Analyzing User Tastes for Travel Distance, Diversity and Popularity. Electronics.
[7]. Hala, M. A., Ghala, A. et al. (2023). Promoting Sustainable Travel Experiences: A Weighted Parallel Hybrid Approach for Personalized Tourism Recommendations and Enhanced User Satisfaction. Sustainability.
[8]. Kevin, J., Sergej, S. (2018). Human uncertainty and ranking error: fallacies in metric-based evaluation of recommender systems. In: Proceedings of the 33rd Annual ACM Symposium on Applied Computing.
[9]. Kevin, J., Sergej, S. (2018). Dealing with Uncertainties in User Feedback: Strategies Between Denying and Accepting. arXiv abs/1802.05895.
[10]. Chen, L., Wang, Z. Y. (2003). Research on TOPSIS integrated evaluation and decision method based on entropy coefficient. Control and Decision (04): 456-459.