


1. Introduction
Sleep is a fundamental component of adolescents' health, significantly influencing cognitive functions, emotional regulation, and overall well-being. The National Sleep Foundation recommends that teenagers aged 14–17 years obtain 8 to 10 hours of sleep per night [1]. However, studies indicate that many high school students fail to meet these guidelines. For instance, a study found that 79.7% of adolescents reported a total sleep duration of less than 8 hours[2].
The relationship between sleep duration and academic performance has been extensively studied, with mixed findings. Some research suggests that insufficient sleep negatively impacts academic outcomes. For example, Gruber et al. found that short sleep duration is associated with poor performance on IQ measures in healthy school-age children[3]. Similarly, a study conducted among high school students in Hong Kong reported that mathematics performance was positively correlated with sleep duration [4]. Conversely, other studies have found no significant correlation between sleep hours and academic performance. Garcia et al. reported no significant relationship between sleep hours and academic performance or classroom participation among senior high school students[5].
This study aims to investigate the sleep patterns of 10th and 11th-grade students in public schools and international schools and their potential impact on academic performance. By employing a two-sample z-test for population proportions, the study assesses whether a significant number of students sleep less than six hours per night. Additionally, it explores the correlation between sleep duration and academic outcomes to contribute to the ongoing discourse on sleep and student performance.
2. Information Background
2.1. Background
In today's fast-paced society, sleep deprivation among students is a growing concern, particularly affecting those in international and public schools. Middle school students, facing rigorous academic demands and extracurricular activities, often sacrifice sleep to meet expectations. International schools, with their diverse curricula and emphasis on global standards, may require students to balance time zones and extensive homework. Meanwhile, public schools, adhering to national education standards, also push students to excel in competitive environments. The pressure to perform, coupled with early school start times and heavy workloads, results in inadequate sleep, impacting students' health and academic performance. Addressing this issue is crucial for fostering a healthier, more balanced lifestyle for today's youth. So, now based on this social situation, this research will investigate the sleep status of 10th and 11th-grade students in public schools and international schools and do a Two sample z-test for proportion.
2.2. Research Questions
a. Whether these data (Figure 1-3) give convincing evidence at the α = 0.05 level that the proportion of students from public schools who sleep less than 6 hours is more than the proportion of students from international schools who sleep less than 6 hours.
b. Construct and interpret a 95% confidence interval for the true difference between the proportion of students from public schools and those from international schools whose sleeping time is less than 6 hours.
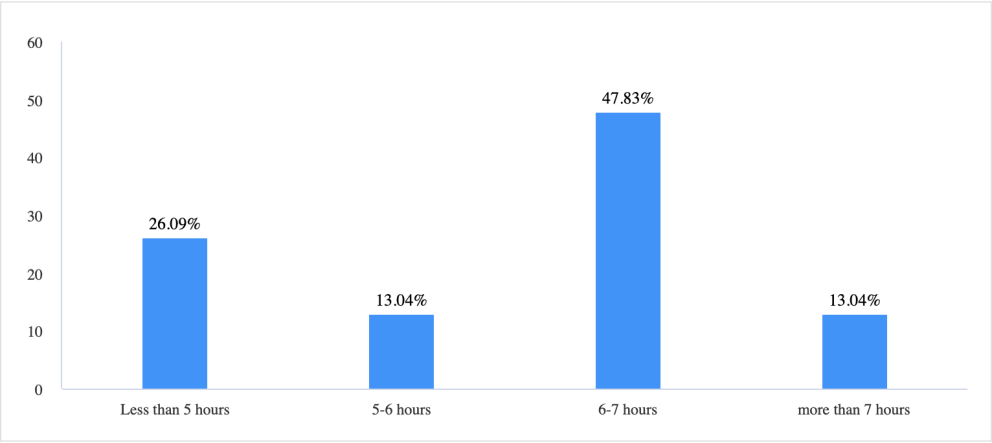
Figure 1: Bar Chart of the sleeping hours of students from public school(1)
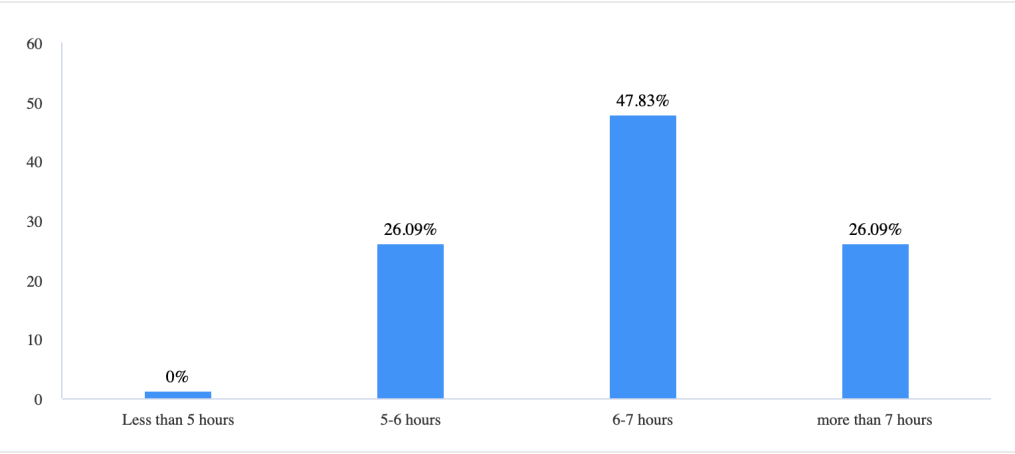
Figure 2: Bar Chart of the sleeping hours of students from public school(2)
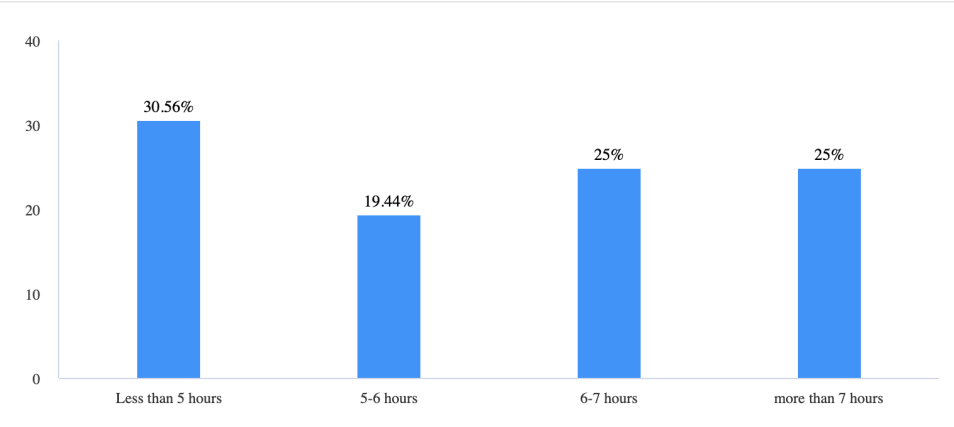
Figure 3: Bar Chart of the sleeping hours of students from international school
Due to some omissions in the initial questionnaire design, the classification of public school is further subdivided into public school and private school (the only difference from the former is that private school introduces private capital to run the school). So, in the following statistical analysis calculation, this research will integrate the data of these two categories together as a proportion of students from public school.
3. Data Collection
3.1. Sampling
For the purpose of this study, the research mainly focuses on students in grade 10 of international schools from Qingdao and Dalian. As of the day of our data analysis, 35 students had participated in the survey. Due to all of the students that are surveyed from Grade 10 and 11, the single variable can be controlled very well. Researchers have published a questionnaire with 5 questions on social media (see Figure 4).
3.2. Demonstration of the Questionnaire (Purposes) and Data Cleaning
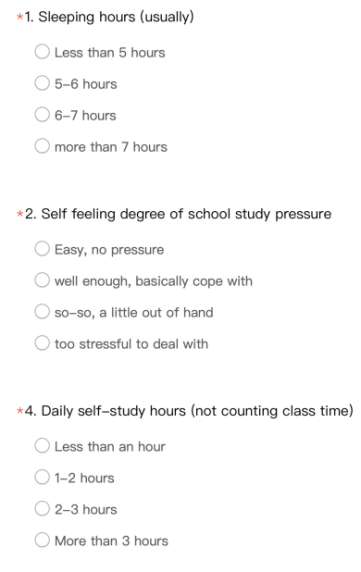
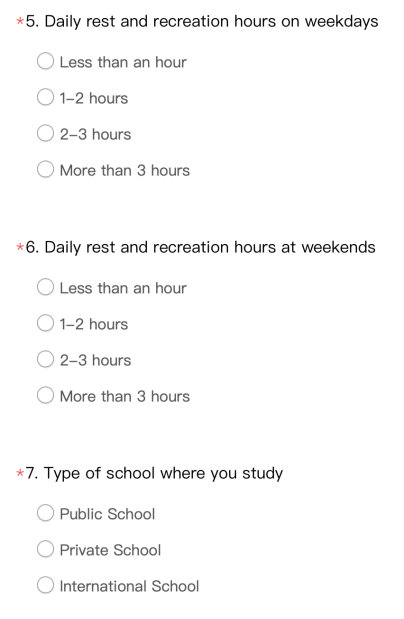
Figure 4: The questionnaire
Sleeping Hours (Usually) – Measures students' typical sleep duration to identify trends in sleep deprivation.
B. Self-Feeling Degree of School Study Pressure – Assesses academic stress levels to explore their impact on sleep.
C. Daily Self-Study Hours (Not Counting Class Time) – Evaluates extra study time to examine its trade-off with sleep.
D. Daily Rest and Recreation Hours (Weekdays & Weekends) – Tracks leisure time to analyze its role in stress and sleep balance.
E. Type of School Where You Study – Differentiates between public and international schools to compare their influence on sleep and study habits.
To make the findings to be more accurate, this research has removed several invalid data that may disturb the analysis. There was a response that is been wrongly answered is also been removed.
4. Data Analysis
4.1. Test Procedure
Research Question 1:
Procedure: Two sample z-test for the difference of population proportions
H0: p1-p2=0
Ha: p1-p2>0
Where p1 means the true proportion of students from those public schools whose sleeping time is less than 6 hours; p2 means the true proportion of students from those international schools whose sleeping time is less than 6 hours.
Research Question 2:
Procedure: Two-sample z interval for the difference of population proportions
Where p1 also means the true proportion of students from those international schools whose sleeping time is less than 6 hours.
4.2. Test/Interval Condition Check
Table 1 are the conditions check of two research questions. \( \hat{pc} \) = \( \frac{x1+x2}{n1+n2} \) , which is a pooling combination calculation.
Table 1: Conditions Check of two research questions
Research Question 1 | Research Question 2 |
Random: The students were random selected | Random: The students were random selected |
Independent: The sample sizes are less than 10% of all students in those public schools and international schools | Independent: The sample sizes are less than 10% of all students in those public schools and international schools |
Normal/Large Count: The sample size times the proportion is more than or equal to 10; The sample size times 1minus the proportion is also greater and equal to 10. ( n1 \( \hat{pc} \) ≥10, n1(1- \( \hat{pc} \) )≥10; n2 \( \hat{pc} \) ≥10, n2(1- \( \hat{pc} \) )≥10) | Normal/Large Count: The sample size times the proportion is more than or equal to 10; The sample size times 1minus the proportion is also greater and equal to 10. ( n1 \( \hat{p1} \) ≥10, n1(1- \( \hat{p1} \) )≥10; n2 \( \hat{p2} \) ≥10, n2(1- \( \hat{p2} \) )≥10) |
4.3. Test Statistics and P-value
(i)The formula of Two sample z-test is shown below.
\( \frac{(\hat{p1}-\hat{p2)-0}}{\sqrt[]{\frac{\hat{pc}(1-\hat{pc})}{n1}+\frac{\hat{pc}(1-\hat{pc})}{n2}}} \) (1)
From the data gathered from the questionnaire, the proportions are been calculated and put in to the equation as below
\( z=\frac{0.326-0.5}{\sqrt[]{\frac{0.402(1-0.402)}{46}+\frac{0.402(1-0.402)}{36}}} \) (2)
After the calculation, Z=-1.60
According to Z, we find the P-value of this One- sample z-test in the corresponding Table A that P-value=P(z<-1.60) =0.0548
At the significance level of α=0.05
The P-value 0.0548 is greater than 0.05, so we fail to reject the null hypothesis, which concludes that the study has no convincing evidence that the proportion of students from public schools who sleep less than 6 hours is more than the proportion of students from international schools who sleep less than 6 hours.
(ii)The formula of Confidence Interval for proportion is shown below.
\( \hat{(p1}-\hat{p2})±{z^{*}}\sqrt[]{\frac{\hat{p1}(1-\hat{p1})}{n1}+\frac{\hat{p2}(1-\hat{p2})}{n2}} \) (3)
From the data gathered from the questionnaire, the proportions are been calculated and put into the equation as below:
\( (0.326-0.5)±1.96×\sqrt[]{\frac{0.326(1-0.326)}{46}+\frac{0.5(1-0.5)}{36}}≈ \) (4)
In conclusion, we are 95% confident that the interval from -0.386 to 0.0383 captures the true difference between the proportion of students from public schools and those from international schools whose sleeping time is less than 6 hours.
4.4. Data Visualization
Here are the Data Visualization of the research(see Figure 5-8):
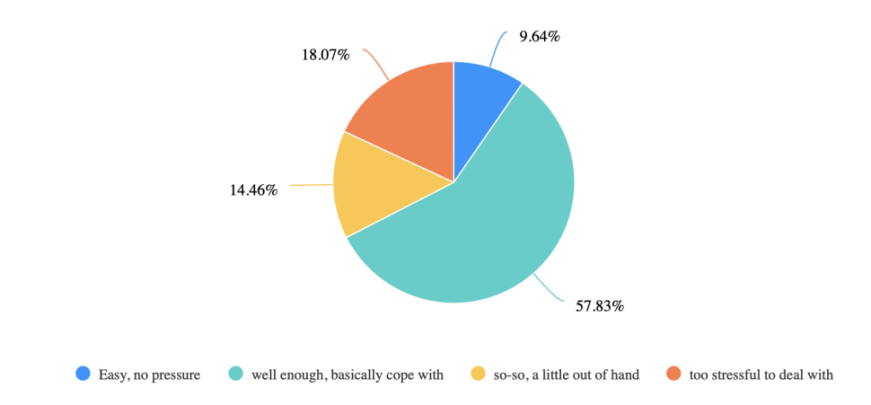
Figure 5: Pie Chart of Self feeling degree of school study pressure of all students being surveyed
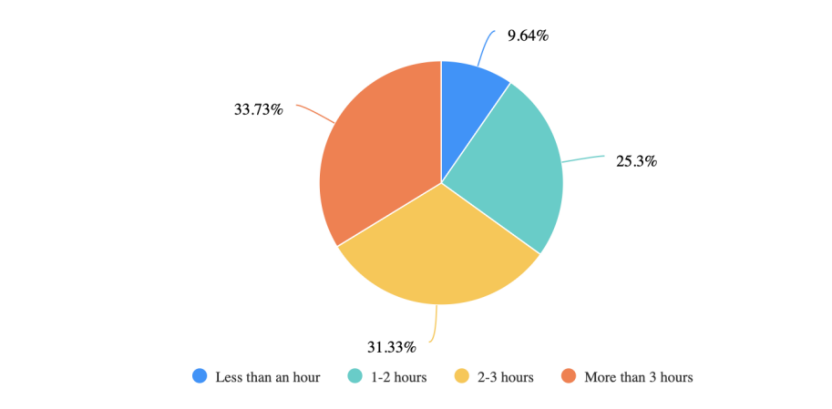
Figure 6: Pie Chart of Daily self-study hours of all students being surveyed
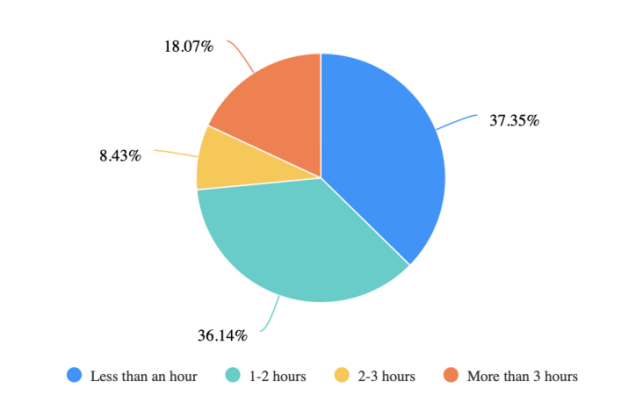
Figure 7: Pie Chart of Daily rest and recreation hours on weekdays of all students being surveyed
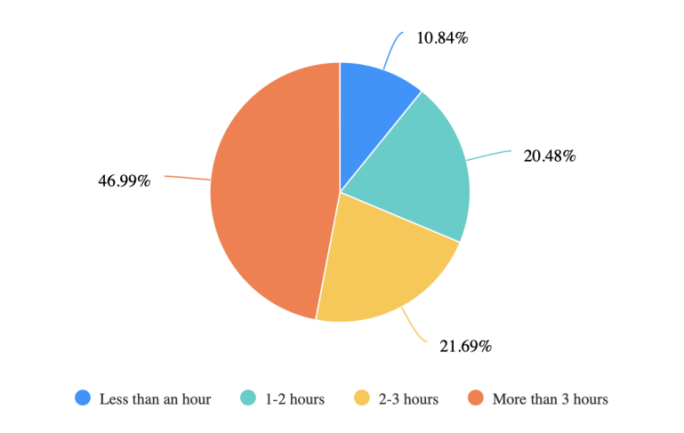
Figure 8: Pie Chart of Daily rest and recreation hours at weekends of all students being surveyed
4.5. Results and Findings
The results of the two-sample z-test for the difference in population proportions indicate that there is no statistically significant difference in the proportion of students from public and international schools who sleep less than six hours per night. The test yielded a z-score of -1.60 with a p-value of 0.0548, which is greater than the significance level (α= 0.05). As a result, this research fails to reject the null hypothesis (H0: p1-p2=0), meaning we do not have convincing evidence that students in public schools experience shorter sleep duration compared to those in international schools.
Furthermore, the 95% confidence interval for the difference in proportions is (-0.386, 0.0383). Since the interval includes zero, it suggests no significant disparity in sleep deprivation levels between public and international school students. This finding challenges the common assumption that students in public schools experience higher academic pressure leading to more sleep deprivation, indicating that both school types present similar challenges in balancing academic workload and rest.
5. Conclusion
This study investigated the impact of sleep duration on academic performance among high school students in public and international schools. Using a two-sample z-test for proportion, we examined whether students in public schools were more likely to experience sleep deprivation (less than 6 hours of sleep) than those in international schools. These findings highlight that sleep deprivation is a widespread issue affecting students in both school types. The assumption that public school students experience significantly higher academic stress, leading to more sleep deprivation, was not supported by this study. Instead, our results suggest that factors beyond school type—such as time management, extracurricular commitments, and individual lifestyle choices—may play a more crucial role in determining students' sleep duration. Despite its contributions, this study has several limitations. The sample size was relatively small, which restricted deeper subgroup analysis. Additionally, the data were collected through voluntary self-report surveys, which may introduce response bias. Another limitation is that students from international schools were not from a single institution, leading to slight inconsistencies in learning environments. Moreover, most participants were recruited through the researcher's personal WeChat social circle, which may limit the generalizability of the findings. Regardless of school type, students must develop effective time management strategies to balance academics, rest, and extracurricular activities. Schools should consider policies that support better sleep hygiene, such as adjusting school start times or providing resources for stress management. For 10th and 11th graders, especially those preparing for university applications, structured study plans and reducing excessive screen time can help improve sleep quality. This study underscores that sleep deprivation is not exclusive to one school system but a broader issue affecting high school students across different educational environments. Future research should explore additional factors such as sleep quality, stress levels, and lifestyle habits to provide a more comprehensive understanding of how sleep influences student well-being and academic performance.
References
[1]. Summer, J. V., & Summer, J. V. (2023, December 21). How much sleep should a teenager get?Sleep Foundation. https://www.sleepfoundation.org/teens-and-sleep/how-much-sleep-does-a-teenager-need#:~:text=The%20optimal%20amount%20of%20sleep%20for%20teens%20between,recommendation%20differs%20for%20both%20preteens%20and%20young%20adults.
[2]. Alfonsi, V., Scarpelli, S., D’Atri, A., Stella, G., & De Gennaro, L. (2020). Later School Start Time: The Impact of Sleep on Academic Performance and Health in the Adolescent Population. International Journal of Environmental Research and Public Health, 17(7), 2574. https://doi.org/10.3390/ijerph17072574
[3]. Schiza, S. E., Simantirakis, E., Bouloukaki, I., Mermigkis, C., Arfanakis, D., Chrysostomakis, S., Chlouverakis, G., Kallergis, E. M., Vardas, P., & Siafakas, N. M. (2010). Sleep patterns in patients with acute coronary syndromes. Sleep Medicine, 11(2), 149-153. https://doi.org/10.1016/j.sleep.2009.07.016
[4]. Ng, E. P., Ng, D. K., & Chan, C. H. (2009). Sleep duration, wake/sleep symptoms, and academic performance in Hong Kong Secondary School Children. Sleep and Breathing, 13(4), 357-367. https://doi.org/10.1007/s11325-009-0255-5
[5]. Garcia, G. L. B., Recio, A. B., Escueta, H. G., Ilagan, M., Morales, Z. D., Torres, N., Novilla, K. J., & Dacles, M. K. (2023). The relationship of sleep hours on the academic performance and classroom participation of senior high school students. International Journal of Advanced Research and Publications, 6(8), 23-24. https://www.ijarp.org
Cite this article
Li,J. (2025). Comparison of the Influence of Sleep Duration on Learning of High School Students in Public Schools and International Schools based on Z-test. Theoretical and Natural Science,100,1-8.
Data availability
The datasets used and/or analyzed during the current study will be available from the authors upon reasonable request.
Disclaimer/Publisher's Note
The statements, opinions and data contained in all publications are solely those of the individual author(s) and contributor(s) and not of EWA Publishing and/or the editor(s). EWA Publishing and/or the editor(s) disclaim responsibility for any injury to people or property resulting from any ideas, methods, instructions or products referred to in the content.
About volume
Volume title: Proceedings of the 3rd International Conference on Mathematical Physics and Computational Simulation
© 2024 by the author(s). Licensee EWA Publishing, Oxford, UK. This article is an open access article distributed under the terms and
conditions of the Creative Commons Attribution (CC BY) license. Authors who
publish this series agree to the following terms:
1. Authors retain copyright and grant the series right of first publication with the work simultaneously licensed under a Creative Commons
Attribution License that allows others to share the work with an acknowledgment of the work's authorship and initial publication in this
series.
2. Authors are able to enter into separate, additional contractual arrangements for the non-exclusive distribution of the series's published
version of the work (e.g., post it to an institutional repository or publish it in a book), with an acknowledgment of its initial
publication in this series.
3. Authors are permitted and encouraged to post their work online (e.g., in institutional repositories or on their website) prior to and
during the submission process, as it can lead to productive exchanges, as well as earlier and greater citation of published work (See
Open access policy for details).
References
[1]. Summer, J. V., & Summer, J. V. (2023, December 21). How much sleep should a teenager get?Sleep Foundation. https://www.sleepfoundation.org/teens-and-sleep/how-much-sleep-does-a-teenager-need#:~:text=The%20optimal%20amount%20of%20sleep%20for%20teens%20between,recommendation%20differs%20for%20both%20preteens%20and%20young%20adults.
[2]. Alfonsi, V., Scarpelli, S., D’Atri, A., Stella, G., & De Gennaro, L. (2020). Later School Start Time: The Impact of Sleep on Academic Performance and Health in the Adolescent Population. International Journal of Environmental Research and Public Health, 17(7), 2574. https://doi.org/10.3390/ijerph17072574
[3]. Schiza, S. E., Simantirakis, E., Bouloukaki, I., Mermigkis, C., Arfanakis, D., Chrysostomakis, S., Chlouverakis, G., Kallergis, E. M., Vardas, P., & Siafakas, N. M. (2010). Sleep patterns in patients with acute coronary syndromes. Sleep Medicine, 11(2), 149-153. https://doi.org/10.1016/j.sleep.2009.07.016
[4]. Ng, E. P., Ng, D. K., & Chan, C. H. (2009). Sleep duration, wake/sleep symptoms, and academic performance in Hong Kong Secondary School Children. Sleep and Breathing, 13(4), 357-367. https://doi.org/10.1007/s11325-009-0255-5
[5]. Garcia, G. L. B., Recio, A. B., Escueta, H. G., Ilagan, M., Morales, Z. D., Torres, N., Novilla, K. J., & Dacles, M. K. (2023). The relationship of sleep hours on the academic performance and classroom participation of senior high school students. International Journal of Advanced Research and Publications, 6(8), 23-24. https://www.ijarp.org