


1. Literature Review
1.1. MYC Gene and Its Protein Structure and Function
The MYC family is a group of important proto-oncogenes, including MYC, MYCN, and MYCL. The transcription factors they encode have broad transcriptional regulatory functions. MYC family proteins affect various cellular processes such as cell proliferation, differentiation, apoptosis, and metabolism by regulating the expression of numerous target genes[1]. The MYC gene is located on the long arm of human chromosome 8 (8q24.21), with a full gene length of approximately 6.1 kb, containing three major exons and two introns. The transcription start sites of the MYC gene are mainly concentrated in two promoter regions, P1 and P2, with P2 being the primary transcription start site responsible for generating about 75% to 90% of MYC mRNA[2] (Figure 1).
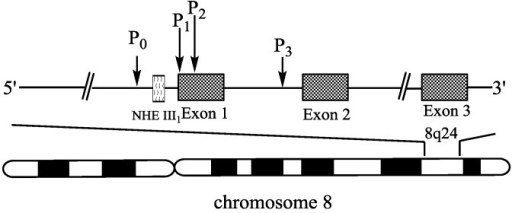
Figure 1: Structure of the MYC gene. Image referenced from literature[3].
The MYC protein consists of 439 amino acids, with a molecular weight of approximately 49 kDa, and contains four key structural domains: the transcription activation domain (TAD), the basic region (BR), the helix-loop-helix structure (HLH), and the leucine zipper structure (LZ). The TAD is located at the amino-terminus and consists of 143 amino acids, containing MYC Box I (MB I) and MYC Box II (MB II), which are involved in protein regulation and cofactor recruitment. The BR, HLH, and LZ domains are located at the carboxy-terminus and are responsible for MYC’s binding to DNA and forming a dimer with MAX (Figure 2), thereby regulating downstream gene transcription. The amino-terminal domain of MYC can bind to the retinal tumor suppressor gene product pRb, inhibiting its function as a tumor suppressor.
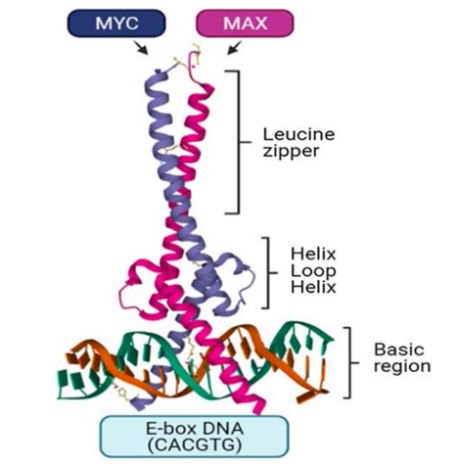
Figure 2: Structure and function of the MYC protein. Image referenced from literature[4].
1.2. MYC Regulation of Cell Proliferation Mechanisms
1.2.1. MYC Regulation of Glycolysis
As a transcription factor, MYC can bind to the promoter regions of key enzymes in the glycolytic pathway, thereby upregulating the expression of these genes and enhancing the efficiency of glycolysis[5]. Glycolysis is a metabolic process that occurs in the cytoplasm, where glucose is broken down into pyruvate and is one of the main ways cells obtain energy. This process does not depend on oxygen and can rapidly generate ATP (Adenosine Triphosphate), providing immediate energy for cells. In cancer cells, a higher glycolytic efficiency is especially important because, compared to normal cells, cancer cells require more energy and faster energy replenishment to support their rapid proliferation. The enhancement of glycolytic efficiency meets this need for energy. Key enzymes upregulated by MYC include PDH (Pyruvate Dehydrogenase), PFK1 (Phosphofructokinase 1), and HK (Hexokinase), which are responsible for glucose phosphorylation, the formation of fructose-6-phosphate, and the generation of pyruvate (Figure 3).
1.2.2. MYC Regulation of the Citric Acid Cycle Metabolism
In addition to influencing glycolysis, MYC can also regulate citric acid cycle metabolism. MYC upregulates the expression of ACYL (ATP Citrate Lyase) and ACC1 (Acetyl-CoA Carboxylase 1), which enhances fatty acid synthesis[6]. ACYL is a key enzyme in the citric acid cycle that converts citrate into Acetyl-CoA, an important precursor for fatty acid synthesis. ACC1 further converts Acetyl-CoA into Malonyl-CoA, which is a key intermediate for fatty acid synthesis. By upregulating these enzymes, MYC promotes fatty acid synthesis, which is crucial for rapidly proliferating cancer cells because newly generated cells need large amounts of fatty acids for the phospholipid bilayer of their membranes. Adequate fatty acid supply is critical for supporting cancer cell proliferation (Figure 3).
Figure 3: Abnormal MYC expression affects cell metabolism. Image referenced from literature[6].
1.2.3. MYC Regulation of p53 and Impact on Cell Death
In myeloma and triple-negative breast cancer, MYC regulates the p53 signaling pathway to suppress cell death. MIZ1 (Myc-interacting Zinc Finger Protein 1) is a zinc finger transcription factor involved in regulating cell proliferation, differentiation, apoptosis, and stress responses[7]. In normal cells, MIZ1 activates the CDKN2A gene encoding ARF (Alternate Reading Frame), a tumor suppressor gene located in the nucleolus. ARF binds to and inhibits MDM2 (Murine Double Minute 2), a negative regulator of p53, preventing p53 degradation and maintaining its stability and activity, thereby promoting apoptosis. However, when MIZ1 binds to MYC, ARF expression is inhibited, leading to enhanced MDM2-mediated degradation of p53, thereby weakening the p53 pathway and allowing cells to evade apoptosis. For cancer cells, this mechanism of evading cell death enhances their survival ability and promotes tumor development (Figure 4).
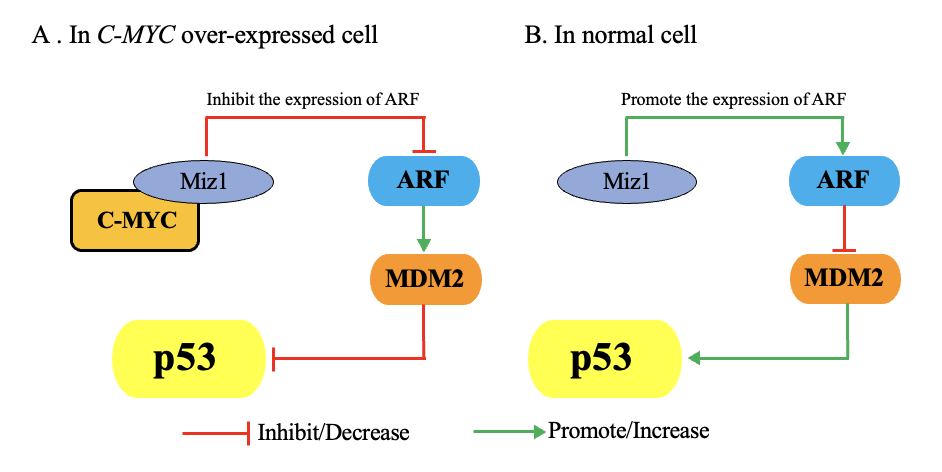
Figure 4: MYC regulation of p53 and impact on cell death. Image adapted from literature[7].
1.2.4. MYC Regulation of Macrophage Activity
In osteosarcoma, MYC can reduce tumor immune surveillance by inhibiting the translation of certain proteins[8]. When MYC is abnormally overexpressed, it can bind to the promoter regions of genes encoding miR-17-5p and miR-20a, thus upregulating the expression of these two microRNAs. These microRNAs are members of the miR-17-92 cluster, which plays a significant regulatory role in cell proliferation, differentiation, apoptosis, and tumorigenesis. Overexpression of these microRNAs binds to the mRNA of CSF1 (Colony Stimulating Factor 1), inhibiting its translation. CSF1 is a cytokine that regulates the growth, differentiation, and survival of monocyte-macrophage lineage cells. CSF1 interacts with its receptor CSF1R (Colony Stimulating Factor 1 Receptor) to activate downstream signaling pathways that promote macrophage proliferation, survival, and functional activation. However, when the translation of CSF1 mRNA is inhibited, CSF1 levels decrease, resulting in a significant reduction of M1 macrophages in the tumor microenvironment. The decrease in M1 macrophages weakens immune surveillance of tumors, ultimately promoting cancer cell survival, proliferation, and immune evasion (Figure 5).
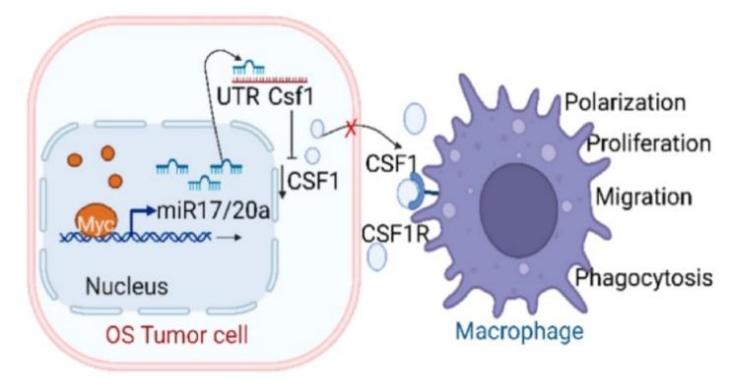
Figure 5: Abnormal MYC expression inhibits macrophage activity. Image referenced from literature[8].
1.2.5. MYC Regulation of Immune-Related Signaling
In breast cancer, colorectal cancer, and lung cancer cells, MYC also evades immune surveillance by altering the surrounding tumor microenvironment[9]. First, MYC's abnormal expression in tumor cells upregulates the expression of two signals: CD47 (Cluster of Differentiation 47) and PD-L1 (Programmed Death-Ligand 1). CD47 is a transmembrane protein known as the "don’t eat me" signal. By binding to the signaling protein SIRPα (Signal Regulatory Protein Alpha) on macrophages and other phagocytic cells, CD47 inhibits their phagocytic activity. PD-L1, another immune checkpoint molecule, inhibits T-cell activation and proliferation when it binds to the PD-1 receptor (Programmed Cell Death Protein 1) on T-cells, thereby reducing T-cell inflammatory responses and cytotoxic activity. When these two signals are highly expressed in tumor cells, immune cells' phagocytosis and T-cell attacks are suppressed, allowing tumor cells to evade immune surveillance and escape (Figure 6).
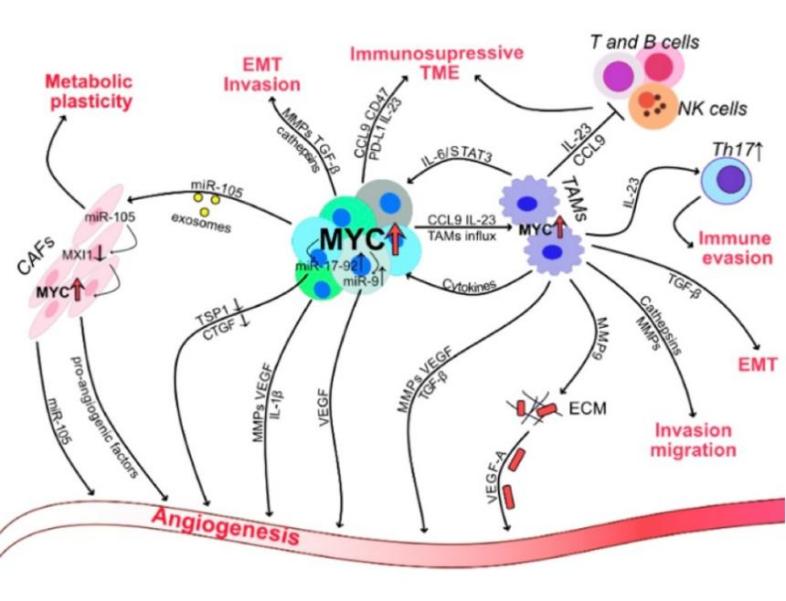
Figure 6: Abnormal MYC expression in cancer cells impacts the tumor microenvironment. Image referenced from literature[9].
2. Materials and Methods
2.1. Materials and Instruments
K562 cells and the pX458 plasmid were obtained from East China Normal University, while A549 cells were sourced from the Chinese Academy of Sciences Cell Bank. Other important materials and their sources include BbsI enzyme solution (NEB, Cat: R3539S), Lipofectamine transfection reagent kit (Thermo Scientific, Cat: L3000075), RNA extraction kit (Magen, Cat: R4012-02), RNA reverse transcription kit (Yeasen, Cat: 11120ES60), genomic DNA extraction kit (Beyotime, Cat: D0091M), T7EI enzyme mutation detection kit (NEB, Cat: E3321S), CCK8 cell proliferation kit (Vazyme, Cat: A311-01-AA), Giemsa stain (Merck, Cat: G4507-5G), high-purity plasmid mini-prep kit (Tiangen, Cat: DP104). The key experimental instruments include a fluorescence microscope (ECHO, Cat: ECHO revolve), flow sorter (MOFLO XDP, Cat: Summit 5.2 software).
2.2. Methods
2.2.1. Constructing the Gene Editing Vector
(1) Synthesize the nucleotide sequences for three target sgRNAs (synthesized by Platinum Biotech, Shanghai). sgRNA 1 sequence: GCCGTATTTCTACTGCGACGAGG; sgRNA 2 sequence: CGACGTGGCTCAGCATCAGCTCC; sgRNA 3 sequence: CTATGACCTCGACTACGACTCGG. Mix the corresponding solutions of the synthesized DNA template strands, immerse them in boiling water, and allow to cool to room temperature for annealing. (2) Plasmid digestion and synthesis fragment ligation: Perform BbsI enzyme digestion of the pX458 plasmid, reaction system shown in Table 1. Mix and incubate at 37°C for 20 minutes. Perform gel electrophoresis to detect the digested plasmid and recover the successful fragments using a gel recovery kit. Construct the ligation reaction system with the digested plasmid and synthesized DNA template, shown in Table 2. Incubate the mixed solution at room temperature overnight. (3) Plasmid transformation and amplification: Mix 40 μL of DH5α competent cells with 50 μL of ligated plasmid solution, incubate on ice for 10 minutes. Perform heat shock at 42°C for 90 seconds, followed by immediate incubation on ice for 2 minutes. Add 460 μL of LB liquid medium without antibiotics and incubate at 37°C, 200 rpm for 1 hour. Spread 20 μL of bacterial solution onto LB plates containing antibiotics and incubate at 37°C for 16 hours. (4) Collecting gene editing vectors: Pick bacterial colonies from the LB plate and culture overnight in LB medium with antibiotics. Extract plasmid DNA according to the high-purity plasmid mini-prep kit instructions, sequence it, and verify the successful construction of the gene editing vector.
2.2.2. Constructing MYC Gene Knockout Cell Lines
(1) Lipofectamine transfection: Transfect the constructed gene editing vector into K562 and A549 cell lines following the Lipofectamine transfection reagent instructions.
Fluorescence microscopy observation: Observe the GFP fluorescence intensity in the cells 24 hours and 48 hours post-transfection. (2) Flow cytometry: Sort cells expressing GFP (green fluorescence) using a flow sorter, indicating successful transfection of the gene editing vector.
2.2.3. Detecting the Gene Knockout Effect
(1)T7E1 Enzyme Digestion: Use the genomic DNA extraction kit to extract the genomic DNA from the sorted cells. Set up the PCR reaction system according to Table 3 and perform PCR amplification using the program shown in Table 4. Then, perform enzyme digestion with the T7EI enzyme according to the T7EI mutation detection kit instructions. Separate the different-length bands by agarose gel electrophoresis and observe the band width and intensity. (2) T-vector Cloning Sequencing: According to the T-vector cloning kit instructions, ligate the PCR products with the T-vector. Transform the ligated plasmid into competent cells for amplification, and then extract the plasmid for sequencing. The steps are the same as described in sections 1 and 2. (3) qPCR: Synthesize qPCR primers for HBB, CDK1, and MYC. The primer sequences for HBB are: AGGAGAAGTCTGCCGTTACTG; for CDK1: GGATGTGCTTATGCAGGATTCC; and for MYC: GGCTCCTGGCAAAAGGTCA. (All primers were synthesized by Platinum Biotech, Shanghai). Extract RNA using the RNA extraction kit according to the manufacturer's instructions. Reverse-transcribe the RNA into cDNA using the RNA reverse transcription kit. Set up the qPCR system on ice as shown in Table 5. Run the qPCR amplification program as shown in Table 6. (4) Western Blot Immunoblotting: Clean the glass plates and dry them. Prepare the separation and stacking gels in advance and store them at 4°C. Add 10% APS and TEMED before use. After pouring two-thirds of the separation gel, immediately seal it. If the gel concentration is low, use 0.1% SDS for sealing; if the concentration is higher, use isobutanol. After the gel solidifies, clean it and complete the stacking gel pouring, then remove the comb. After washing the cells with PBS, add lysis buffer and incubate on ice for 10-20 minutes. Scrape the cells and process them with sonication. Centrifuge to remove impurities. Adjust the sample concentration and add loading buffer, then heat the samples before loading. During SDS-PAGE, separate the samples at 100-150V until the indicator reaches near the bottom of the gel. After electrophoresis, soak the PVDF membrane in methanol for 5-10 seconds, then treat it with balance solution. Soak the gel in transfer buffer for 5 minutes, and then assemble the membrane, gel, and other materials in the transfer apparatus for electroblotting. Adjust the transfer time based on the protein molecular weight. Finally, treat the membrane with blocking solution, add primary and secondary antibodies, incubate on a shaker, then wash with PBST and develop using chemiluminescence. After development, treat the membrane with fixing solution, wash it, and let it dry. (5) Growth Curve: In a 96-well plate, inoculate the cell suspension (100 μL/well) and pre-incubate for 24 hours. Add 10 μL of CCK-8 solution to each well. Incubate the plate in the incubator for 1-4 hours. Measure the absorbance at 450 nm using a microplate reader and record the OD values. (6) Giemsa Staining:
Fix the slides with methanol for approximately 3 minutes. Immerse the fixed slides into diluted Giemsa stain solution and stain for about 20 minutes. Wash the slides with buffer for 1 minute and repeat once. Dry the slides in the air or in a 50°C drying cabinet.
Table 1: pX458 Plasmid Digestion System
Components | Amount |
BbsI enzyme solution | 2 μL |
10× Buffer | 2 μL |
pX458plasmid(0.5-1 μg/μL) | 1 μL |
Nuclease-free water | μL |
Table 2: pX458 Plasmid Ligation System
Components | Amount |
Recovered pX458 plasmid | 50-100 ng |
Insert fragment | Three times the molar amount of vector |
T4 DNA ligase | 1 μL |
10× T4 DNA ligase buffer | 2 μL |
Nuclease-free water | To 20 μL |
Table 3: PCR Reaction System
Components | Amount | Concentration |
Q5 Hot Start High-Fidelity 2X Master Mix | 25 μL | 1× |
10 µM Forward Primer | 2.5 μL | 0.5 μM |
10 µM Reverse Primer | 2.5 μL | 0.5 μM |
Template DNA | 100 ng total | |
Nuclease-free water | To 50 μL |
Table 4: PCR Amplification Program
Steps | Temperature | Time |
Initial denaturation | 98℃ | 30 sec |
35 cycles | ||
98℃ | 5 sec | |
50-72℃ | 10 sec | |
72℃ | 20 sec | |
Final extension | 72℃ | 2 min |
Hold | 4-10℃ |
Table 5: qPCR Reaction System
Components | Amount | Final concentration |
Hieff® qPCR SYBR Green Master Mix (No Rox) | 10 μL | 1× |
Forward primer(10 μM) | 0.4 μL | 0.2 μM |
Reverse primer(10 μM) | 0.4 μL | 0.2 μM |
DNA template | X | - |
Nuclease-free water | To 20 μL | - |
Table 6: qPCR Amplification Program
Steps | Temperature | Time | Number of cycle |
Pre-denaturatio | 95℃ | 5 min | 1 |
Denaturation | 95℃ | 10 sec | 40 |
Annealing | 55-60℃ | 20 sec | |
Extension | 72℃ | 20 sec | |
Melt curve stage | Default settings | 1 | |
3. Results and Analysis
The first step in this study was to construct the gene editing vector. This involved digesting the plasmid and inserting the chemically synthesized sgRNA nucleotide sequences (sequence information provided in Materials and Methods). The MYC gene contains three exons and two introns (Figure 3.1.A). The three designed knockout target sites are all located within 200 bp before the second exon of the MYC gene (Figure 3.1.B). Based on the results provided by the CRISPR design tool from Zhang Feng's laboratory (http://crispor.tefor.net/)[9], three target sites with the highest editing efficiency were selected for this study.
After synthesizing the nucleotide sequences, the plasmid needed to undergo BbsI digestion. Gel electrophoresis results showed (Figure 7.C) that the digested plasmid migrated significantly shorter distances in the gel compared to the undigested plasmid, confirming successful digestion of the pX458 plasmid. After digesting the plasmid and ligating the synthesized nucleotide sequences, the plasmid was transformed into competent cells for amplification. The E. coli without transformed plasmid failed to grow on ampicillin-containing medium, confirming the effectiveness of the antibiotic. The remaining four groups of E. coli transformed with plasmids all showed good growth, and multiple single colonies appeared, indicating successful plasmid ligation (Figure 7.D). Plasmids were extracted from the selected bacterial colonies and sequenced to obtain the specific DNA sequence information of the plasmid. Comparing the obtained sequences with the expected target plasmid sequence confirmed successful plasmid construction (Figure 7.E).
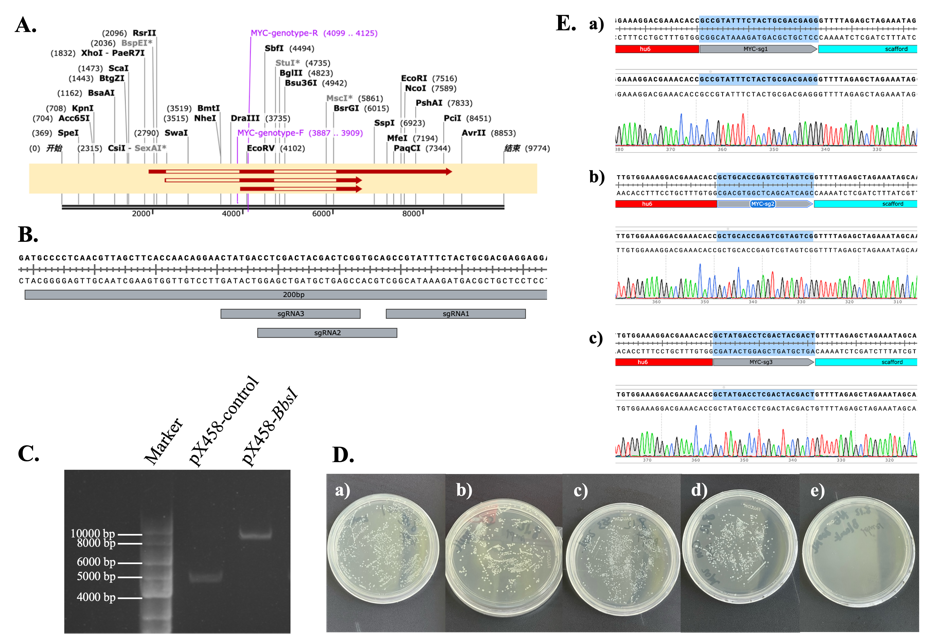
Figure 7: Construction of Gene Editing Vectors. A. Structure of the MYC gene. B. Target site positions and sequences. C. BbsI digestion of the pX458 plasmid. D. a) E. coli transformed with sg-1 plasmid; b) E. coli transformed with sg-2 plasmid; c) E. coli transformed with sg-3 plasmid; d) E. coli transformed with pX458 plasmid (control group); e) E. coli without plasmid transformation.
The second step of this study was to construct MYC gene knockout cell lines. After transfection, the cells were observed under a fluorescence microscope at 24 hours and 48 hours to preliminarily evaluate the transfection efficiency of the plasmid. The results showed that at 24 hours post-transfection, all three groups of cells successfully transfected with the plasmid. After 48 hours, the transfection rate of each group reached approximately 10% (Figure 8.A).To select the successfully transfected cells, fluorescence-activated cell sorting (FACS) was used to sort cells expressing EGFP green fluorescence, indicating that the gene editing vector had been successfully transfected into the cells. The sorted cells were cultured in groups. In A549 cells, the GFP positive rates for the sgRNA-1, sgRNA-2, and sgRNA-3 groups were 0.22%, 0.29%, and 0.13%, respectively, with the control group at 0.27% (Figure 8.B). In K562 cells, the GFP positive rates for the sgRNA-1, sgRNA-2, and sgRNA-3 groups were 2.09%, 4.13%, and 2.08%, respectively, with the control group at 2.37% (Figure 8.C).
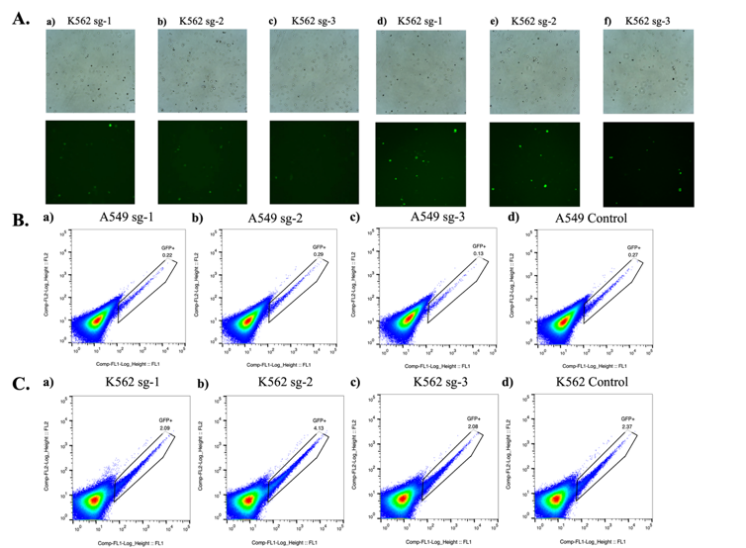
Figure 8: Construction of MYC Gene Knockout Cell Lines.A. a) 24 hours post-transfection in K562 sg-1 group; b) 24 hours post-transfection in K562 sg-2 group; c) 24 hours post-transfection in K562 sg-3 group; d) 48 hours post-transfection in K562 sg-1 group; e) 48 hours post-transfection in K562 sg-2 group; f) 48 hours post-transfection in K562 sg-3 group.B. GFP positive rate in A549 cells. C. GFP positive rate in K562 cells.
The third step in this study was to detect the MYC gene knockout effect, using six detection methods at the DNA, RNA, protein, and cellular levels. First, T7EI enzyme digestion analysis was performed. The electrophoresis results showed (Figure 3.4.A) that in A549 cells, the sgRNA-1 group exhibited the highest editing efficiency (the brightest small DNA fragments generated by cleavage indicated multiple mismatches at the knockout site, confirming successful MYC gene knockout). The sgRNA-3 group followed, and the sgRNA-2 group exhibited the lowest editing efficiency. In K562 cells, the sgRNA-1 group also demonstrated the highest editing efficiency, followed by sgRNA-2, and sgRNA-3 exhibited the lowest efficiency.
T7E1 enzyme digestion results provided semi-quantitative evidence for the editing efficiency of the three target sites, but only sequencing could reveal the type of mutations generated at the cleavage sites, and thus the specific sequence changes. Therefore, TA cloning and sequencing techniques were used in this study. In K562 cells, editing at the sg-1 site resulted in an insertion of the AC sequence at 4021 bp and a deletion of T at 4022 bp (Figure 9.A). Editing at the sg-2 site caused a deletion of C at 998 bp and an insertion of A at 4000 bp (Figure 9.B). Editing at the sg-3 site led to a single base pair deletion at 3998 bp (Figure 9.C). In A549 cells, editing at the sg-1 site caused an insertion of AC at 4021 bp and a single base pair deletion at 4022 bp (Figure 9.D). Editing at the sg-2 site led to an insertion of A at 4000 bp (Figure 9.E). Editing at the sg-3 site caused a deletion of C at 3998 bp (Figure 9.F). In both cell lines, the resulting indels were approximately 1-2 base pairs in length, which effectively caused a frameshift mutation and thus prevented the formation of full-length MYC protein.
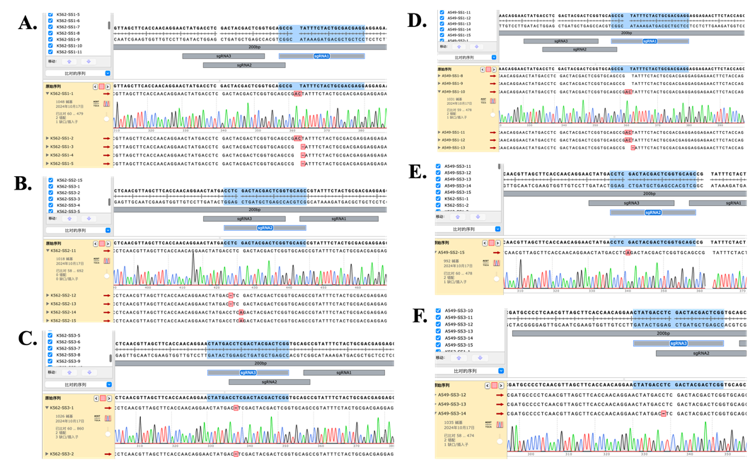
Figure 9: T-vector Cloning Sequencing Results. A. K562 sg-1 group. B. K562 sg-2 group. C. K562 sg-3 group. D. A549 sg-1 group. E. A549 sg-2 group. F. A549 sg-3 group.
At the DNA level, this study detected successful MYC gene knockout. At the RNA level, qPCR was used to detect changes in the expression of proliferation-related gene CDK1 and differentiation-related gene HBB. According to qPCR results, in both K562 and A549 cells, all three groups of cells showed a trend of decreased CDK1 expression and increased HBB expression after MYC gene knockout. Among them, the sgRNA-1 group showed the most pronounced trend, indicating that knocking out MYC at this target site had the most significant effect on inhibiting cell proliferation and enhancing differentiation ability (Figure 10.B). In contrast, the sgRNA-2 group showed the least pronounced trend. This result was consistent with the T7EI enzyme digestion analysis (Figure 10.A). Finally, MYC gene expression at the RNA level in both cell lines did not show significant changes. This study suggests that the knockout only caused mutations at the sequence level in the RNA, without affecting the overall RNA expression levels. Therefore, in subsequent experiments, protein-level verification was conducted using Western blot.
At the protein level, Western blot analysis was performed using the sg-1 target, which exhibited the highest editing efficiency. The blot results showed (Figure 10.C) that in both K562 and A549 cells, the MYC protein levels in the edited cells were much lower than those in the control group (thinner bands indicate lower protein levels). GAPDH levels were consistent between both samples, indicating the accuracy and reliability of the protein expression data.
At the cellular level, to assess whether MYC gene knockout reduced cell proliferation, the edited and unedited cells were cultured for four days. The growth curve was plotted using the CCK-8 reagent to visually demonstrate the impact of MYC gene knockout on cell proliferation ability. From the cell OD value line graphs of different days of culture (Figure 10.E), it was observed that on day 1, the number of viable cells in the edited group was nearly the same as that in the control group. However, as time passed, by day 3, the control group showed significantly more viable cells than the edited group, indicating that MYC gene knockout significantly reduced cell proliferation in both A549 and K562 cell lines.
Another cellular-level test was Giemsa staining. The results of Giemsa staining in K562 and A549 cells (Figure 10.D) showed that the control group cells had smooth, regular shapes with a clear boundary between the nucleus and cytoplasm. However, after MYC gene knockout, the cells exhibited irregular surfaces, with obvious membrane bubbling and severe cytoplasmic vacuolization. These vacuoles may have originated from the expansion of the endoplasmic reticulum, lysosome release, or loss of mitochondrial membrane potential, indicating that the cells were undergoing apoptosis. Membrane bubbling is a typical marker of the later stages of apoptosis. These membrane bubbles form from localized collapse and re-curvature of the cell membrane, containing cytoplasmic components and sometimes nuclear fragments. Therefore, A549 and K562 cells with MYC gene knockout exhibited significant signs of apoptosis.
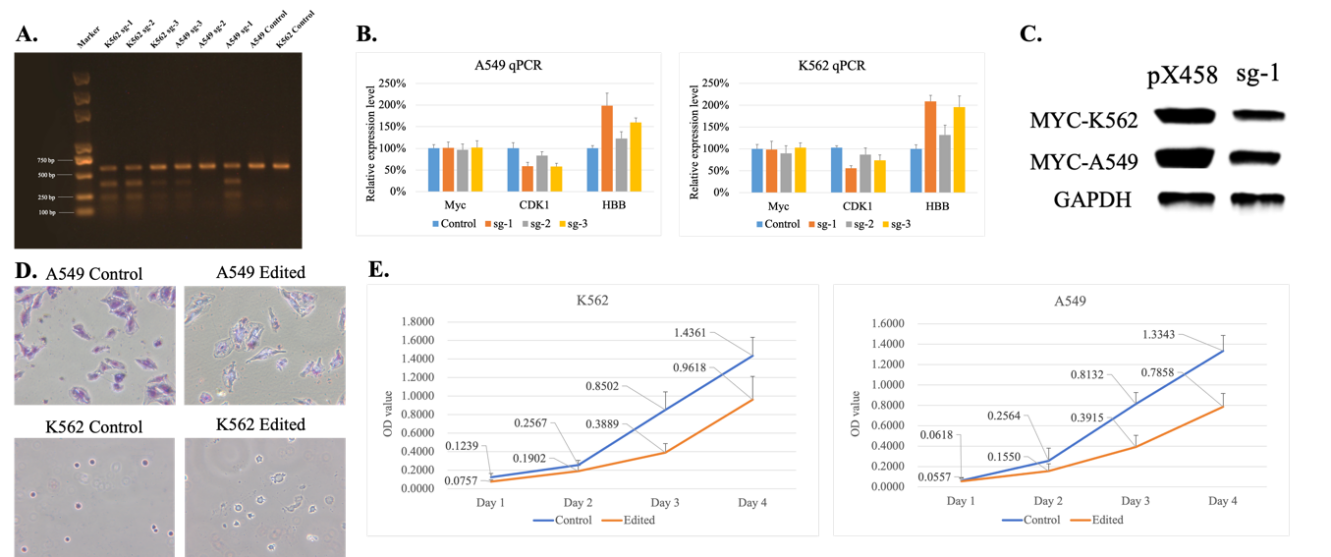
Figure 10: Detection of MYC Gene Knockout Effect. A. T7E1 enzyme digestion analysis. B. qPCR analysis of RNA expression levels. C. Western blot analysis of protein expression levels. D. Giemsa staining. E. Growth curve from Day 1 to Day 4.
4. Discussion and Outlook
This study utilized the CRISPR-Cas9 system to knock out the MYC gene and explored its role in CML and NSCLC cells. The experimental results showed that MYC gene knockout significantly inhibited the proliferation of cancer cells and promoted their differentiation. By comparing different sgRNA target sites, sgRNA1 showed the best editing efficiency and effectiveness. Although CRISPR-Cas9 technology holds potential in cancer treatment, its clinical application still faces challenges, including off-target effects, animal model validation, and the safety of delivery methods.
Off-target effects are one of the main challenges faced in the practical application of CRISPR-Cas9. Off-target mutations may occur at non-target sites, so optimizing Cas9 variants and sgRNA sequences, and combining other editing tools to improve precision, will be an area for further research. Animal model validation is also an essential step for preclinical applications. Mouse models can simulate the human tumor microenvironment, and long-term studies can help evaluate the effects of MYC gene knockout and provide important data support for subsequent clinical trials. Finally, innovations in delivery methods can also help in the application of this study. Future work should focus on optimizing existing delivery tools to improve their safety and specificity, promoting clinical translation.
References
[1]. Ahmadi, S. E., Rahimi, S., Zarandi, B., Chegeni, R. & Safa, M. MYC: a multipurpose oncogene with prognostic and therapeutic implications in blood malignancies. J Hematol Oncol 14, 121 (2021). https://doi.org:10.1186/s13045-021-01111-4
[2]. Dufort, D. & Nepveu, A. The human cut homeodomain protein represses transcription from the c-myc promoter. Mol Cell Biol 14, 4251-4257 (1994). https://doi.org:10.1128/mcb.14.6.4251-4257.1994
[3]. Carabet, L. A., Rennie, P. S. & Cherkasov, A. Therapeutic Inhibition of Myc in Cancer. Structural Bases and Computer-Aided Drug Discovery Approaches. Int J Mol Sci 20 (2018). https://doi.org:10.3390/ijms20010120
[4]. Ahmadi, S. E., Rahimi, S., Zarandi, B., Chegeni, R. & Safa, M. MYC: a multipurpose oncogene with prognostic and therapeutic implications in blood malignancies. Journal of hematology & oncology 14, 1-49 (2021).
[5]. Nowak, N., Kulma, A. & Gutowicz, J. Up-regulation of key glycolysis proteins in cancer development. Open Life Sciences 13, 569-581 (2018). https://doi.org:doi:10.1515/biol-2018-0068
[6]. Goetzman, E. S. & Prochownik, E. V. The Role for Myc in Coordinating Glycolysis, Oxidative Phosphorylation, Glutaminolysis, and Fatty Acid Metabolism in Normal and Neoplastic Tissues. Front Endocrinol (Lausanne) 9, 129 (2018). https://doi.org:10.3389/fendo.2018.00129
[7]. Kung, C. P. & Weber, J. D. It's Getting Complicated-A Fresh Look at p53-MDM2-ARF Triangle in Tumorigenesis and Cancer Therapy. Front Cell Dev Biol 10, 818744 (2022). https://doi.org:10.3389/fcell.2022.818744
[8]. Nirala, B. K. et al. MYC regulates CSF1 expression via microRNA 17/20a to modulate tumor-associated macrophages in osteosarcoma. JCI insight 8 (2023).
[9]. Meškytė, E. M., Keskas, S. & Ciribilli, Y. MYC as a multifaceted regulator of tumor microenvironment leading to metastasis. International Journal of Molecular Sciences 21, 7710 (2020).
[10]. Ran, F. A. et al. Genome engineering using the CRISPR-Cas9 system. Nature Protocols 8, 2281-2308 (2013). https://doi.org:10.1038/nprot.2013.143
Cite this article
Hao,R. (2025). Utilizing Gene Editing to Explore the Function of the MYC Gene in Chronic Myelogenous Leukemia and Human Non-Small Cell Lung Cancer. Theoretical and Natural Science,99,16-27.
Data availability
The datasets used and/or analyzed during the current study will be available from the authors upon reasonable request.
Disclaimer/Publisher's Note
The statements, opinions and data contained in all publications are solely those of the individual author(s) and contributor(s) and not of EWA Publishing and/or the editor(s). EWA Publishing and/or the editor(s) disclaim responsibility for any injury to people or property resulting from any ideas, methods, instructions or products referred to in the content.
About volume
Volume title: Proceedings of the 5th International Conference on Biological Engineering and Medical Science
© 2024 by the author(s). Licensee EWA Publishing, Oxford, UK. This article is an open access article distributed under the terms and
conditions of the Creative Commons Attribution (CC BY) license. Authors who
publish this series agree to the following terms:
1. Authors retain copyright and grant the series right of first publication with the work simultaneously licensed under a Creative Commons
Attribution License that allows others to share the work with an acknowledgment of the work's authorship and initial publication in this
series.
2. Authors are able to enter into separate, additional contractual arrangements for the non-exclusive distribution of the series's published
version of the work (e.g., post it to an institutional repository or publish it in a book), with an acknowledgment of its initial
publication in this series.
3. Authors are permitted and encouraged to post their work online (e.g., in institutional repositories or on their website) prior to and
during the submission process, as it can lead to productive exchanges, as well as earlier and greater citation of published work (See
Open access policy for details).
References
[1]. Ahmadi, S. E., Rahimi, S., Zarandi, B., Chegeni, R. & Safa, M. MYC: a multipurpose oncogene with prognostic and therapeutic implications in blood malignancies. J Hematol Oncol 14, 121 (2021). https://doi.org:10.1186/s13045-021-01111-4
[2]. Dufort, D. & Nepveu, A. The human cut homeodomain protein represses transcription from the c-myc promoter. Mol Cell Biol 14, 4251-4257 (1994). https://doi.org:10.1128/mcb.14.6.4251-4257.1994
[3]. Carabet, L. A., Rennie, P. S. & Cherkasov, A. Therapeutic Inhibition of Myc in Cancer. Structural Bases and Computer-Aided Drug Discovery Approaches. Int J Mol Sci 20 (2018). https://doi.org:10.3390/ijms20010120
[4]. Ahmadi, S. E., Rahimi, S., Zarandi, B., Chegeni, R. & Safa, M. MYC: a multipurpose oncogene with prognostic and therapeutic implications in blood malignancies. Journal of hematology & oncology 14, 1-49 (2021).
[5]. Nowak, N., Kulma, A. & Gutowicz, J. Up-regulation of key glycolysis proteins in cancer development. Open Life Sciences 13, 569-581 (2018). https://doi.org:doi:10.1515/biol-2018-0068
[6]. Goetzman, E. S. & Prochownik, E. V. The Role for Myc in Coordinating Glycolysis, Oxidative Phosphorylation, Glutaminolysis, and Fatty Acid Metabolism in Normal and Neoplastic Tissues. Front Endocrinol (Lausanne) 9, 129 (2018). https://doi.org:10.3389/fendo.2018.00129
[7]. Kung, C. P. & Weber, J. D. It's Getting Complicated-A Fresh Look at p53-MDM2-ARF Triangle in Tumorigenesis and Cancer Therapy. Front Cell Dev Biol 10, 818744 (2022). https://doi.org:10.3389/fcell.2022.818744
[8]. Nirala, B. K. et al. MYC regulates CSF1 expression via microRNA 17/20a to modulate tumor-associated macrophages in osteosarcoma. JCI insight 8 (2023).
[9]. Meškytė, E. M., Keskas, S. & Ciribilli, Y. MYC as a multifaceted regulator of tumor microenvironment leading to metastasis. International Journal of Molecular Sciences 21, 7710 (2020).
[10]. Ran, F. A. et al. Genome engineering using the CRISPR-Cas9 system. Nature Protocols 8, 2281-2308 (2013). https://doi.org:10.1038/nprot.2013.143