


1. Introduction
Since 1980, the global obesity rate has continued to rise, with obesity rates doubling in over 70 countries [1]. Essentially, obesity is the abnormal accumulation of excess fat [2]. It is a chronic condition and a risk factor for other chronic conditions in many other organ systems, which is associated with increased morbidity and mortality [3-4]. Actually, obesity is currently ranked as the fifth most common leading cause of death globally [5]. Sin and Sutherland [6] found that obesity could potentially increase the risk of asthma; Gardiner et al. [7] concluded that the higher the obesity rate in a country, the higher the COVID-19 mortality rate. Obesity can begin early in life during the preschool years, and once established, obesity is extremely difficult to reverse. Nowadays, childhood obesity has emerged as a significant public health challenge, with far-reaching implications for physical health, psychological well-being, and societal costs. Childhood obesity has reached epidemic levels in developed countries [8]. It could significantly impact children’s health [9]. Almost all researchers agree that prevention could be the key strategy for controlling the current epidemic of obesity [8]. Therefore, it is imperative to study the causes of childhood obesity so that countermeasures can be taken to decrease the obesity rate. This study focuses on childhood obesity rates in London, examining the temporal trends and spatial patterns across boroughs. By using data including poverty rates, sports participation rates, crime rates, and the number of looked-after children (LAC), this research aims to identify the possible contributing factors of childhood obesity. The study seeks to uncover relationships between these factors and obesity rates, providing a comprehensive perspective on the issue.
2. Literature review
The body of research on childhood obesity causes is strong since the relationship between obesity and mental health has been studied for several decades [10]. For example, Cole [11] explored the early causes of childhood obesity, with a particular focus on how fetal and infant growth patterns affect future obesity risk; Zilanawala et al. [12] used multiple regression analysis to investigate the relationship between ethnicity and obesity while controlling for the influence of socioeconomic and cultural factors; Hoffman et al. [13] focused on early-life undernutrition; an official report from the Scottish Government [14] emphasized the importance of improving diet quality and increasing physical activity; Kırmızıbekmez et al. [15] highlighted the significance of early screening for MC4R variants in obesity diagnosis; Ells et al. [9] concluded that the prevalence of severe obesity varied significantly by geography, ethnicity, and socioeconomic status, etc. However, there are still unanswered questions about how these factors interact and change over time and space in urban environments. There is space for localized observations and recommendations because little research has explicitly examined the influence of specific socioeconomic factors in London, like poverty, sports participation, crime, and LAC.
3. Research questions
While some previous studies have explored the possible contributing factors of childhood obesity, relatively limited research focuses on the specific dynamics within London, particularly regarding spatial and temporal variations and the impacts of different socioeconomic variables on childhood obesity rates. This study aims to address the following key questions:
What significant spatial and temporal patterns can be observed in childhood obesity rates across different boroughs and time periods in London?
Which socioeconomic factors may impact childhood obesity rates, and what is the degree of influence of these factors?
Do the effects of these factors vary across different times?
By addressing these questions, this research seeks to enhance understanding of childhood obesity in London, identify the key driving factors behind its development, and provide scientific evidence to support the formulation of more targeted public health policies.
4. Data
The raw data used in this research are listed in Table 1, including their period and data sources. During the data preprocessing, this research calculated the crime rate (per 1000 people) of each borough in London, and the rest of the data could be used directly in this research. Due to data availability, this study focused on analyzing data from three years: 2008, 2012, and 2016.
Table 1: Raw data and data sources
Raw data | Period | Data source |
Childhood obesity rate | 2006-2019 | Prevalence of Childhood Obesity, Borough, Ward and MSOA - London Datastore |
Children’s poverty rate | 2006-2016 | Children in Poverty, Borough and Ward - London Datastore |
Sports participation rate | 2006-2016 | Sports Participation Rates, Borough - London Datastore |
Recorded crime | 2010-2024 | MPS Recorded Crime: Geographic Breakdown - London Datastore |
Children looked after (LAC) | 2005-2019 | Children Looked After, Borough – London Datastore |
Statistical GIS Boundary for London | / | Statistical GIS Boundary Files for London - London Datastore |
5. Methodology
5.1. The calculation of crime rate
The recorded crime data includes the number of crime incidents of each crime type of each month of each borough in London. To calculate the crime rate of each borough in a specific year, this study used Equation 1:
\( Crime rate (per 1000 people)= \frac{Total number of crime incidents}{Population}×1000 \) | (1) |
5.2. Multiple linear regression
This study used a multiple linear regression model to explore the impact of each factor on childhood obesity rates. The model can be represented as:
\( y={β_{0}}+{β_{1}}{x_{1}}+{β_{2}}{x_{2}}+…+{β_{p}}{x_{p}}+ϵ \) | (2) |
In this research, there are four different factors, so the model is adapted as:
\( y={β_{0}}+{β_{1}}{x_{1}}+{β_{2}}{x_{2}}+{β_{3}}{x_{3}}+{β_{3}}{x_{3}}+{β_{4}}{x_{4}}+ϵ \) | (3) |
Where y is the obesity rate, x1 to x4 represents the four factors: children’s poverty rate, sports participation rate, crime rate (per 1000 people), and children looked after (per 10000 children). β0 is the intercept, β1 to β4 represents the coefficient of each factor, and \( ϵ \) is the error term.
6. Results
6.1. Children's obesity rate
With emphasis on children in the "reception" (ages 4-5) and "year 6" (ages 10-11) phases, Figure 1 shows the trends in the average childhood obesity rates of London boroughs between 2008 and 2018. While the obesity rate for "reception" is trending downward, the "year 6" rate is trending upward. And the p-values indicate that both trends are statistically significant.
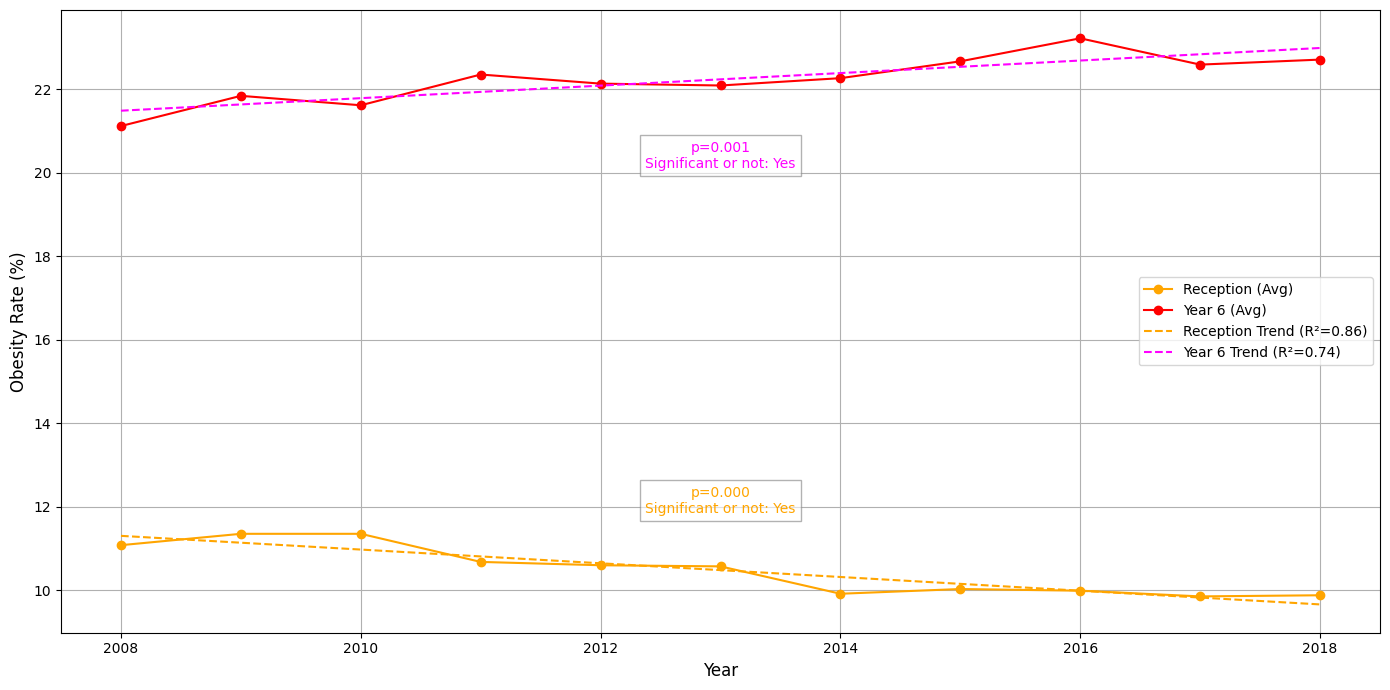
Figure 1: Obesity rate of reception and year 6 children
Figure 2 shows clear spatial patterns of childhood obesity rates for children in reception and year 6 across the boroughs of London. The central and northeastern boroughs initially had the highest obesity rates for children in reception, but these areas gradually improved, with fewer boroughs having high rates by 2016–2017. On the other hand, year 6 students continue to have high obesity rates, with the highest rates moving from the central and northeastern regions to the southeastern boroughs by 2016–2017. This draws attention to a widening geographic gap that is especially noticeable in eastern London, where year 6 obesity rates are still startlingly high when compared to children in reception.
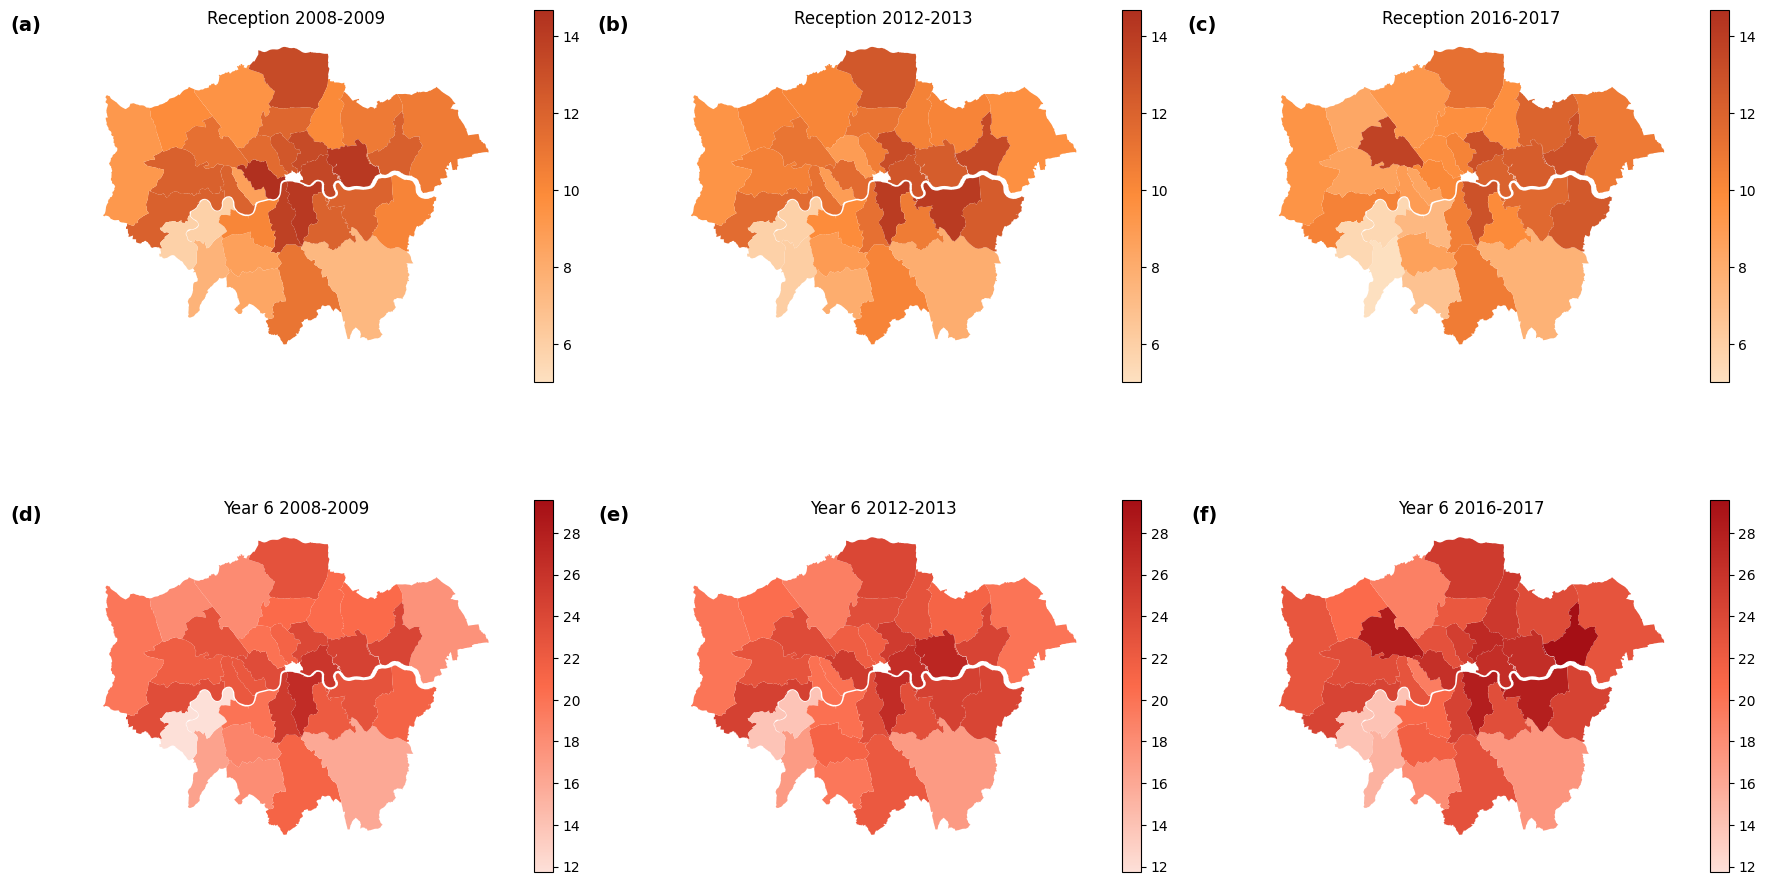
Figure 2: Spatial and temporal patterns of children’s obesity rate (%) in London
6.2. Possible driving factors
Section 6.1 notices that the obesity of year 6 children increased rapidly, so it is essential to explore the possible driving factors. Figure 3 examines the connections between year 6 obesity rates in 2008, 2012, and 2016 and different socioeconomic and demographic characteristics.
Obesity rates and child poverty rates are strongly positively correlated, as shown in Figure 3(a). R2 represents the proportion of variance in the dependent variable that is explained by the independent variable. A higher R2 value indicates that the regression model explains a greater proportion of the variance in the dependent variable. The greater slope of the 2016 regression line indicates that obesity rates are consistently higher in regions with higher child poverty, and this association seems to get stronger over time. According to the R2 values, variations in obesity rates are highly explained by poverty rates. Figure 3(b) illustrates the connection between childhood obesity and adult inactivity rates (no sport rate). Although there is a positive link, it is not as strong as it would be in poverty. This suggests that although the explanatory power of this factor is relatively limited, areas with more excellent childhood obesity rates may also have higher rates of adult inactivity. The association between obesity and crime rates for 2012 and 2016 is examined in Figure 3(c). Regression lines are less steep, though, and the R2 values are modest, suggesting that crime rates alone have little effect on childhood obesity. Figure 3(d) investigates the connection between obesity trends and the number of Looked After Children (LAC). All three years show a continuous positive correlation, with higher rates of childhood obesity being correlated with higher rates of LAC. The slopes and R2 values grow with time, suggesting this link gets more potent. According to the research, although the relationship is not strong enough, areas with a large LAC population may experience systemic issues that raise obesity rates.
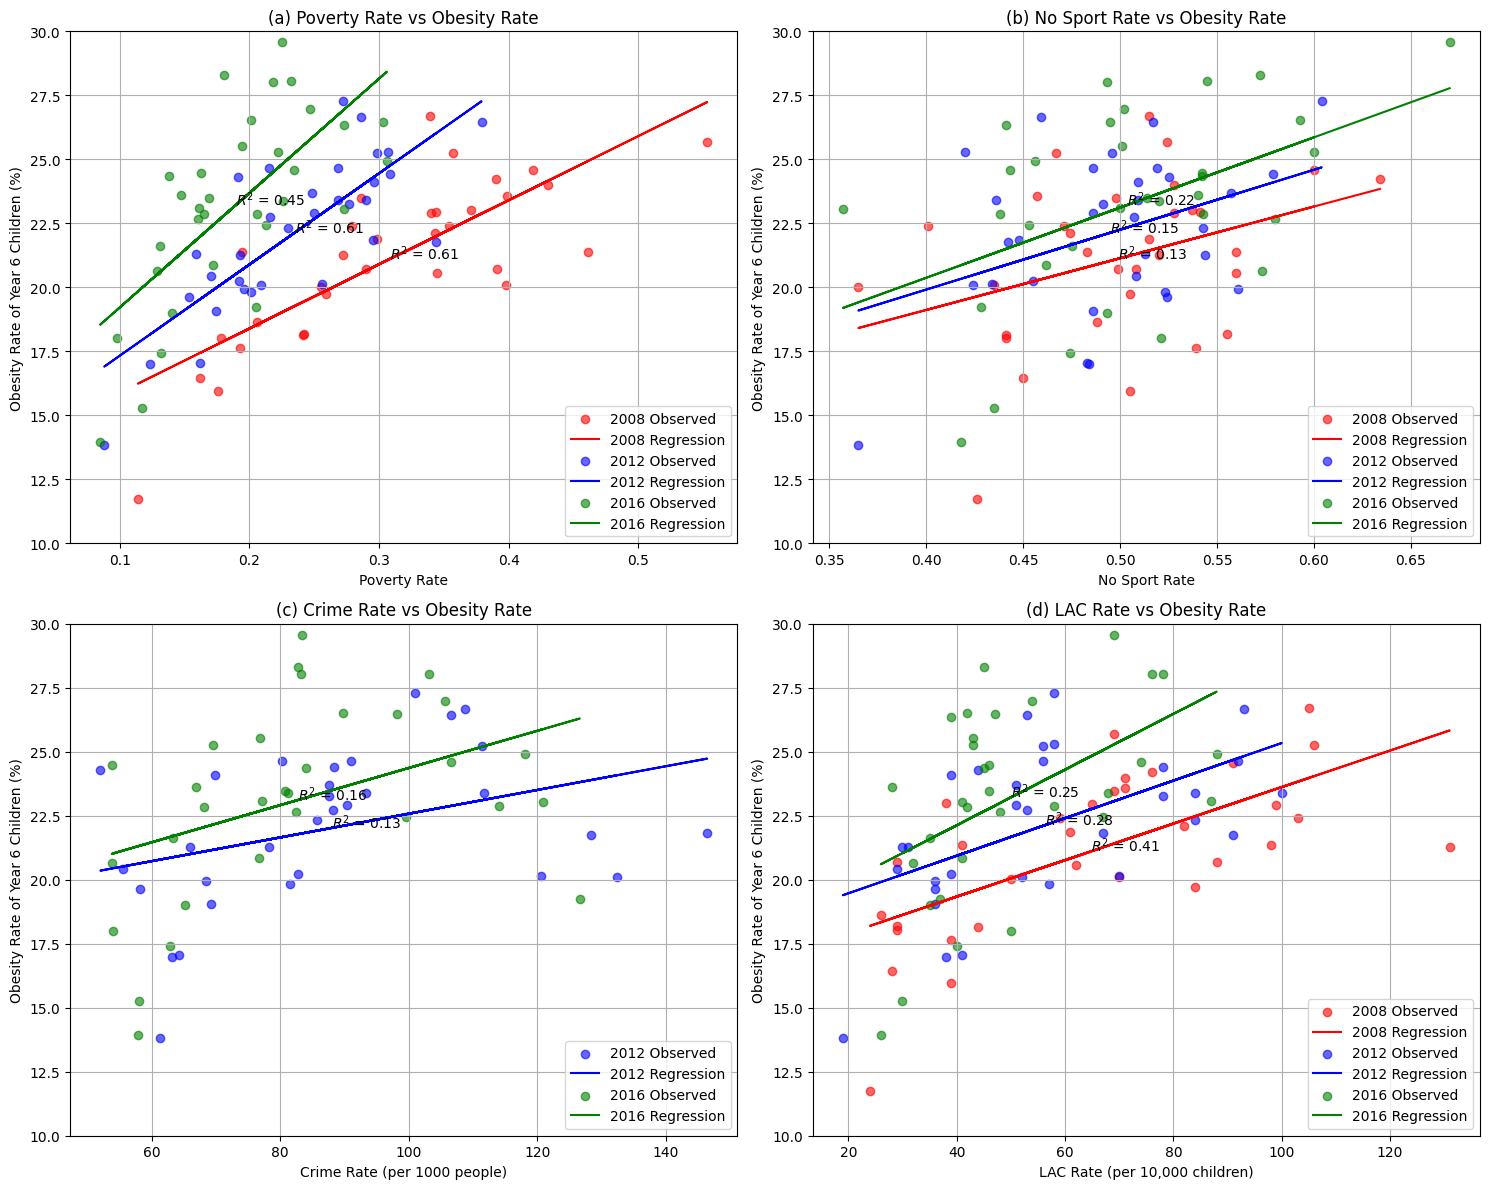
Figure 3: Possible driving factors of children’s obesity rate
6.3. The weight of each contributing factor
Due to the lack of crime rate data in 2008, this section uses the data from 2012 and 2016 to conduct multiple linear regression analyses. After conducting VIF and multicollinearity tests, the correlation matrixes of the four variables are constructed, as seen in Figure 4.
Figures 4(a) and 4(b) display the correlations for 2012 and 2016, respectively. Crime and poverty rates continuously correlate positively in both years (0.55 in 2012 and 0.73 in 2016). Furthermore, a positive association exists between poverty and LAC rates (0.68 in 2012, 0.50 in 2016). On the other hand, there aren't many significant associations between no sport rate and other variables in either year.
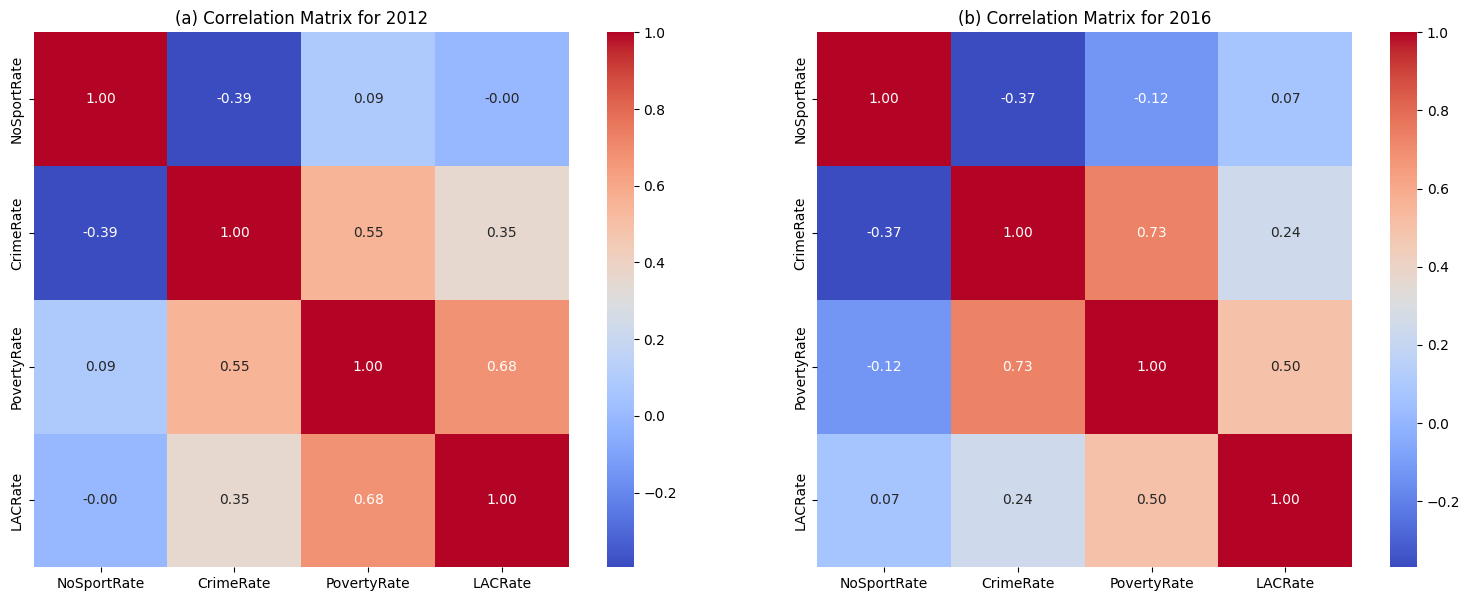
Figure 4: Correlation matrixes of four variables (2012, 2016)
Table 2 shows the findings of linear regression studies for 2016 and 2012, emphasizing the connections between the obesity rate and the four factors. With significant coefficients and p-values below 0.05, the no sport and poverty rates show notable effects in both years (e.g., 34.65 and 36.57 in 2016, 24.04 and 28.23 in 2012, respectively). In contrast, the higher p-values for the crime rate and LAC rate indicate that they have little influence and are not statistically significant. The confidence intervals show more uncertainty for variables with more significant coefficients, especially the poverty rate. The findings highlight the persistent significance of the poverty and no sport rates in predicting the obesity rate in both years.
Table 2: The results of multiple linear regression
Year | Variable | Coefficient | Std Err | t-value | P-Value | CI Lower | CI Upper |
2016 | const | -4.5991 | 3.3820 | -1.3599 | 0.1851 | -11.5383 | 2.3402 |
2016 | No sport rate | 34.6543 | 5.7449 | 6.0322 | 0.0000 | 22.8667 | 46.4419 |
2016 | crime rate | 0.0230 | 0.0186 | 1.2357 | 0.2272 | -0.0152 | 0.0611 |
2016 | poverty rate | 36.5719 | 10.0198 | 3.6500 | 0.0011 | 16.0131 | 57.1308 |
2016 | LAC rate | 0.0289 | 0.0232 | 1.2465 | 0.2233 | -0.0187 | 0.0764 |
2012 | const | 2.0363 | 3.6938 | 0.5513 | 0.5860 | -5.5427 | 9.6153 |
2012 | no sport rate | 24.0430 | 7.1464 | 3.3644 | 0.0023 | 9.3798 | 38.7061 |
2012 | crime rate | 0.0123 | 0.0106 | 1.1605 | 0.2560 | -0.0095 | 0.0341 |
2012 | poverty rate | 28.2317 | 7.5654 | 3.7317 | 0.0009 | 12.7089 | 43.7545 |
2012 | LAC rate | 0.0073 | 0.0191 | 0.3798 | 0.7070 | -0.0319 | 0.0465 |
The residual diagnostics for the multiple linear regression models from 2012 and 2016 are shown in Figure 5. The residuals are dispersed randomly about the zero line in the residuals vs. fitted plots for both years, demonstrating that the assumptions of linearity and homoscedasticity are satisfied. Although a small amount of skewness indicates tiny departures from normalcy, the residual histograms are generally centered around zero. With only slight variations seen at the tails, the Q-Q plots demonstrate that the residuals closely resemble the theoretical normal distribution. With very minor deviations from normalcy, the diagnostic plots indicate that the regression models for both years generally meet the requirements of linear regression.
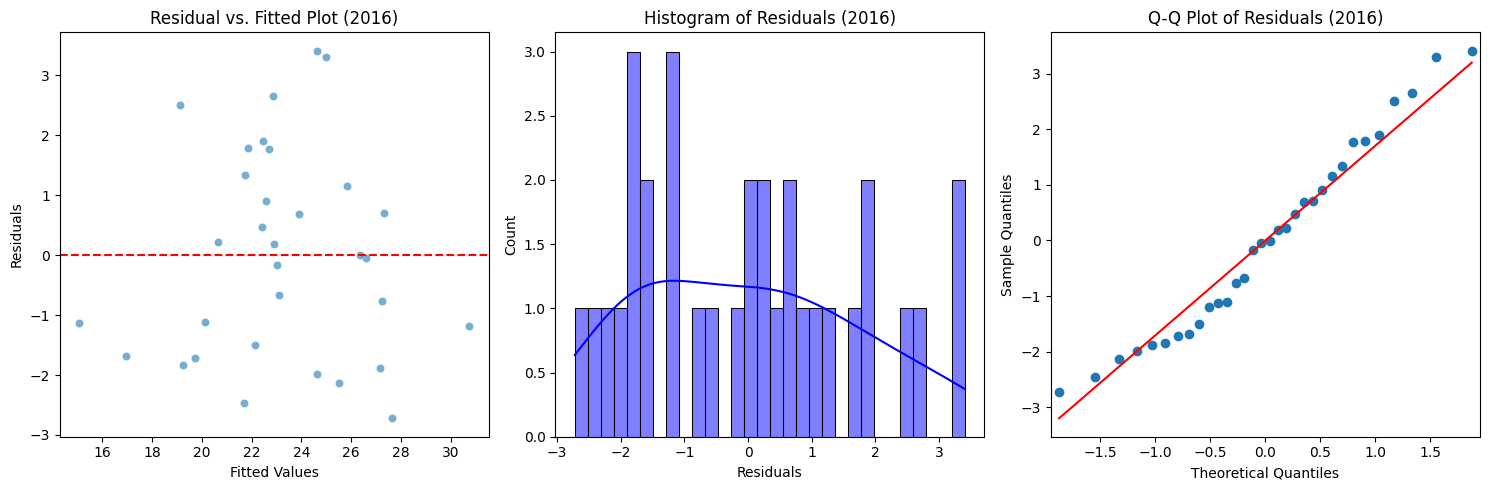
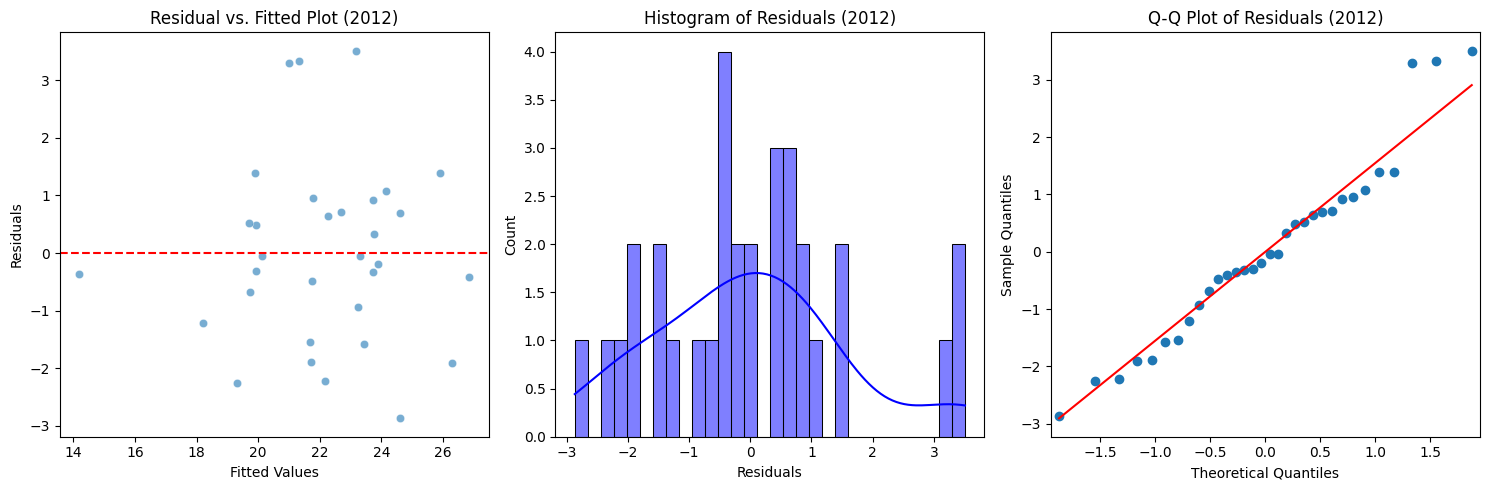
Figure 5: Residual diagnostics for the multiple linear regression models
7. Discussion
The results show distinct changes in London's childhood obesity rates over time and space, with notable differences between reception and year 6 students. While the persisting and rising rates among year 6 children show crucial areas requiring targeted interventions, the declining trend in reception obesity rates suggests some effectiveness with early intervention measures.
The multiple linear regression analysis findings shed important light on the variables affecting the prevalence of childhood obesity. Poverty rates showed the strongest positive correlation with obesity rates among the variables considered, which highlights the structural issues that low-income children confront. Also, a lack of physical activity options may make obesity risks worse. Indirectly measured by adult inactivity rates, sports participation rates seem to have an influence, though not as much as poverty rates. This implies that reducing socioeconomic disparities is still crucial, even when promoting physical exercise, which may help reduce obesity. Interestingly, the regression analysis showed weaker and statistically negligible relationships between obesity rates, crime rates, and the number of looked-after children. Nonetheless, the persistently positive relationship between obesity and LAC rates suggests possible systemic problems in regions with sizable LAC populations that may require more research.
8. Conclusions
This study examined the regional and temporal dynamics of London's children's obesity rates and the impact of different socioeconomic factors. The results, which show a complex interaction of variables, show that poverty rates are the most reliable indicator of obesity across many years. While adult inactivity and sports participation have a notable but lesser impact, crime and LAC rates demonstrate weaker associations. The result emphasizes the crucial role of poverty as a fundamental element of public health initiatives to lower childhood obesity. Targeted interventions could help children achieve healthier outcomes and close the observed geographic gaps, especially in high-risk areas like eastern London boroughs.
Limitations like data availability and omitting other potentially impacting factors (e.g., dietary habits or cultural norms) provide opportunities for future research. These results from this research may serve as the foundation for all-encompassing, just, and long-lasting policies to reduce childhood obesity in London.
References
[1]. Gadde, K.M. et al. (2018) ‘Obesity’, Journal of the American College of Cardiology, 71(1), pp. 69–84. Available at: https://doi.org/10.1016/j.jacc.2017.11.011.
[2]. Dhurandhar, N.V. (2022) ‘What is obesity?: Obesity Musings’, International Journal of Obesity, 46(6), pp. 1081–1082. Available at: https://doi.org/10.1038/s41366-022-01088-1.
[3]. Gilden, A.H., Catenacci, V.A. and Taormina, J.M. (2024) ‘Obesity’, Annals of Internal Medicine, 177(5), pp. ITC65–ITC80. Available at: https://doi.org/10.7326/AITC202405210.
[4]. Sarma, S., Sockalingam, S. and Dash, S. (2021) ‘Obesity as a multisystem disease: Trends in obesity rates and obesity‐related complications’, Diabetes, Obesity and Metabolism, 23(S1), pp. 3–16. Available at: https://doi.org/10.1111/dom.14290.
[5]. Safaei, M. et al. (2021) ‘A systematic literature review on obesity: Understanding the causes & consequences of obesity and reviewing various machine learning approaches used to predict obesity’, Computers in Biology and Medicine, 136, p. 104754. Available at: https://doi.org/10.1016/j.compbiomed.2021.104754.
[6]. Sin, D.D. and Sutherland, E.R. (2008) ‘Obesity and the lung: 4 · Obesity and asthma’, Thorax, 63(11), pp. 1018–1023. Available at: https://doi.org/10.1136/thx.2007.086819.
[7]. Gardiner, J., Oben, J. and Sutcliffe, A. (2021) ‘Obesity as a driver of international differences in COVID ‐19 death rates’, Diabetes, Obesity and Metabolism, 23(7), pp. 1463–1470. Available at: https://doi.org/10.1111/dom.14357.
[8]. Dehghan, M., Akhtar-Danesh, N. and Merchant, A.T. (2005) ‘Childhood obesity, prevalence and prevention’, Nutrition Journal, 4(1), p. 24. Available at: https://doi.org/10.1186/1475-2891-4-24.
[9]. Ells, L.J. et al. (2015) ‘Prevalence of severe childhood obesity in England: 2006–2013’, Archives of Disease in Childhood, 100(7), pp. 631–636. Available at: https://doi.org/10.1136/archdischild-2014-307036.
[10]. Steptoe, A. and Frank, P. (2023) ‘Obesity and psychological distress’, Philosophical Transactions of the Royal Society B: Biological Sciences, 378(1888), p. 20220225. Available at: https://doi.org/10.1098/rstb.2022.0225.
[11]. Cole, T.J. and Lobstein, T. (2023) ‘An improved algorithm to harmonize child overweight and obesity prevalence rates’, Pediatric Obesity, 18(1), p. e12970. Available at: https://doi.org/10.1111/ijpo.12970.
[12]. Zilanawala, A. et al. (2015) ‘Race/ethnic disparities in early childhood BMI, obesity and overweight in the United Kingdom and United States’, International Journal of Obesity, 39(3), pp. 520–529. Available at: https://doi.org/10.1038/ijo.2014.171.
[13]. Hoffman, D.J. et al. (2000) ‘Why are nutritionally stunted children at increased risk of obesity? Studies of metabolic rate and fat oxidation in shantytown children from São Paulo, Brazil’, The American Journal of Clinical Nutrition, 72(3), pp. 702–707. Available at: https://doi.org/10.1093/ajcn/72.3.702.
[14]. ‘Obesity Indicators: Monitoring Progress for the Prevention of Obesity Route Map’ (2017). Available at: https://dera.ioe.ac.uk/id/eprint/30529/1/00527553.pdf.
[15]. Kırmızıbekmez, H. et al. (2022) ‘Familial early-onset obesity in Turkish children: variants and polymorphisms in the melanocortin-4 receptor (MC4R) gene’, Journal of Pediatric Endocrinology and Metabolism, 35(5), pp. 657–662. Available at: https://doi.org/10.1515/jpem-2021-0756.
Cite this article
Fei,Y. (2025). Understanding Childhood Obesity in London: A Multi-Factor Analysis of Key Determinants. Theoretical and Natural Science,99,43-50.
Data availability
The datasets used and/or analyzed during the current study will be available from the authors upon reasonable request.
Disclaimer/Publisher's Note
The statements, opinions and data contained in all publications are solely those of the individual author(s) and contributor(s) and not of EWA Publishing and/or the editor(s). EWA Publishing and/or the editor(s) disclaim responsibility for any injury to people or property resulting from any ideas, methods, instructions or products referred to in the content.
About volume
Volume title: Proceedings of the 5th International Conference on Biological Engineering and Medical Science
© 2024 by the author(s). Licensee EWA Publishing, Oxford, UK. This article is an open access article distributed under the terms and
conditions of the Creative Commons Attribution (CC BY) license. Authors who
publish this series agree to the following terms:
1. Authors retain copyright and grant the series right of first publication with the work simultaneously licensed under a Creative Commons
Attribution License that allows others to share the work with an acknowledgment of the work's authorship and initial publication in this
series.
2. Authors are able to enter into separate, additional contractual arrangements for the non-exclusive distribution of the series's published
version of the work (e.g., post it to an institutional repository or publish it in a book), with an acknowledgment of its initial
publication in this series.
3. Authors are permitted and encouraged to post their work online (e.g., in institutional repositories or on their website) prior to and
during the submission process, as it can lead to productive exchanges, as well as earlier and greater citation of published work (See
Open access policy for details).
References
[1]. Gadde, K.M. et al. (2018) ‘Obesity’, Journal of the American College of Cardiology, 71(1), pp. 69–84. Available at: https://doi.org/10.1016/j.jacc.2017.11.011.
[2]. Dhurandhar, N.V. (2022) ‘What is obesity?: Obesity Musings’, International Journal of Obesity, 46(6), pp. 1081–1082. Available at: https://doi.org/10.1038/s41366-022-01088-1.
[3]. Gilden, A.H., Catenacci, V.A. and Taormina, J.M. (2024) ‘Obesity’, Annals of Internal Medicine, 177(5), pp. ITC65–ITC80. Available at: https://doi.org/10.7326/AITC202405210.
[4]. Sarma, S., Sockalingam, S. and Dash, S. (2021) ‘Obesity as a multisystem disease: Trends in obesity rates and obesity‐related complications’, Diabetes, Obesity and Metabolism, 23(S1), pp. 3–16. Available at: https://doi.org/10.1111/dom.14290.
[5]. Safaei, M. et al. (2021) ‘A systematic literature review on obesity: Understanding the causes & consequences of obesity and reviewing various machine learning approaches used to predict obesity’, Computers in Biology and Medicine, 136, p. 104754. Available at: https://doi.org/10.1016/j.compbiomed.2021.104754.
[6]. Sin, D.D. and Sutherland, E.R. (2008) ‘Obesity and the lung: 4 · Obesity and asthma’, Thorax, 63(11), pp. 1018–1023. Available at: https://doi.org/10.1136/thx.2007.086819.
[7]. Gardiner, J., Oben, J. and Sutcliffe, A. (2021) ‘Obesity as a driver of international differences in COVID ‐19 death rates’, Diabetes, Obesity and Metabolism, 23(7), pp. 1463–1470. Available at: https://doi.org/10.1111/dom.14357.
[8]. Dehghan, M., Akhtar-Danesh, N. and Merchant, A.T. (2005) ‘Childhood obesity, prevalence and prevention’, Nutrition Journal, 4(1), p. 24. Available at: https://doi.org/10.1186/1475-2891-4-24.
[9]. Ells, L.J. et al. (2015) ‘Prevalence of severe childhood obesity in England: 2006–2013’, Archives of Disease in Childhood, 100(7), pp. 631–636. Available at: https://doi.org/10.1136/archdischild-2014-307036.
[10]. Steptoe, A. and Frank, P. (2023) ‘Obesity and psychological distress’, Philosophical Transactions of the Royal Society B: Biological Sciences, 378(1888), p. 20220225. Available at: https://doi.org/10.1098/rstb.2022.0225.
[11]. Cole, T.J. and Lobstein, T. (2023) ‘An improved algorithm to harmonize child overweight and obesity prevalence rates’, Pediatric Obesity, 18(1), p. e12970. Available at: https://doi.org/10.1111/ijpo.12970.
[12]. Zilanawala, A. et al. (2015) ‘Race/ethnic disparities in early childhood BMI, obesity and overweight in the United Kingdom and United States’, International Journal of Obesity, 39(3), pp. 520–529. Available at: https://doi.org/10.1038/ijo.2014.171.
[13]. Hoffman, D.J. et al. (2000) ‘Why are nutritionally stunted children at increased risk of obesity? Studies of metabolic rate and fat oxidation in shantytown children from São Paulo, Brazil’, The American Journal of Clinical Nutrition, 72(3), pp. 702–707. Available at: https://doi.org/10.1093/ajcn/72.3.702.
[14]. ‘Obesity Indicators: Monitoring Progress for the Prevention of Obesity Route Map’ (2017). Available at: https://dera.ioe.ac.uk/id/eprint/30529/1/00527553.pdf.
[15]. Kırmızıbekmez, H. et al. (2022) ‘Familial early-onset obesity in Turkish children: variants and polymorphisms in the melanocortin-4 receptor (MC4R) gene’, Journal of Pediatric Endocrinology and Metabolism, 35(5), pp. 657–662. Available at: https://doi.org/10.1515/jpem-2021-0756.