


1. Introduction
In modern society, people pay more and more attention to environmental protection, sustainable development, and health [1]. More and more people use shared bicycles in their lives, whether as a means of transportation or as a hobby. Shared bicycle stations appear more and more frequently in our vision. They can be rented and returned at any time, which has become one of the reasons why shared bicycles are so popular. For example, in May 2013, New York City launched the largest bicycle sharing system in North America, the Citi Bike system, with more than 300 stations and 5,000 bicycles. The passenger flow of such a large, shared bicycle system has reached nearly 40,000 people per day [2]. Such a large passenger flow will inevitably bring certain problems. One of the more serious problems is the setting of shared bicycle stations. Many people need to rent bicycles, but there are no stations nearby, or there are bicycles in short supply in some places, while bicycles are piled up in other places, but no one needs to use them. In the second case, it also has a negative impact on the economy of shared bicycle companies. This requires optimizing the setting of stations to improve the problem.
2. Literature review
In 2011, Hamidreza Sayarshad, Sepideh Tavassoli, and Fang Zhao used the proposed optimization formula to design a shared bicycle system, striving for the smallest bicycle fleet to optimize and meet the maximum demand, mainly for travel within a small community. The research conclusions were proven to be successful in analyzing and improving the utilization rate of bicycles [3]. To further improve the efficiency of shared bicycles, in 2012, Juan P. Romero, Angel Ibeas, Jose L. Moura, Juan Benavente and Borja Alonso linked shared bicycles with private cars and proposed a method to model the traffic modes of both at the same time. The connection between the two was reflected by modeling the mode division and allocating network trips for each mode, and the layout of shared bicycle stations was optimized. Further higher efficiency and utilization were achieved [4]. In 2014, Edoardo Croci and Davide Rossi focused on studying and analyzing Milan’s shared bicycle system (BikeMi) based on the overall theory to improve the efficiency of shared bicycle systems. They first studied the factors that affect the use of shared bicycle stations, including the different effects of proximity, visibility and attractiveness. They concluded that the demand for use will increase in certain types of locations such as cinemas and subway stations. This conclusion can better assist in finding the location of the optimal shared bicycle station in Milan [5]. In 2015, with the development of the shared bicycle system, an imbalance in shared bicycles emerged. Eoin O’Mahony and David B. Shmoys mainly corrected this imbalance so that the system reached the necessary level of bicycles at each station and used mathematical modeling to allow shared bicycles to rebalance the system at night to cope with peak hours [2]. In 2018, Suleyman Mete, Zeynel Abidin Cil, and Eren Özceylan optimized the shared bicycle system on the Ziantep University campus, looking for the best location for shared bicycle stations that minimize the total walking distance. The station locations obtained using mathematical models and methods covered all demand points and improved travel efficiency in the campus area [6]. In 2019, Zhihui Gu et al. used a heuristic optimization method (HBOA) to connect space and time to form a continuous bicycle chain, greatly improving the efficiency of the station-free shared bicycle system (BSS). Taking two large companies in Shenzhen as an example, the model was used to give a specific optimization plan for bicycle supply and demand [7]. The optimization plan for bicycles has gradually been implemented in specific real-world situations such as regions, campuses, and companies. As the shared bicycle system continues to mature, some problems have also emerged in the constant changes of the system. Zhuo Sun et al. mainly studied the free-flowing shared bicycle system (FFBSS). In combination with local government regulations, they used a mixed integer linear programming (MILP) model and clustering algorithm for optimization, solving the parking chaos problem while meeting user needs [8]. Yujie Hu et al. mainly referred to two types of data, bicycle historical travel data and shared bicycle station empty and full status data, for analysis and model design. They used a variety of methods to optimize the bicycle shared bicycle project in Boulder, Colorado, USA. The conclusion part proposed three upgraded system strategies to maximize service coverage, and the optimization of shared bicycle projects is also committed to energy conservation and emission reduction and sustainable energy systems [9]. The details of the shared bicycle system and the specific optimization of specific regions are constantly being improved bit by bit, while promoting future sustainable development and environmental protection. In 2022, Beigi et al. developed deterministic integer programming to optimize the layout of bicycle stations and balance the bicycle supply system. The formulated strategy will be prepared at night to meet the large demand during peak hours [1]. As time goes by, the optimization of the shared bicycle system is constantly changing, and it is constantly being improved based on actual conditions and historical experience.
3. Methodology
3.1. Establishing a grid model and simulating data
This paper mainly studies the optimization of shared bicycle stations in Manhattan. Start by setting up the mesh and simulation data. A grid model with a side length of \( 14×14 \) is established as shown in the Figure 1. below, and it is assumed that the side length of each grid is 1.
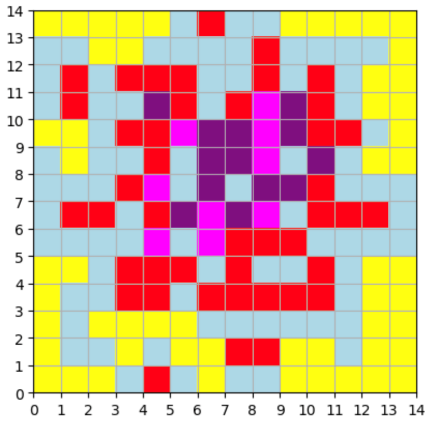
Figure 1: Color division simulates the city area grid
As shown in Figure 1, there are 5 different grid colors, representing different population densities and different areas, see Table 1.
Table 1: Regional color division and population density data
Region Color | Representative Area | Population Density person/ \( k{m^{2}} \) |
purple | commercial area | 4000 |
pink | residential area | 3500 |
red | scenic area | 3000 |
blue | industrial area | 2750 |
yellow | suburbs | 2500 |
3.2. Linear function method
After determining the simulated grid model, study the objective function. In real life, as a shared bicycle company, there are still many cost issues to consider, so the objective function is set to seek the minimum cost. The cost that directly affects the total cost can be divided into two parts: the cost of building a station and the service cost per kilometer of shared bicycles, and both are affected by different factors (weights). Considering that the cost of building a station varies from region to region, but the cost of building a shared bicycle station in the same region is the same, it is mainly affected by population density. In addition to being affected by population density, which causes different demands in different regions, the service cost is also affected by the distribution of bicycle lanes and the length of the distance. Based on this logic, as Table 2 shows the parameters and variables. And the objective function.
Table 2: Symbols meaning
Name | Description |
\( Z \) | total cost |
\( {d_{ij}} \) | the distance from the site placement location to grid (i, j) |
\( pd \) | population density |
\( {T_{ij}} \) | the length of the bicycle lane from the site location to grid (i, j) |
\( DC \) | cost per km of service |
\( S{C_{ij}} \) | construction of the site location Construction cost of a site |
Objective function:
\( min{(Z)}=\sum _{ i}\sum _{j }{d_{ij}}×(\frac{1}{pd})×(\frac{1}{{T_{ij}}})×DC+S{C_{ij}}×pd \)
After determining the objective function, the variable data of the grid (Figure 1.) is also simulated, as shown in Table 3:
Table 3: Regional color data
Grid Color | pd person/ \( k{m^{2}} \) | \( S{C_{ij}} \) dollar/set 1 | \( {T_{ij}} \) km/region | DC dollar/km |
purple | 4000 | 12500 | 40 | 1.5 |
pink | 3500 | 11000 | 35 | 1.2 |
red | 3000 | 10000 | 30 | 1 |
blue | 2750 | 9250 | 25 | 0.85 |
yellow | 2500 | 8500 | 20 | 0.75 |
In this case, three important points are explained. First, for the objective function, variables such as \( pd \) and \( {d_{ij}} \) are directly multiplied by \( DC \) or \( S{C_{ij}} \) in the objective function and are considered as weights according to the inverse relationship, so the optimal shared bicycle station location can be determined when the objective function is minimized. However, when the objective function is minimized, it is not the specific amount of the actual minimum cost. Second, the reason why different construction costs and service costs in different regions have been simulated when simulating numerical values, but the weight relationship of multiple variables must still be considered in the objective function. This is because in real life, there are differences in construction costs and service costs in different regions, but these variables will still affect changes in construction costs and service costs. Third, in the case of simulated grids, since the values have been simulated and determined, constraints are not considered in this case.
3.3. Optimal site placement
Write code to operate the model. First, calculate the optimal location for placing a shared bicycle station in the \( 14×14 \) colored grid, as shown in Figure 2:
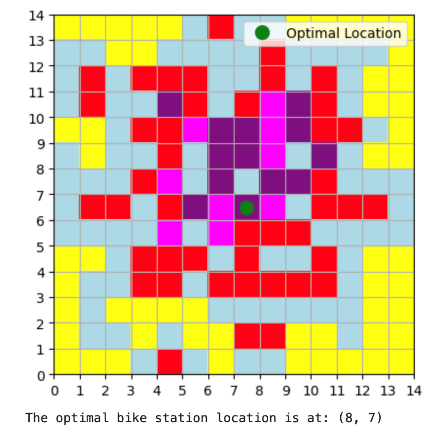
Figure 2: One optimal site delivery display
Figure 2 shows that the optimal location of the site is close to the center of the entire area, and the population density in the central area is also relatively high. Increase the number of deployment stations to two, then to four, and calculate the optimal deployment location of shared bicycle stations. The results are shown in Figure 3. and Figure 4:

Figure 3: Two optimal sites for delivery display

Figure 4: Five optimal sites for delivery display
Figure 3. shows that two optimal sites are placed, one in the upper middle of the area and the other in the lower middle. Overall, the distribution is relatively symmetrical, with one site distributed in the upper and lower parts. When five optimal sites are placed, Figure 4. shows that the five sites are in the middle and in the four corners around the middle site, and the overall distribution is also relatively symmetrical and uniform. This is related to the layout of factors such as the population density distribution in the region.
3.4. Optimal placement of stations in Manhattan
The population density during peak hours in Manhattan is selected, as shown in Figure 5, and the Manhattan map is divided into grids with a unit length of 1. The grid color of the area with a higher population density is lighter, as shown in Figure 6. The population density in Manhattan increases gradually from north to south. The distribution map of bicycle lanes is shown in Figure 7. The number of bike lanes in Manhattan is gradually increasing from north to south and becoming denser. Finally, the actual data of Manhattan is considered to limit the range of variables \( pd \) , \( DC \) , \( S{C_{ij}} \) and \( {T_{ij}} \) ,which is also a constraint condition. Combined with the actual situation, the constraints are as follows: population density ranges from US$3 per kilometer to US$8 per kilometer in the most expensive place, \( S{C_{ij}} \) ranges from US$70,000 to US$270,000 for building a station at the cheapest place, and the length of the bike path \( {T_{ij}} \) ranges from 8 kilometers in the shortest place to 80 kilometers in the longest place.
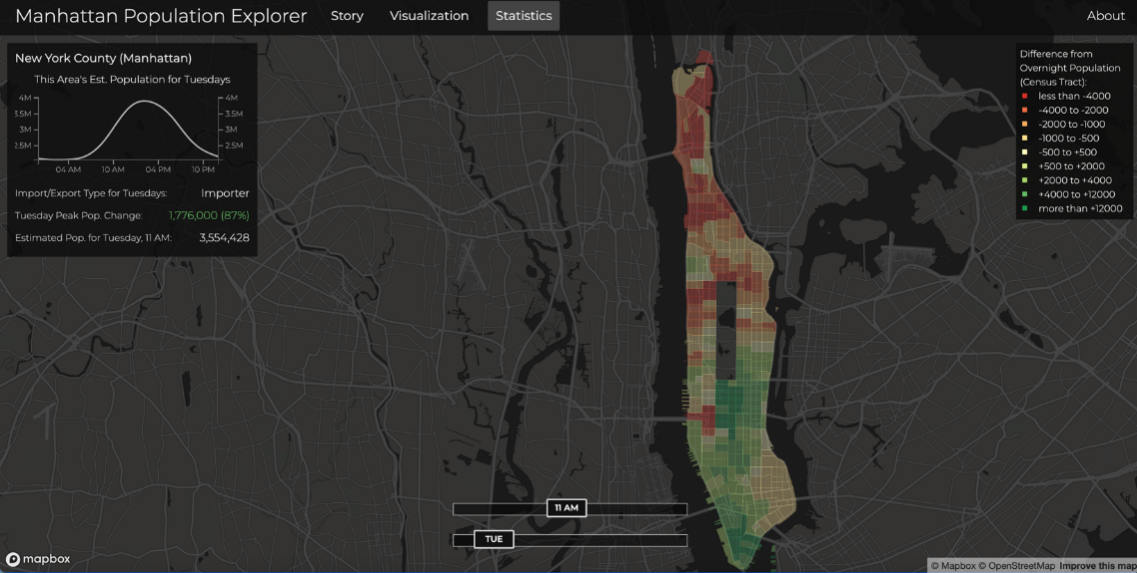
Figure 5: Manhattan peak hour population density [10]
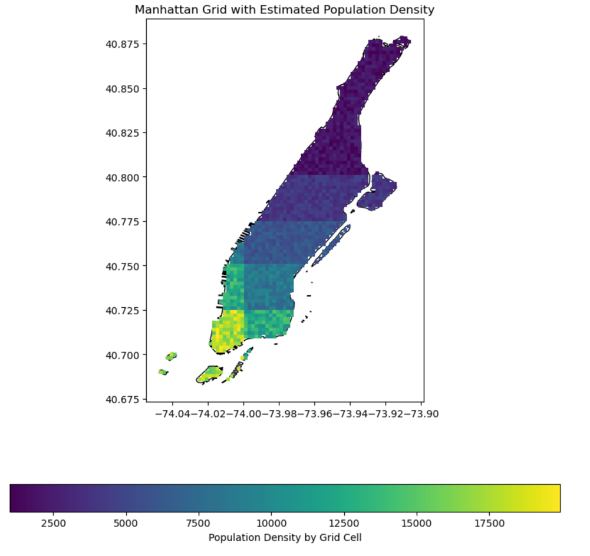
Figure 6: Manhattan grid with estimated population density
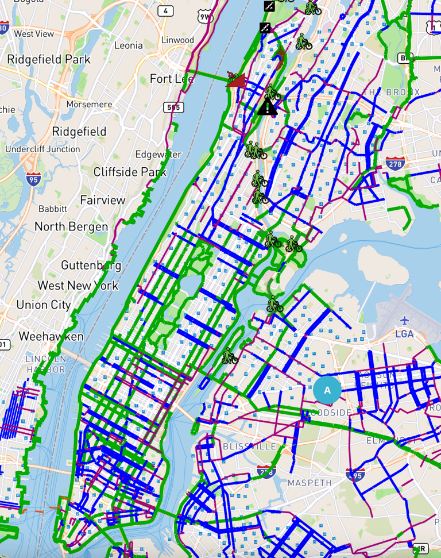
Figure 7: Bike lanes in Manhattan [11]
Because the more people there are, the greater the demand, the cheaper the service cost, but it also means that the land is more expensive, so the population density is inversely proportional to \( DC \) and directly proportional to \( S{C_{ij}} \) .Conversely, \( DC \) is also inversely proportional to population density, and \( S{C_{ij}} \) is also directly proportional to population density. The longer \( {T_{ij}} \) is, the higher the population density is, the greater the demand for shared bicycles, and the cheaper \( DC \) is, so \( {T_{ij}} \) is directly proportional to population density and inversely proportional to \( DC \) . This explains the inverse relationship in the objective function.
4. Results and analysis
4.1. Ten best sites in Manhattan
After the grid model and the objective function are established, the same logic used to calculate the optimal location solution in the grid model is used to build a model for the Manhattan area after the grid map is divided and the objective function is applied. A Python program is established to determine the impact of the objective function and variable factors. After running the Python program, the locations of the ten optimal Manhattan areas are displayed on the Manhattan map after the grid map is divided. At the same time, the Manhattan map also shows the distribution of population density, as shown in Figure 8.
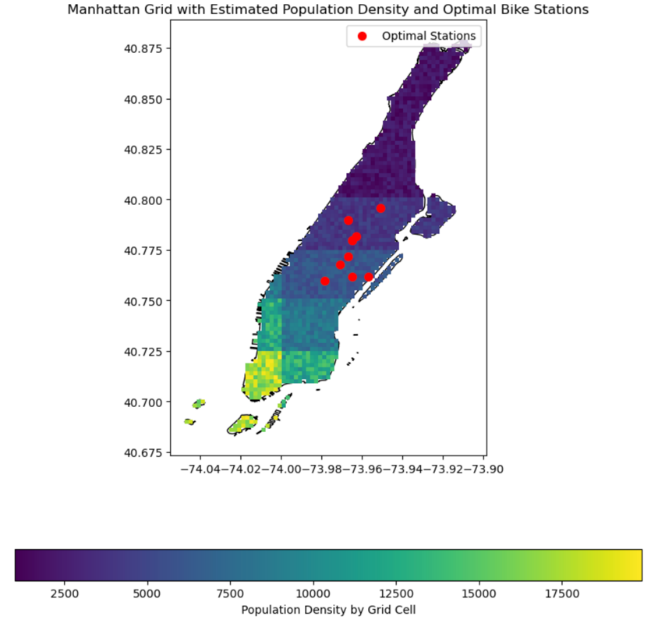
Figure 8: Ten best sites in Manhattan
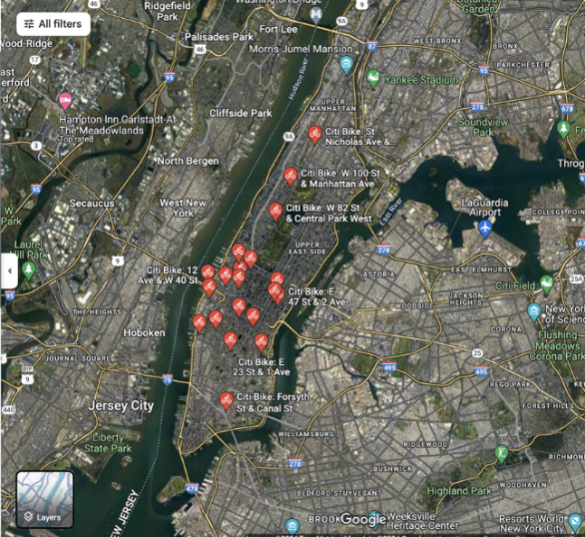
Figure 9: Site location shown on Google Map [12]
4.2. Analysis
Google Maps [12] shows the current locations of bike-sharing stations in Manhattan (Figure 9). Compared to the research model results, the actual locations of bike-sharing stations in Manhattan are lower and closer to Central Park. Most stations are located in Downtown Manhattan, which is home to some of the city’s most famous buildings and Manhattan tourist attractions, suggesting that these stations are more likely to be used for random leisure purposes [13]. With the exception of a few stations, the remaining stations are concentrated at the end of Central Park. The optimal location of bike-sharing stations in this study is closer to the middle of Manhattan, around Central Park. The station distribution is also closer to the right side of Manhattan than the actual location, roughly distributed in areas with a population density of 5,000 to 7,500 people per square kilometer. At the same time, in the edge areas of Manhattan, the optimal station location is shown as a station location on the right edge of the Manhattan area, which is different from the actual situation. However, neither the research results nor the actual situation puts bike-sharing stations in the upper areas of Manhattan, which are also low-density areas and far away from the city center.
5. Conclusion
In summary, this study calculated the optimal location of bike-sharing stations in Manhattan through a linear function, considering the economic benefits of bike-sharing companies. However, future research directions can consider more variables, such as time factors, geographical factors, climate factors, policy factors, etc. At the same time, the specific optimal cost amount can also be studied to continuously optimize and improve the efficiency of bike-sharing stations.
References
[1]. Beigi, Pedram, Khoueiry, Michel, Rajabi, Mohammad Sadra and Hamdar, Samer. (2022). Station Reallocation and Rebalancing Strategy for Bike-Sharing Systems: A Case Study of Washington DC [Unpublished master's thesis]. The George Washington University.
[2]. Eoin O’Mahony1, David B. Shmoys1,2. (2015). Data Analysis and Optimization for (Citi)Bike Sharing. https://file:///Users/lichenyi/Downloads/9245-Article%20Text-12773-1-2-20201228.pdf
[3]. Hamidreza Sayarshad, Sepideh Tavassoli, Fang Zhao. (2011). A multi-periodic optimization formulation for bike planning and bike utilization [Unpublished doctoral dissertation]. Mazandaran University, Azad University, Florida International University.
[4]. Juan P. Romero, Angel Ibeas, Jose L. Moura*, Juan Benavente, Borja Alonso. (2012). A simulation-optimization approach to design efficient systems of bike-sharing [Unpublished master's thesis]. University of Cantabria, Avenida Los Castros s/n, Santander 39005, Spain.
[5]. Edoardo Croci and Davide Rossi. (2014). Optimizing the position of bike sharing stations. The Milan case [Unpublished doctoral dissertation]. IEFE ‐ The Center for Research on Energy and Environmental Economics and Policy at Bocconi University.
[6]. Suleyman Mete, Zeynel Abidin Cil, Eren Özceylan. (2018). Location and Coverage Analysis of BikeSharing Stations in University Campus [Unpublished master's thesis]. Munzur University, Izmir Democracy University, Gaziantep University.
[7]. Zhihui Gu, Yong Zhu, Yan Zhang, Wanyu Zhou, Yu Chen. (2019). Heuristic Bike Optimization Algorithm to Improve Usage Efficiency of the Station-Free Bike Sharing System in Shenzhen, China [Unpublished doctoral dissertation]. College of Architecture and Urban Planning, Shenzhen University.
[8]. Zhuo Sun, Yiming Li, Yi Zuo. (2019). Optimizing the Location of Virtual Stations in Free-Floating Bike-Sharing Systems with the User Demand during Morning and Evening Rush Hours [Unpublished doctoral dissertation]. Dalian Maritime University.
[9]. Yujie Hu, Yongping Zhang, David Lamb, Mingming Zhang, Peng Jia. (2019). Examining and optimizing the BCycle bike-sharing system – A pilot study in Colorado, US [Unpublished doctoral dissertation]. University of South Florida, University College London, University of South Florida, Rice University, University of Twente.
[10]. (n.d.). Manhattan Population Explorer. https://manpopex.us/
[11]. Manhattan bike paths, bike lanes & Greenways. (n.d.). NYC Bike Maps | New York City Bicycle Maps. https://www.nycbikemaps.com/maps/manhattan-bike-map/
[12]. Manhattan shared bike station. (n.d.). Manhattan shared bike station. https://www.google.com/maps/search/manhattan+shared+bike+station/@40.7525516,-74.0257411,10686m/data=!3m2!1e3!4b1?entry=ttu
[13]. Yunzhe Liu, Daniel Arribas-Bel, Meixu Chen. (2021). Profiling the Dynamic Pattern of Bike-sharing Stations: a case study of Citi Bike in New York City [Unpublished doctoral dissertation]. University of Oxford, University of Liverpool.
Cite this article
Li,C. (2025). Optimization of Bike-Sharing Stations in Manhattan. Theoretical and Natural Science,107,41-49.
Data availability
The datasets used and/or analyzed during the current study will be available from the authors upon reasonable request.
Disclaimer/Publisher's Note
The statements, opinions and data contained in all publications are solely those of the individual author(s) and contributor(s) and not of EWA Publishing and/or the editor(s). EWA Publishing and/or the editor(s) disclaim responsibility for any injury to people or property resulting from any ideas, methods, instructions or products referred to in the content.
About volume
Volume title: Proceedings of the 4th International Conference on Computing Innovation and Applied Physics
© 2024 by the author(s). Licensee EWA Publishing, Oxford, UK. This article is an open access article distributed under the terms and
conditions of the Creative Commons Attribution (CC BY) license. Authors who
publish this series agree to the following terms:
1. Authors retain copyright and grant the series right of first publication with the work simultaneously licensed under a Creative Commons
Attribution License that allows others to share the work with an acknowledgment of the work's authorship and initial publication in this
series.
2. Authors are able to enter into separate, additional contractual arrangements for the non-exclusive distribution of the series's published
version of the work (e.g., post it to an institutional repository or publish it in a book), with an acknowledgment of its initial
publication in this series.
3. Authors are permitted and encouraged to post their work online (e.g., in institutional repositories or on their website) prior to and
during the submission process, as it can lead to productive exchanges, as well as earlier and greater citation of published work (See
Open access policy for details).
References
[1]. Beigi, Pedram, Khoueiry, Michel, Rajabi, Mohammad Sadra and Hamdar, Samer. (2022). Station Reallocation and Rebalancing Strategy for Bike-Sharing Systems: A Case Study of Washington DC [Unpublished master's thesis]. The George Washington University.
[2]. Eoin O’Mahony1, David B. Shmoys1,2. (2015). Data Analysis and Optimization for (Citi)Bike Sharing. https://file:///Users/lichenyi/Downloads/9245-Article%20Text-12773-1-2-20201228.pdf
[3]. Hamidreza Sayarshad, Sepideh Tavassoli, Fang Zhao. (2011). A multi-periodic optimization formulation for bike planning and bike utilization [Unpublished doctoral dissertation]. Mazandaran University, Azad University, Florida International University.
[4]. Juan P. Romero, Angel Ibeas, Jose L. Moura*, Juan Benavente, Borja Alonso. (2012). A simulation-optimization approach to design efficient systems of bike-sharing [Unpublished master's thesis]. University of Cantabria, Avenida Los Castros s/n, Santander 39005, Spain.
[5]. Edoardo Croci and Davide Rossi. (2014). Optimizing the position of bike sharing stations. The Milan case [Unpublished doctoral dissertation]. IEFE ‐ The Center for Research on Energy and Environmental Economics and Policy at Bocconi University.
[6]. Suleyman Mete, Zeynel Abidin Cil, Eren Özceylan. (2018). Location and Coverage Analysis of BikeSharing Stations in University Campus [Unpublished master's thesis]. Munzur University, Izmir Democracy University, Gaziantep University.
[7]. Zhihui Gu, Yong Zhu, Yan Zhang, Wanyu Zhou, Yu Chen. (2019). Heuristic Bike Optimization Algorithm to Improve Usage Efficiency of the Station-Free Bike Sharing System in Shenzhen, China [Unpublished doctoral dissertation]. College of Architecture and Urban Planning, Shenzhen University.
[8]. Zhuo Sun, Yiming Li, Yi Zuo. (2019). Optimizing the Location of Virtual Stations in Free-Floating Bike-Sharing Systems with the User Demand during Morning and Evening Rush Hours [Unpublished doctoral dissertation]. Dalian Maritime University.
[9]. Yujie Hu, Yongping Zhang, David Lamb, Mingming Zhang, Peng Jia. (2019). Examining and optimizing the BCycle bike-sharing system – A pilot study in Colorado, US [Unpublished doctoral dissertation]. University of South Florida, University College London, University of South Florida, Rice University, University of Twente.
[10]. (n.d.). Manhattan Population Explorer. https://manpopex.us/
[11]. Manhattan bike paths, bike lanes & Greenways. (n.d.). NYC Bike Maps | New York City Bicycle Maps. https://www.nycbikemaps.com/maps/manhattan-bike-map/
[12]. Manhattan shared bike station. (n.d.). Manhattan shared bike station. https://www.google.com/maps/search/manhattan+shared+bike+station/@40.7525516,-74.0257411,10686m/data=!3m2!1e3!4b1?entry=ttu
[13]. Yunzhe Liu, Daniel Arribas-Bel, Meixu Chen. (2021). Profiling the Dynamic Pattern of Bike-sharing Stations: a case study of Citi Bike in New York City [Unpublished doctoral dissertation]. University of Oxford, University of Liverpool.