


1. Introduction
The Olympic Games, as the world’s largest and most influential sporting event, bring together top athletes from across the globe to compete at the highest level. The distribution of Olympic medals not only reflects a nation’s investment in sports development, resource allocation strategies, and athletic capabilities, but also mirrors the evolving dynamics of global competitiveness in sports [1–2]. As highlighted by the results of the 2024 Paris Olympics, the United States topped the medal tally with 126 medals, while both the United States and China shared the lead in gold medals, each winning 40. The host nation, France, ranked fifth with 16 gold medals. Moreover, countries such as Albania, Cape Verde, Dominica, and Saint Lucia earned their first-ever Olympic medals—an achievement that underscores the rising prominence of smaller nations in the global sports arena. These developments offer valuable data and motivation for analyzing and forecasting future Olympic medal distributions.
Forecasting based on socio-economic indicators has a long-standing tradition in academic research, particularly within the social sciences. Historically, such predictions have informed public policy and program planning by helping avoid adverse outcomes that could limit national development. This approach has been widely applied in fields such as economics, public health, civil engineering, ecology, and urban planning. Within the realm of sports economics, predicting Olympic performance—typically through medal forecasts—has garnered significant scholarly attention in recent decades. For governments that invest heavily in elite athlete training programs, such forecasts serve as benchmarks to evaluate the return on investment and guide future funding decisions. Accurate medal predictions can also shape national pride and promote public engagement in sports, which may lead to broader social benefits such as reduced healthcare costs.
Despite the relevance of traditional forecasting methods—which rely on historical trends, economic indicators, and the host country advantage—these approaches often fall short in capturing the complex, data-driven factors underpinning Olympic success. In recent years, advancements in machine learning and time-series forecasting have enabled more precise, scalable, and interpretable models for predicting medal outcomes [3-5].
In this context, our study aims to develop a comprehensive data-driven framework for predicting medal distributions at the 2028 Los Angeles Olympics. We leverage historical medal data, event counts, and the host country effect while systematically analyzing the key variables influencing medal shifts. Specifically, we propose an innovative national competitiveness evaluation framework that quantifies athletic strength through a weighted scoring mechanism, forming the foundation of our prediction model. By applying K-means clustering, we classify countries based on core attributes, thereby enhancing model interpretability. We further integrate regression analysis and the Informer time-series model to improve predictive accuracy and stability. Additionally, Spearman correlation analysis is employed to examine the relationship between specific events and medal counts, and we empirically validate the host advantage hypothesis.
To ensure model robustness, we implement uncertainty quantification and hyperparameter optimization, refining both performance and reliability. This study not only improves the accuracy of Olympic medal predictions but also provides actionable insights for sports development strategies and policy decisions. The key contributions of this research are as follows:
1. Proposing a comprehensive Olympic medal prediction framework that integrates machine learning, time-series forecasting, and clustering techniques.
2. Empirically analyzing key factors influencing Olympic medal distribution [6], including host country effects, event-specific advantages, and national competitiveness metrics.
3. Innovatively modeling the “great coach” effect using graph theory’s maximum flow to provide theoretical support for the influence of coaches in improving a nation’s athletic performance.
4. Conducting model evaluation and uncertainty quantification to ensure the robustness and interpretability of the predictions.
By combining data-driven methods with domain knowledge, this research advances the modeling of Olympic medal prediction and offers practical decision-making support for sports managers, policymakers, and sports science researchers.
2. Problem statement
2.1. Problem assumption
To ensure the validity and applicability of the proposed model for predicting Olympic medal distributions, the following assumptions are made:
Assumption 1: The historical data used in this study, including but not limited to medal counts, athlete information, and event settings, are assumed to be accurate, complete, and representative of future trends in Olympic medal distribution.
Assumption 2: It is assumed that the medal counts of different countries are independent of each other. Features extracted from historical data, such as individual athlete performance and overall national competitiveness, can be effectively quantified and weighted to predict future Olympic performance.
Assumption 3: The variation in a country's total medal count is primarily influenced by historical performance, the structure of Olympic events, athlete capabilities, and home-field advantage.
Assumption 4: It is assumed that national sports policies, resource allocation for athlete development, and the rules governing Olympic events will remain relatively stable over time and will not be significantly disrupted by unforeseen external events.
Assumption 5: Athlete ability is assumed to be evenly distributed within each country. Consequently, a nation's overall competitiveness can be effectively measured by aggregating the performance scores across individual events.
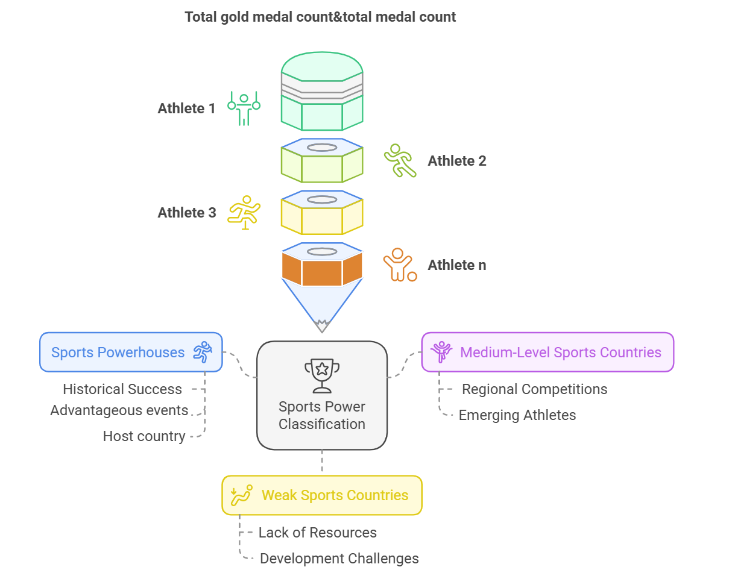
Figure 1: Country classification
2.2. Data preparation
For each Athlete \( {A_{i}} \) , the calculation of his/her score is based on his/her performance in the last five Olympic Games. Each Athlete is allocated a different number of points for each Olympic Games, depending on the medals he or she has won (or participated in).
Points allocation rules:
Gold Medal: 10 points,Silver medal: 6 points, Bronze: 3 points, No award: 1 point
Weighting: In order to assign decreasing weights to the historical performances of the athletes, we set decreasing weight factors for each Olympic Games. Specifically, the weight of the kth Olympics is \( {w_{k}} \) , where \( {w_{k}}= 1- 0.2(k -1) \) and k ∈ {1,2,3,4,5}, which corresponds to the last five Olympics. Namely:
w1 = 1, w2 = 0.8, w3 = 0.6, w4 = 0.4, w5 = 0.2(1)
Therefore, the score \( {S_{{t_{k}}}} \) , \( {A_{i}} \) of athlete \( {A_{i}} \) in the kth Olympic Games is determined by his/her performance in previous Olympic Games, and his/her weighted total score \( {P_{{A_{i}}}} \) is calculated using the following formula:
\( {P_{{A_{i}}}}=\sum _{k=1}^{5}{S_{{t_{k}}}} \)
This scoring mechanism, as shown in Fig. 1, allows recent achievements to carry more significance while still considering historical performance, thereby providing a balanced and temporally aware evaluation of each athlete’s overall Olympic record.
3. Method
To construct a robust and interpretable medal prediction framework for the 2028 Summer Olympics, we employ a diverse set of machine learning models that collectively capture both linear dependencies and complex nonlinear interactions among the influencing factors. The selected methods—ranging from classical linear regression to advanced ensemble techniques such as Random Forest, Gradient Boosting Decision Trees (GBDT), and XGBoost—are well-suited to model the multifaceted nature of Olympic performance indicators. Each model is rigorously evaluated based on its capacity to generalize across nations with heterogeneous profiles, account for temporal trends, and handle feature sparsity. In the following subsections, we briefly describe the mathematical formulation and objective functions of each method employed in this study.
(1) Linear Regression
Linear regression predicts the target value by fitting a straight line and optimises the number of models by minimising the mean square error. Target formula:
\( \overset{\text{^}}{y} \) = w1x1 + w2x2 + … + wnxn + b(2)
where w1, w2, ... , wn are the weights of the model, x1, x2, ... , xn are the input features and b is the bias term. Linear regression optimises the model parameters by minimising the loss function (usually the mean square error) with the objective function:
Obj = \( \sum _{i=1}^{n}({y_{i}}-\overset{\text{^}}{{y_{i}}}{)^{2}} \) (3)
(2) Random Forest
Random forests reduce the risk of overfitting a single tree by training multiple decision trees with randomly selected characteristics and samples. Each tree is trained independently of the others, and the final prediction is the average or majority vote of all the trees. The objective function of a random forest can be expressed as follows:
Obj = \( \sum _{i=1}^{n}L({y_{i}},\overset{\text{^}}{{y_{i}}}) \) (4)
where L is the loss function, usually the mean square error.
(3) GBDT
GBDT improves the model performance by progressively fitting the residuals of the data, optimising the loss function and adding a regularisation term. The objective function of the algorithm is:
\( Obj=\sum _{i=1}^{n}({y_{i}}-{\overset{\text{^}}{{y_{i}}}^{(t-1)}}-{f_{t}}({x_{i}}){)^{2}} \) (5)
(4) XGBoost
XGBoost further improves the generalisation and overfitting resistance of the model by optimising the objective function with a regularisation term.The objective function of XGboost can be expressed as:
\( Obj==\sum _{i=1}^{n}({y_{i}},{\overset{\text{^}}{{y_{i}}}^{(t-1)}}+{f_{t}}({x_{i}}))+Ω({f_{t}})=\sum _{i=1}^{n}({y_{i}},{\overset{\text{^}}{{y_{i}}}^{(t-1)}}+{f_{t}}({x_{i}}))+γT+\frac{1}{2}λ\sum _{j=1}^{T}w_{j}^{2} \) (6)
(5) CatBoost
Similar to GBDT, describing CatBoost adds a regularisation term to the objective function to reduce overfitting and improve model robustness. The objective function of CatBoost can be expressed as:
Obj= \( Ob{j^{t}}=\sum _{i=1}^{n}L({y_{i}},\overset{\text{^}}{{y_{i}}})+\sum _{j=1}^{T}Ω({f_{j}}) \) (7)
(6) Extra Trees
Show Extra Trees constructs decision trees by randomly selecting features and thresholds to reduce the risk of overfitting and improve model performance. The objective function of the algorithm can be expressed as:
Obj= \( \sum _{i=1}^{n}L({y_{i}},\overset{\text{^}}{{y_{i}}})++\sum _{j=1}^{m}Ω({T_{j}}) \) (8)
4. Environment and results
To identify the optimal combination of hyperparameters for our medal prediction model, we perform an extensive grid search process augmented with cross-validation and early stopping. This systematic approach ensures model robustness by preventing overfitting and enhancing generalization performance across varying data distributions. Figure 2 illustrates the final selected hyperparameter configuration, highlighting the combination that achieves the best predictive performance across multiple evaluation metrics.
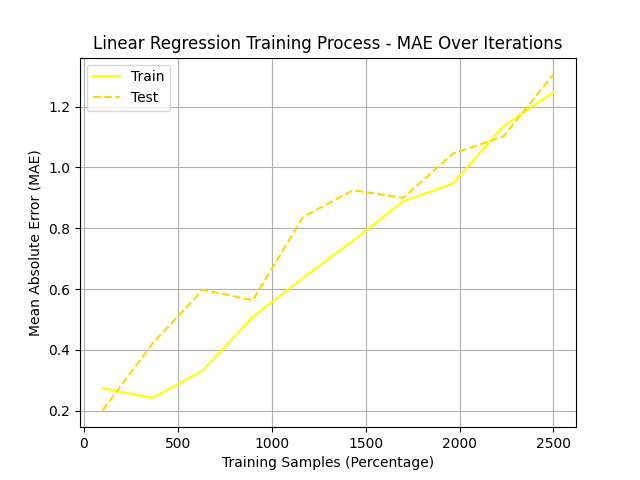
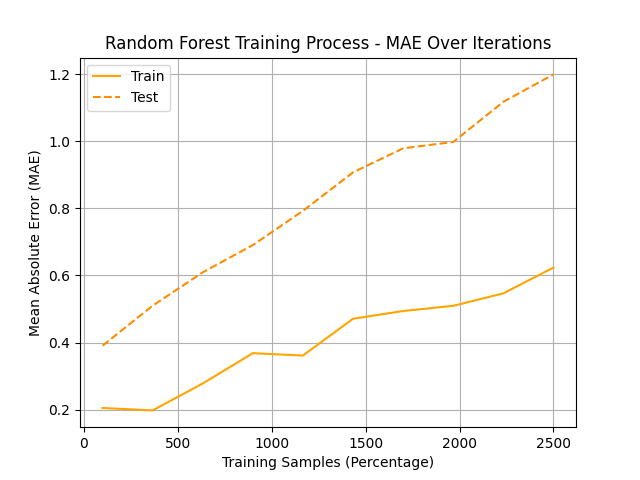
Figure 2: Optimal model parameter combinations
In anticipation of the 2028 Summer Olympics in Los Angeles, significant changes in the competition landscape have been officially announced. Notably, traditional events such as weightlifting and boxing will be excluded, while five new sports—baseball/softball, lacrosse, cricket, squash, and rugby—are to be introduced. These adjustments are expected to influence the medal distribution among participating nations, particularly those with historical strengths in the removed or added disciplines.
Based on our forecasting framework, and assuming a similar set of competing countries as in the 2024 Olympics, we observe a notable reshaping of national medal tallies. The United States, serving as the host nation in 2028, is projected to experience a substantial boost in both gold and total medal counts. In contrast, countries like China and Japan are expected to face a decline in medal performance, primarily due to the exclusion of sports in which they have historically excelled, and the absence of the home field advantage enjoyed by Japan in 2024.
Table 1: National medal ranking prediction table
Country | Gold Medals | Total Medals |
United States | 51 | 151 |
China | 31 | 86 |
Japan | 19 | 45 |
Australia | 18 | 52 |
France | 17 | 62 |
Netherlands | 16 | 38 |
Great Britain | 14 | 64 |
South Korea | 11 | 35 |
The U.S. is forecasted to dominate the medal table, significantly outperforming its competitors. This outcome can be attributed to both home advantage effects, such as familiar environments and strong crowd support, and the alignment of new events with American sporting culture and infrastructure. For example, sports like baseball/softball and lacrosse are deeply rooted in U.S. athletic traditions, providing a strategic edge in newly introduced categories.
On the other hand, China’s predicted decline is primarily associated with the removal of weightlifting and boxing, where Chinese athletes have historically secured multiple podium finishes. Japan, despite strong performance as the host in 2024, is expected to regress due to the loss of home advantage and the realignment of events.
These findings underscore the critical role of environmental and structural factors—including competition restructuring, host nation dynamics, and the inclusion of culturally relevant sports—in shaping Olympic outcomes. Moreover, they highlight the uncertainty and variability inherent in multi-nation sporting events, where external influences can significantly shift competitive balance.
In summary, the 2028 Los Angeles Olympics are anticipated to present a complex interplay of opportunity and challenge for competing nations. Our data-driven forecast emphasizes the strategic importance of understanding policy-level changes and leveraging national strengths to adapt to evolving Olympic structures.
5. Conclusion
This study proposes an integrated, data-driven framework for forecasting Olympic medal distributions, combining machine learning, time-series analysis, and clustering techniques. By incorporating factors such as host country advantage, national competitiveness, and event-specific trends, the model demonstrates strong predictive performance and interpretability. The findings offer valuable insights into the determinants of Olympic success and provide practical guidance for policymakers and sports development strategists. This work contributes to the growing field of sports analytics by advancing robust, scalable methods for international performance prediction.
References
[1]. Schlembach C, Schmidt S L, Schreyer D, et al. Forecasting the Olympic medal distribution during a pandemic: a socio-economic machine learning model[J]. arXiv preprint arXiv:2012.04378, 2020.
[2]. Wang Y, Wang J, Huang T Y, et al. STGCN-LSTM for Olympic Medal Prediction: Dynamic Power Modeling and Causal Policy Optimization[J]. arXiv preprint arXiv:2501.17711, 2025.
[3]. Behrang M A, Assareh E, Assari M R, et al. Using bees algorithm and artificial neural network to forecast world carbon dioxide emission[J]. Energy Sources, Part A: Recovery, Utilization, and Environmental Effects, 2011, 33(19): 1747-1759。
[4]. Behrang M A, Assareh E, Assari M R, et al. Using bees algorithm and artificial neural network to forecast world carbon dioxide emission[J]. Energy Sources, Part A: Recovery, Utilization, and Environmental Effects, 2011, 33(19): 1747-1759.
[5]. Nagpal P, Gupta K, Verma Y, et al. Paris Olympic (2024) Medal Tally Prediction[C]//International Conference on Data Management, Analytics & Innovation. Singapore: Springer Nature Singapore, 2023: 249-267.
[6]. He Z, Wang Z. Prediction of olympic medal count for USA based on robust time series model and computer implementation[C]//Third International Conference on Electronic Information Engineering and Data Processing (EIEDP 2024). SPIE, 2024, 13184: 1361-1369.
Cite this article
Xu,Y. (2025). A Data-Driven Approach to Predicting Olympic Medal Distribution: Integrating Machine Learning and Graph Theory. Theoretical and Natural Science,106,45-51.
Data availability
The datasets used and/or analyzed during the current study will be available from the authors upon reasonable request.
Disclaimer/Publisher's Note
The statements, opinions and data contained in all publications are solely those of the individual author(s) and contributor(s) and not of EWA Publishing and/or the editor(s). EWA Publishing and/or the editor(s) disclaim responsibility for any injury to people or property resulting from any ideas, methods, instructions or products referred to in the content.
About volume
Volume title: Proceedings of the 3rd International Conference on Mathematical Physics and Computational Simulation
© 2024 by the author(s). Licensee EWA Publishing, Oxford, UK. This article is an open access article distributed under the terms and
conditions of the Creative Commons Attribution (CC BY) license. Authors who
publish this series agree to the following terms:
1. Authors retain copyright and grant the series right of first publication with the work simultaneously licensed under a Creative Commons
Attribution License that allows others to share the work with an acknowledgment of the work's authorship and initial publication in this
series.
2. Authors are able to enter into separate, additional contractual arrangements for the non-exclusive distribution of the series's published
version of the work (e.g., post it to an institutional repository or publish it in a book), with an acknowledgment of its initial
publication in this series.
3. Authors are permitted and encouraged to post their work online (e.g., in institutional repositories or on their website) prior to and
during the submission process, as it can lead to productive exchanges, as well as earlier and greater citation of published work (See
Open access policy for details).
References
[1]. Schlembach C, Schmidt S L, Schreyer D, et al. Forecasting the Olympic medal distribution during a pandemic: a socio-economic machine learning model[J]. arXiv preprint arXiv:2012.04378, 2020.
[2]. Wang Y, Wang J, Huang T Y, et al. STGCN-LSTM for Olympic Medal Prediction: Dynamic Power Modeling and Causal Policy Optimization[J]. arXiv preprint arXiv:2501.17711, 2025.
[3]. Behrang M A, Assareh E, Assari M R, et al. Using bees algorithm and artificial neural network to forecast world carbon dioxide emission[J]. Energy Sources, Part A: Recovery, Utilization, and Environmental Effects, 2011, 33(19): 1747-1759。
[4]. Behrang M A, Assareh E, Assari M R, et al. Using bees algorithm and artificial neural network to forecast world carbon dioxide emission[J]. Energy Sources, Part A: Recovery, Utilization, and Environmental Effects, 2011, 33(19): 1747-1759.
[5]. Nagpal P, Gupta K, Verma Y, et al. Paris Olympic (2024) Medal Tally Prediction[C]//International Conference on Data Management, Analytics & Innovation. Singapore: Springer Nature Singapore, 2023: 249-267.
[6]. He Z, Wang Z. Prediction of olympic medal count for USA based on robust time series model and computer implementation[C]//Third International Conference on Electronic Information Engineering and Data Processing (EIEDP 2024). SPIE, 2024, 13184: 1361-1369.