


1. Introduction
Air pollution continues to be a source of widespread concern globally, especially in developing countries with better levels of development. With rapid urbanisation and economic development, over-industrialisation and fossil fuel exploitation have had a significant impact on air pollution. Outdoor air pollutants mainly include Pm2.5, which is the main influence of haze and air pollution, and refers to small respirable particles with an aerodynamic diameter of <2.5 μm, which can exist in the air for a long period of time and can be easily inhaled by human beings. It is highly harmful and can cause serious damage to the body when inhaled, such as CVD and lung diseases [1]. Therefore it is particularly important for monitoring, analysing and combating PM2.5 in air pollution. In order to deal with the air quality problem, China has started the prevention and control of air pollution since the 1970s, and has actively taken a number of initiatives [2].
However, the treatment of air pollution problems cannot be carried out blindly without any reason, but needs to be studied and analysed in the light of the underlying characteristics. A lot of research results have been made by domestic and foreign scholars on the characterisation of air pollution and PM2.5. The impact of PM2.5 on indoor urban environments was reviewed by Nuno R. Martins et al [3]; Yao Luo et al. used big data to process air pollution and meteorological data to analyse the characteristics of the temporal and spatial distribution of PM2.5 pollution in Harbin and the meteorological factors affecting it, and obtained the distribution of air pollution in Harbin and its influence mechanism [4]; Vo Thi Tam Minh et al. used machine learning and WRF modelling to build a forecasting system for PM2.5 to monitor Ho Chi Minh City, Vietnam [5]; Zongwei Ma, Xuefei Hu et al. have elaborated the spatial and temporal trends of PM2.5 concentration in China from 2004 to 2013 based on satellite remote sensing [6]; Ju Wang et al. analysed the spatial and temporal distribution characteristics of atmospheric particulate matter (PM10 and PM2.5) and its influencing factors in Changchun City [7]; Kun Cai et al. showed the spatial and temporal variations of NO2 and PM2.5 in the Chengdu-Chongqing Economic Zone, China, from 2005 to 2015 based on satellite remote sensing [8]; Wang Yunfeng et al. explored the spatial and temporal distribution characteristics of PM2. 5 in Zhejiang Province from 2016 to 2022 [9].
Wansheng Economic Development Zone (WEDZ) in Chongqing was once a military-industrial town during the 'Third Line Construction' period, and in the past, the industry was 'dominated by coal', but due to excessive seizure of mineral resources, it was listed in the second batch of national resource-exhausted cities in 2009. The rapid development of heavy industry and the high use of fossil fuels in the past have made the air quality in WEDZ poor all year round, which has had a serious impact on the health and production of the neighbouring residents [10,11], and has also made Chongqing gained the nickname of 'China's Fog Capital'. Therefore, the purpose of this paper is to study and analyse the distribution characteristics of PM2.5 concentration in WEDZ of Chongqing Municipality from two perspectives of time and space, and to analyse the air pollution control situation of the place by visualizing the movement trajectory of the centre of gravity.
2. Data and methods
2.1. Research region profile
The paper size must be set to A4 (210x297 mm). The document margins must be the followinThe study area of this paper is Wansheng Economic Development Zone. WEDZ is located in the southern part of Chongqing, at the junction of Chongqing and Chongqing-Guizhou, with its approximate geographical coordinates between 28°44′ - 29°07′ north latitude and 106°45′ - 107°03′ east longitude. Its land perimeter borders Nanchuan District to the east and north, and Tongzi County in Guizhou Province to the south.
The elevation map is shown in Figure 1. The study area is located in the Sichuan Basin, surrounded by mountain ranges, and the terrain shows a remarkable feature of high east and low west. These rolling hills act as natural barriers that block the flow of air in the horizontal direction. When pollutants are emitted, it is difficult for them to spread thinly and quickly to the neighbouring areas with the help of horizontal air currents. Therefore, PM2.5 and other air pollutants from heavy industries, such as the burning of coal mines and fossil fuels, can have a serious impact on the lives of residents.
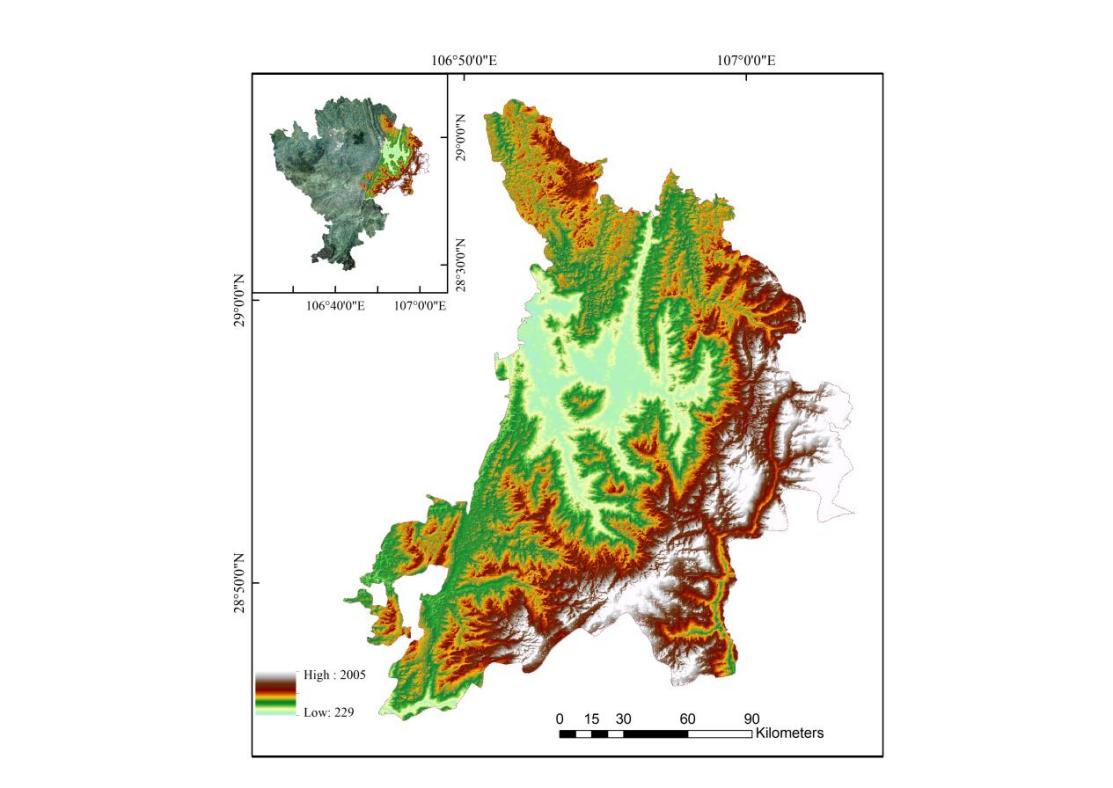
Figure 1: Elevation map of Wansheng economic development zone
The area has a subtropical monsoon climate, which is generally characterised by mild and humid conditions, with an average annual rainfall of 1,277 mm, which is relatively abundant. However, the seasonal and spatial distribution of rainfall is not uniform enough to bring airborne pollutants to the surface through the scouring action of rainwater, resulting in pollutants being suspended in the air for long periods of time Moreover, the relative humidity in the area is often above 70 %. The wetter climatic conditions encourage complex chemical reactions of gaseous pollutants, generating secondary aerosols that increase the level of PM2.5 in the air.
2.2. Data source
The remote sensing images and DEM elevation data used in this paper are from and Geospatial Data Cloud website (https://www.gscloud.cn/). The remote sensing image is Landast-8 L2 (LC81270402021214LGN00).
The DEM elevation image is an Aster GDEMv3 image with a spatial resolution accuracy of 30 m. It is one of the highest resolution global DEMs in the world. The high spatial resolution allows for a finer representation of the terrain and can be used for more complex analyses.
Air pollution and other data from the China High Air Pollutants (CHAP) dataset of high-resolution, high-quality near-surface air pollutants published on the website of the National Scientific Data Centre for the Tibetan Plateau (NSCDP) by the team of Dr. Jing Wei and Prof. Zhanqing Li .PM2.5 data is one of the main indicators of this dataset [12,13]. This data is the national seamless ground-level PM2.5 data from 2000 to 2023 obtained by using artificial intelligence techniques to fill in the spatial missing values of the satellite MODIS MAIAC AOD product using modal information, combined with the production of big data such as ground-based observations, atmospheric reanalysis and emission inventories, and the period of 2006-2023 was selected as the scale of the study in this paper. For a detailed description, see Table 1.
Table 1: Data description
Name | Coordinate | Period | Additional information | ||
LC08_L1TP_122044_20131129_20200912_02_T1 | CGS_WGS_1984 | 2013-11-29 | Cloud Cover | Strip Number | Row Number |
0.12 | 122 | 044 | |||
ASTGTMV003_N28E106 | None | None | 28 | 106 | |
ASTGTMV003_N28E107 | 28 | 107 | |||
ASTGTMV003_N29E106 | 29 | 106 | |||
ASTGTMV003_N29E107 | 29 | 107 | |||
Day-by-day PM2.5 raster data at 1km resolution for the China in 2000-2023 | 2000 To 2023 | None | |||
2.3. Research methods
2.3.1. Temporal distribution characterization
The collected PM2.5 concentration time series data are analysed to calculate statistical indicators such as average value, standard deviation, the monthly rate of change, annual rate of change, etc., and time series graphs are drawn to visualise the trend of PM2.5 concentration over time Comprehensive analysis of the PM2.5 concentration situation in WEDZ from monthly, quarterly and annual perspectives and then the change of time perspective.
2.3.2. Spatial distribution characterization
This paper collected and processed the distribution of pm2.5 concentration in WEDZ of Chongqing Municipality through ArcGIS. With the spatial analysis function , the discrete monitoring point data were interpolated into a continuous spatial distribution layer of PM2.5 concentration. By producing spatial distribution maps of PM2.5 concentration in different periods, the spatial changes of PM2.5 concentration are visualized, and the distribution characteristics and causes of high and low concentration areas are analysed.
2.3.3. Analysis of the centre of gravity transfer of PM2.5 distribution
In this paper, the centre of gravity of PM2.5 annual average data in WEDZ is weighted and plotted from 2006 to 2023. The centre of gravity of the PM2.5 annual average data is transferred to deduce the spatial change characteristics of the centre of gravity of Pm2.5 pollution in WEDZ during the 18-year period.
The formula for calculating the weighted centre of gravity is as follows:
\( \overline{x}=\frac{\sum _{i=1}^{n}({x_{i}}∙{w_{i}})}{\sum _{i=1}^{n}{w_{i}}},\overline{y}=\frac{\sum _{i=1}^{n}({y_{i}}∙{w_{i}})}{\sum _{i=1}^{n}{w_{i}}}\ \ \ (1) \)
\( (\bar{x},\bar{y} \) ) is the planar coordinates of the weighted centre of gravity based on the UTM projection; \( n \) is the total number of pixels with the calculation; \( ({x_{i}},{y_{i}}) \) is the coordinates of the centroid of the first pixel; \( {w_{i}} \) is the PM2.5 concentration value of the first pixel.
3. Analysis of results
3.1. Results of the temporal character analysis
In this paper, the years 2006-2023 were selected as the time study scale, and the day-by-day PM2.5 data were consolidated sequentially. The characteristics and trends of the temporal distribution of Pm2.5 in WEDZ were analyzed in detail in three temporal dimensions: monthly, quarterly and annual. Figure 2 shows the change curve of Pm2.5 concentration from 2006 to 2023, and Figure 3 shows the long-term Pm2.5 change trend in WEDZ.
From Figures 2 and 3, it can be seen that the annual average Pm2.5 concentration in WEDZ in the long term time horizon of 2006 - 2023 in Chongqing Municipality, although there are ups and downs, generally shows a significant decreasing trend. This long-term change is clearly illustrated by the red 12-month average concentration change line in Figure 3, which shows a gradual decrease in the value, visually reflecting the continuous improvement in air quality. This improving trend is closely linked to the implementation of a range of policy measures. In particular, policies such as the Action Plan for the Prevention and Control of Air Pollution launched in 2013, the Three-Year Action Plan for Winning the Battle for Blue Skies launched in 2018, and the Action Plan for Continuous Improvement of Air Quality put forward in 2023 have provided an effective impetus to reduce the concentration of PM2.5, contributing to the significant improvement of air quality.
In combination with Figure 3, it is easy to see that the three key impact points marked out in the figure in 2010, 2015 and 2020 also have different impacts on PM2.5 concentrations:
(1) Around the time of industrial restructuring in 2010, the monthly average PM2.5 values fluctuated, but the moving average did not show a significant downward inflection point. This may be due to industrial restructuring in the early stage, the transformation or upgrading of the relevant enterprises has not yet been fully in place, although there is a certain decline, but fluctuations are large, ups and downs are obvious on the PM2.5 concentration of the direct effect of the reduction of the reduction of the concentration is not yet significant.
(2) The implementation of the Air Purification Plan in 2015 created an important inflection point in the trend changes in Figures 2 and 3. In Figure 2, it can be seen that in 2014-2015, the annual average Pm2.5 declined precipitously, while in Figure 3, the monthly average change first began to decline significantly after that. This fully reflects the fact that the relevant management measures in the action plan, such as strengthening the control of pollution sources and promoting clean energy, have effectively reduced the emission of air pollutants and played a key role in improving air quality.
(3) The 2020 blockade due to the COVID-19 also had a significant impact on PM2.5 changes. The monthly averages decreased somewhat during the 2020 blockade due to the COVID-19 outbreak. And the annual PM2.5 change even reached the lowest value. Combined with Figure 4, it is easy to see that the PM2.5 concentration in WEDZ in 2020 was extremely low during the blockade and control period, once reaching the lowest value at about 15 μg/m³. In the second half of the year when the control was lifted, it was significantly higher. This phenomenon particularly highlights the important influence of human activity intensity on air quality. Anti-epidemic measures such as restrictions on traffic and travelling, and reductions in industrial activities have significantly reduced PM2.5 emissions, demonstrating the strong link between human activities and air quality.
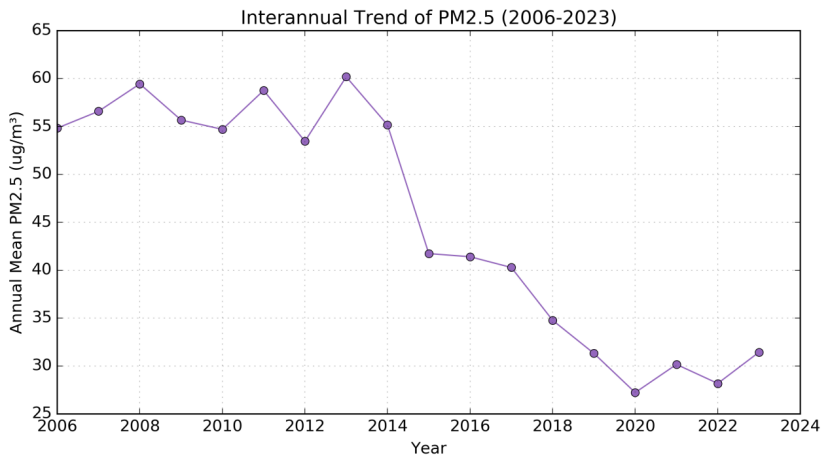
Figure 2: Annual change curve 2006-2023
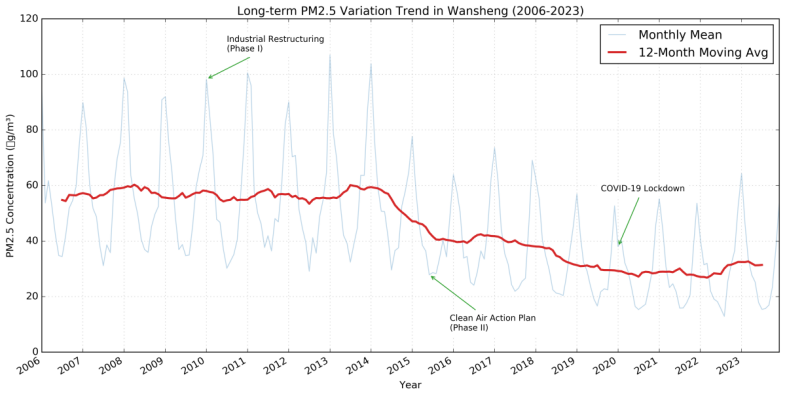
Figure 3: Long-term Pm2.5 trend in Wansheng economic development zone
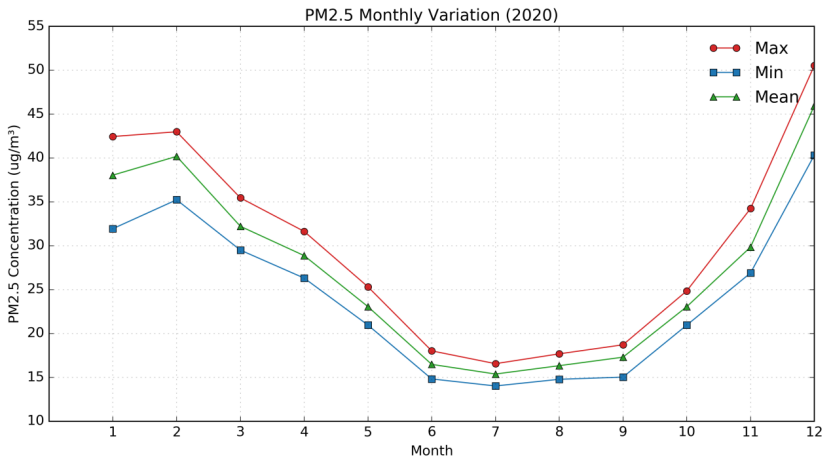
Figure 4: Trends in average monthly changes in Pm2.5 in 2020
Combined with the seasonal variation box plot in Figure 5, it is easy to see that the PM2.5 concentrations generally show a 'U' shaped trend, with higher levels at the beginning and end of each year, which is a very clear seasonal feature. Concentrations are higher in the winter months (December - February), especially in January, with high median, interquartile range and extreme values; and lower in the summer months (June - August), with the lowest concentrations in July.
Combined with the topography and precipitation data of Chongqing, and related literature, the high concentration of PM2.5 in winter is mainly due to the frequent occurrence of adverse weather conditions such as inversions and static winds in winter, poor atmospheric dispersion conditions, and small environmental capacity, which makes it easy to form a continuous polluted weather after the accumulation of pollutants. The high humidity and foggy climate of Chongqing in winter also promotes the hygroscopic growth of secondary particulate matter, which further exacerbates the pollution of fine particulate matter. At the same time, the increased use of fuels in winter for heating purposes has led to a significant increase in pollutant levels. In summer, however, due to high precipitation, rain has a flushing effect on particulate matter in the atmosphere, and atmospheric convection activity is strong, which is conducive to the dilution and diffusion of pollutants, resulting in relatively low PM2.5 concentrations. This seasonal pattern of change reflects the combined effects of natural climatic conditions and human living habits on air quality.
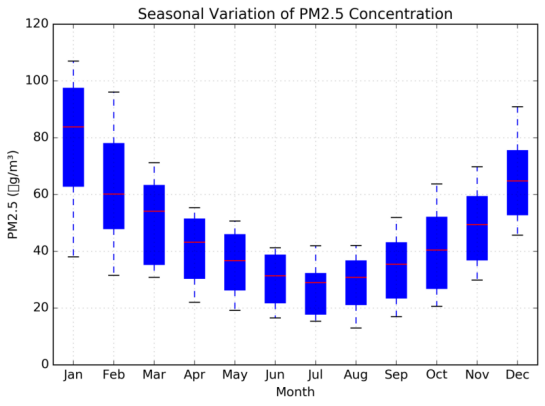
Figure 5: Box plot of seasonal variation in Pm2.5 concentration
3.2. Characteristics of PM2.5 spatial distribution
Figures 6 and 7 show the spatial distribution of PM2.5 concentrations in WEDZ from 2006 to 2023. Combined with the elevation map of the study area (Fig. 1), it can be found that the PM2.5 concentration in WEDZ shows the spatial distribution characteristics of high in the northwest, low in the southeast, and high in the west of the centre in different periods. This is roughly the same as the topography of the study area, reflecting the fact that topographic relief has a great influence on the distribution of PM2.5 concentrations.
Combined with Figure 6, it can be seen that when the effect of early treatment is not obvious, the spatial distribution of PM2.5 shows the characteristics of significantly higher concentrations in the centre or local areas than in the periphery, with a relative concentration of high-concentration areas, reflecting the spatial concentration of pollution sources, which is related to the intensity and type of human activities in a given area.
As shown in Figure 7, the spatial distribution of PM2.5 shows a wide coverage of areas with low concentrations and a significant reduction or even disappearance of areas with high concentrations, indicating that with the passage of time, PM2.5 pollution in the region has been effectively treated, and the range and intensity of the influence of pollution sources have been reduced, with the spatial distribution presenting a more homogeneous state of low concentrations and an overall improvement in the quality of the environment.
Overall, in terms of spatial distribution, PM2.5 concentrations in the region have experienced a shift from locally concentrated high pollution to widespread low pollution, reflecting the positive spatial effectiveness of regional environmental management, and the wide distribution of low concentration areas suggests that pollution control measures have better spatial coverage and effectiveness.
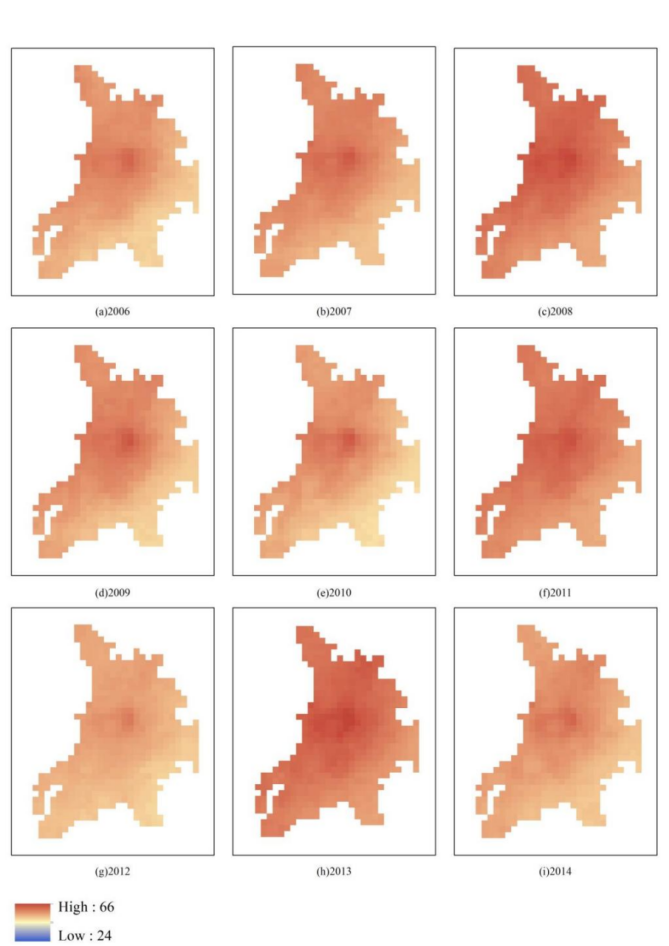
Figure 6: Spatial distribution of PM2.5 concentrations from 2006 to 2014
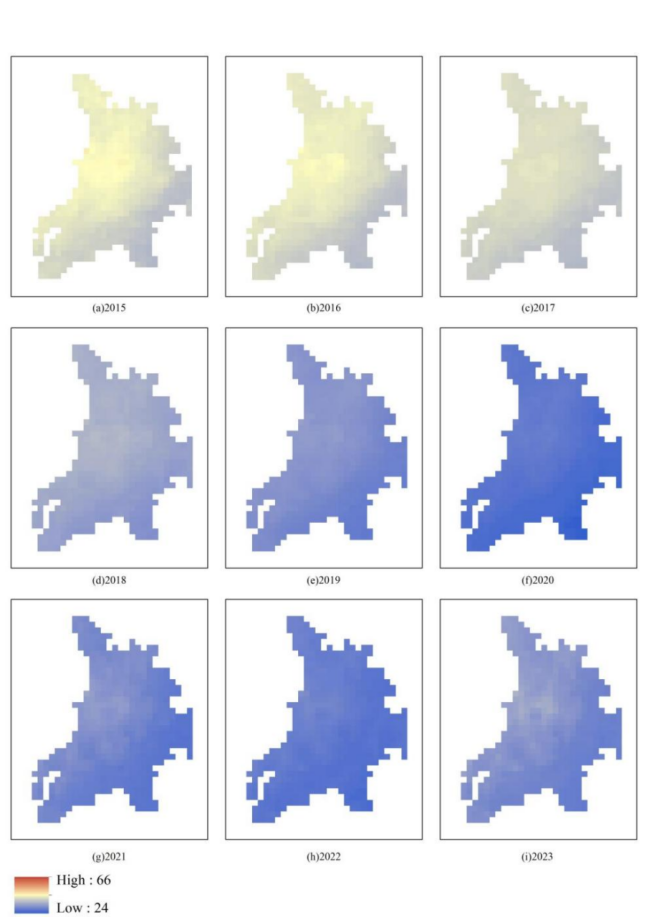
Figure 7: Spatial distribution of PM2.5 concentrations from 2015 to 2023
3.3. Analysis of the centre of gravity of PM2.5 distribution transfer
By extracting the PM2.5 pixel values of WEDZ in the raster image and weighting the distribution of its centre of gravity using spatial statistics and analysis techniques, the weighted centre of gravity of the distribution of PM2.5 concentration was obtained, and the transfer trajectory map of the centre of gravity of PM2.5 in WEDZ was produced as in Figure 8.
Figure 8 shows that there are dynamic changes in the location of the centre of gravity of PM2.5 distribution between different years, and although there is no obvious single direction of continuous transfer and certain fluctuating characteristics, the overall moving trend is to migrate to the north-west.
During 2006 - 2014, the centre of gravity in the early years was relatively concentrated, indicating that the change in the centre of gravity position was small during this period and the centre of gravity of PM2.5 concentration was relatively stable in a certain area. By the 2015 - 2018 period, the position of the 2015 point shifted somewhat compared to the earlier period, and then the centre of gravity continued to move in 2016 - 2018, indicating a significant positional adjustment but little change in the magnitude of the centre of gravity of concentration during this period. Probably due to the implementation and enforcement of policies are not yet in place, although the impact on the distribution of PM2.5 but not strong. In 2019 - 2023, the centre of gravity changes considerably, and then in 2020, it may be adjusted back due to the epidemic control, and then in 2021 - 2023, it gradually moves to the northwest direction.
Gradually, it moves away from the concentration area and the city centre at the beginning and moves towards the outskirts of the city. It is easy to see that the changes in the sources of pollution in the region and the implementation of environmental management measures have been very effective, providing a strong support to ensure the health of local residents and a good living environment.
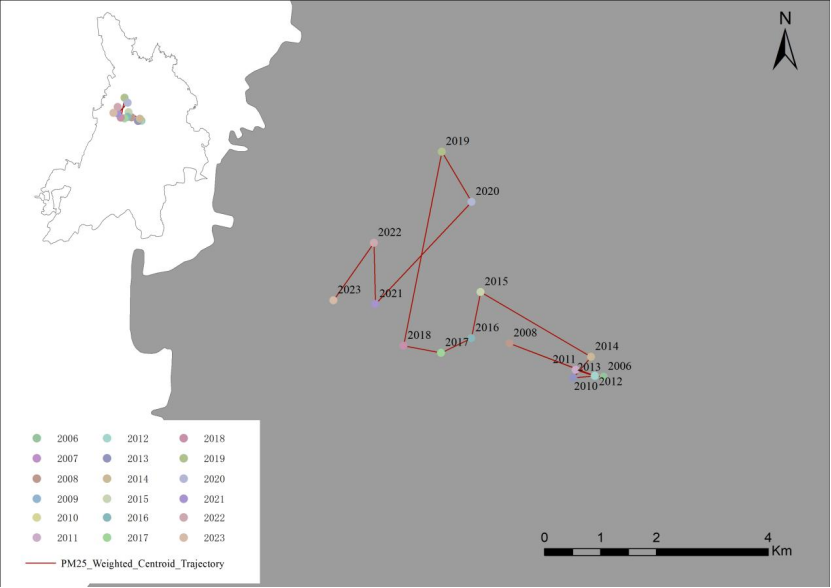
Figure 8: Trend of the centre of gravity of PM2.5 concentration
4. Conclusions
This paper focuses on the comprehensive analysis of PM2.5 concentration changes from temporal and spatial distribution characteristics in WEDZ. Through the analysis of temporal characteristic distribution, the analysis of spatial distribution characteristics with weighted centre of gravity shift analysis, this paper obtained the following conclusions:
(1) Changes in PM2.5 concentrations in WEDZ from 2006 to 2023 fluctuated but showed an overall downward trend. The air quality in the region changed significantly in 2015, with the annual average PM2.5 concentration falling off a cliff, after which the overall air quality improved, with a slight rebound and ups and downs after 2020. The PM2.5 concentration in the region on a monthly average change in the overall 'U' shape, the overall change in the winter is the most serious pollution, summer pollution is relatively low, spring and autumn in the middle of the seasonal pattern of change, reflecting the natural climatic conditions and human habits on the air quality of the integrated impact.
(2) Combined with the spatial distribution analysis, it is easy to see that the spatial scale distribution of PM2.5 concentration in WEDZ is obviously high in the north-west and low in the south-east. In the early governance effect is not obvious, the concentration distribution for the high concentration area in the centre of the concentration aggregation. However, with the implementation of air control initiatives, the aggregation trend declined as a whole, indicating that the pollution control measures have better coverage and effectiveness in space.
(3) Although the spatial centre of gravity of PM2.5 concentration in WEDZ changed from 2006 to 2023 without any obvious single-direction continuous transfer and showed certain fluctuating characteristics, the overall trend of transfer was to the north-west. The total spatial and temporal distribution characteristics also change dramatically with time, gradually leaving the study area boundary range to the west, a change that reflects the trend of the region's air quality getting better year by year.
In the future, this paper suggests combining the annual changes of land use data, combining industrial transformation and urban landscape changes to comprehensively analyse more influencing factors of PM2.5 concentration changes in Wansheng Economic Development Zone , and the analysis of industrial transformation on its influencing factors and weighting ratio. Comprehensively judge the impact of industrial structure transformation on air pollution and PM2.5 changes in resource-exhausted cities. Provide theoretical support for the feasibility and focus of air pollution and PM2.5 control measures.
References
[1]. Hayes, R. B. et al. PM2.5 air pollution and cause-specific cardiovascular disease mortality. International Journal of Epidemiology 49, 25–35 (2020).
[2]. Wang Wenxing, Chai Fahe, Ren Zhenhai, et al. China's air pollution prevention and control history, achievement and experience in the past 70 years since the founding of New China[J]. Environmental Science Research,2019,32(10):1621-1635.DOI:10.13198/j.issn.1001-6929.2019.09.15.
[3]. Martins, N. R. & Carrilho Da Graça, G. Impact of PM2.5 in indoor urban environments: A review. Sustainable Cities and Society 42, 259–275 (2018).
[4]. Luo, Y., Liu ,Shuo, Che ,Lina & and Yu, Y. Analysis of temporal spatial distribution characteristics of PM2.5 pollution and the influential meteorological factors using Big Data in Harbin, China. Journal of the Air & Waste Management Association 71, 964–973 (2021).
[5]. Minh, V. T. T., Tin, T. T. & Hien, T. T. PM2.5 Forecast System by Using Machine Learning and WRF Model, A Case Study: Ho Chi Minh City, Vietnam. Aerosol Air Qual. Res. 21, 210108 (2021).
[6]. Satellite-Based Spatiotemporal Trends in PM2.5 Concentrations: China, 2004–2013. https://ehp.niehs.nih.gov/doi/epdf/10.1289/ehp.1409481 doi:10.1289/ehp.1409481.
[7]. Wang, J., Xie, X. & Fang, C. Temporal and Spatial Distribution Characteristics of Atmospheric Particulate Matter (PM10 and PM2.5) in Changchun and Analysis of Its Influencing Factors. Atmosphere 10, 651 (2019).
[8]. Cai, K., Zhang, Q., Li, S., Li, Y. & Ge, W. Spatial–Temporal Variations in NO2 and PM2.5 over the Chengdu–Chongqing Economic Zone in China during 2005–2015 Based on Satellite Remote Sensing. Sensors 18, 3950 (2018).
[9]. Wang Yunfeng, Wang Weikang, Ai Yatao. Characteristics of spatial and temporal distribution of PM2.5 in Zhejiang Province from 2016 to 2022[J]. Mapping and Spatial Geographic Information,2025,48(03):150-153.
[10]. Yang Qin, Liu Yi. Analysis of major causes of death and potential life expectancy loss of residents in Wansheng Economic Development Zone, Chongqing, China in 2014[J]. Chongqing Medicine,2016,45(18):2528-2531.
[11]. The association between PM2.5 concentration and the severity of acute asthmatic exacerbation in hospitalized children: A retrospective study in Chongqing, China. https://onlinelibrary.wiley.com/doi/epdf/10.1002/ppul.26557.
[12]. Wei, J. et al. Reconstructing 1-km-resolution high-quality PM2.5 data records from 2000 to 2018 in China: spatiotemporal variations and policy implications. Remote Sensing of Environment 252, 112136 (2021).
[13]. Wei, J. et al. Improved 1 km resolution PM2.5 estimates across China using enhanced space–time extremely randomized trees. Atmospheric Chemistry and Physics 20, 3273–3289 (2020).
Cite this article
Zhao,H. (2025). Spatial and Temporal Trends of PM2.5 Concentration in Wansheng Economic Development Zone in Chongqing from 2006 to 2023. Theoretical and Natural Science,102,23-33.
Data availability
The datasets used and/or analyzed during the current study will be available from the authors upon reasonable request.
Disclaimer/Publisher's Note
The statements, opinions and data contained in all publications are solely those of the individual author(s) and contributor(s) and not of EWA Publishing and/or the editor(s). EWA Publishing and/or the editor(s) disclaim responsibility for any injury to people or property resulting from any ideas, methods, instructions or products referred to in the content.
About volume
Volume title: Proceedings of ICEGEE 2025 Symposium: Impact of Technological Innovation on Energy Efficiency in European Countries
© 2024 by the author(s). Licensee EWA Publishing, Oxford, UK. This article is an open access article distributed under the terms and
conditions of the Creative Commons Attribution (CC BY) license. Authors who
publish this series agree to the following terms:
1. Authors retain copyright and grant the series right of first publication with the work simultaneously licensed under a Creative Commons
Attribution License that allows others to share the work with an acknowledgment of the work's authorship and initial publication in this
series.
2. Authors are able to enter into separate, additional contractual arrangements for the non-exclusive distribution of the series's published
version of the work (e.g., post it to an institutional repository or publish it in a book), with an acknowledgment of its initial
publication in this series.
3. Authors are permitted and encouraged to post their work online (e.g., in institutional repositories or on their website) prior to and
during the submission process, as it can lead to productive exchanges, as well as earlier and greater citation of published work (See
Open access policy for details).
References
[1]. Hayes, R. B. et al. PM2.5 air pollution and cause-specific cardiovascular disease mortality. International Journal of Epidemiology 49, 25–35 (2020).
[2]. Wang Wenxing, Chai Fahe, Ren Zhenhai, et al. China's air pollution prevention and control history, achievement and experience in the past 70 years since the founding of New China[J]. Environmental Science Research,2019,32(10):1621-1635.DOI:10.13198/j.issn.1001-6929.2019.09.15.
[3]. Martins, N. R. & Carrilho Da Graça, G. Impact of PM2.5 in indoor urban environments: A review. Sustainable Cities and Society 42, 259–275 (2018).
[4]. Luo, Y., Liu ,Shuo, Che ,Lina & and Yu, Y. Analysis of temporal spatial distribution characteristics of PM2.5 pollution and the influential meteorological factors using Big Data in Harbin, China. Journal of the Air & Waste Management Association 71, 964–973 (2021).
[5]. Minh, V. T. T., Tin, T. T. & Hien, T. T. PM2.5 Forecast System by Using Machine Learning and WRF Model, A Case Study: Ho Chi Minh City, Vietnam. Aerosol Air Qual. Res. 21, 210108 (2021).
[6]. Satellite-Based Spatiotemporal Trends in PM2.5 Concentrations: China, 2004–2013. https://ehp.niehs.nih.gov/doi/epdf/10.1289/ehp.1409481 doi:10.1289/ehp.1409481.
[7]. Wang, J., Xie, X. & Fang, C. Temporal and Spatial Distribution Characteristics of Atmospheric Particulate Matter (PM10 and PM2.5) in Changchun and Analysis of Its Influencing Factors. Atmosphere 10, 651 (2019).
[8]. Cai, K., Zhang, Q., Li, S., Li, Y. & Ge, W. Spatial–Temporal Variations in NO2 and PM2.5 over the Chengdu–Chongqing Economic Zone in China during 2005–2015 Based on Satellite Remote Sensing. Sensors 18, 3950 (2018).
[9]. Wang Yunfeng, Wang Weikang, Ai Yatao. Characteristics of spatial and temporal distribution of PM2.5 in Zhejiang Province from 2016 to 2022[J]. Mapping and Spatial Geographic Information,2025,48(03):150-153.
[10]. Yang Qin, Liu Yi. Analysis of major causes of death and potential life expectancy loss of residents in Wansheng Economic Development Zone, Chongqing, China in 2014[J]. Chongqing Medicine,2016,45(18):2528-2531.
[11]. The association between PM2.5 concentration and the severity of acute asthmatic exacerbation in hospitalized children: A retrospective study in Chongqing, China. https://onlinelibrary.wiley.com/doi/epdf/10.1002/ppul.26557.
[12]. Wei, J. et al. Reconstructing 1-km-resolution high-quality PM2.5 data records from 2000 to 2018 in China: spatiotemporal variations and policy implications. Remote Sensing of Environment 252, 112136 (2021).
[13]. Wei, J. et al. Improved 1 km resolution PM2.5 estimates across China using enhanced space–time extremely randomized trees. Atmospheric Chemistry and Physics 20, 3273–3289 (2020).