


1. Introduction
Economics is a cycle that contains four factors-households, companies, governments, and foreign countries [1]. In such a cycle, goods and cash are flowing in it. Each factor is mutually affected and determines each other. Through observation and further categorization, economists have abstracted the progress as a cycle with fluidity, containing phases as recession, falling to a trough point which is the lowest period of the economy of a country, then gradually starting to expanse and recover until it reaches to the peak, and eventually falls again [2]. A recession generally lasts for more than a few months, and in some periods even for years [3]. During the recession, the unemployment rate will significantly rise. Data from Sheldon et al. showed that during a great recession, nearly 16% of the labor force will experience job loss [4]. What follows is a decrease in people’s disposable income. Purchasing power decreases with the decrease in income, which will continuously lower consumers’ confidence, and consumption growth and eventually lead to a decline in GDP growth [5].
Due to the periodical characteristics shown by the economy, economists are then able to predict the economic trend and later situation. However, before formulating a new and effective market strategy based on the forecast results, it is essential to have an extensive understanding and analysis of consumers’ consumption concepts and willingness to consume, especially in the economic downturn. Consumers’ consumption is driven by many factors, but the main source is income. Understanding the concept of consumption in the current situation can help economists better understand the economic process and thus make more accurate and precise predictions [6].
The changes in consumers’ consumption concepts in the period of economic downturn are not solely to a single degree. A wide range from region, culture, market operation mode, and details to gender, age, and different types of expenditure, each factor may have an impact on consumers’ consumption decisions [7]. Consumers during the recession are more likely to adopt a new consumption behavior to accommodate reduce in their income, leading to a greater cut to nondurable goods and a volatility decline in durable purchases [8, 9]. Through observation, the economic downturn will directly affect people’s demand for quality life and diet, causing individuals’ consumption of fruits, vegetables, and other ingredients to reduce significantly. Nevertheless, Vrontos et al. found out that during the economic recession, the expenditure on durable goods and necessities does not respond strongly to the stimulus of the downturn of the economy [10]. Compared to other factors such as expenditure on houses, cars family investment, that have been greatly affected during the recession period, the observed impact on durable goods is not obvious, which will only be reduced by around half of its origin [10]. This paper will focus on analyzing the reflection of the economic trends of various economic indicators and the corresponding impact on consumers’ consumption habits from macro and micro aspects.
2. Methods
2.1. Data source
The data used is derived from Reed et al.’s research of the effects of consumers’ spending change on commodities of different types and nature during the recession and Kaggle, which contains different financial indicators of the economy from 2003 to 2023 [9]. There are 160 groups of data that have been used in this paper. All selected data of financial indicators from 2003 to 2023 are samples from January the first of a new year, each data is separated by a whole year.
2.2. Sample selection
Due to the fluctuation and the recognition lag of the economy and the variability of the economic indicators, it is difficult to accurately grasp the changing point of the trend of the economy. This paper used 150 selected observations in Table 1 and 6 variables with their specific definition shown in the table. Through induction and summary of a large number of diverse indicators, the boom and recession changes in the economy can then be pointed out, further the effects on the consumers’ willingness to consume.
Table 1: Variable explanation
Name of Variables | Signs | Range |
Gross domestic product | GDP | 11170 to 26470 trillion dollars |
Real interest rate | CPI | -0.25% to 2.2% |
Unemployment rate | UR | 3.4% to 9.8% |
Personal saving rate | PSR | 3.2% to 20% |
Sticky Price Consumer Price | SPC | 0.05 to 0.56 |
Consumer price index | CPI | -0.23 to 1.78 |
Figure 1 shows the scatter distribution of the percentage of consumers’ consumption in different types of products containing food consumption, rate of food at home and away from home, snacks’ sales rate, new vehicles, consumption in durable goods, renovation of furniture, and rent.
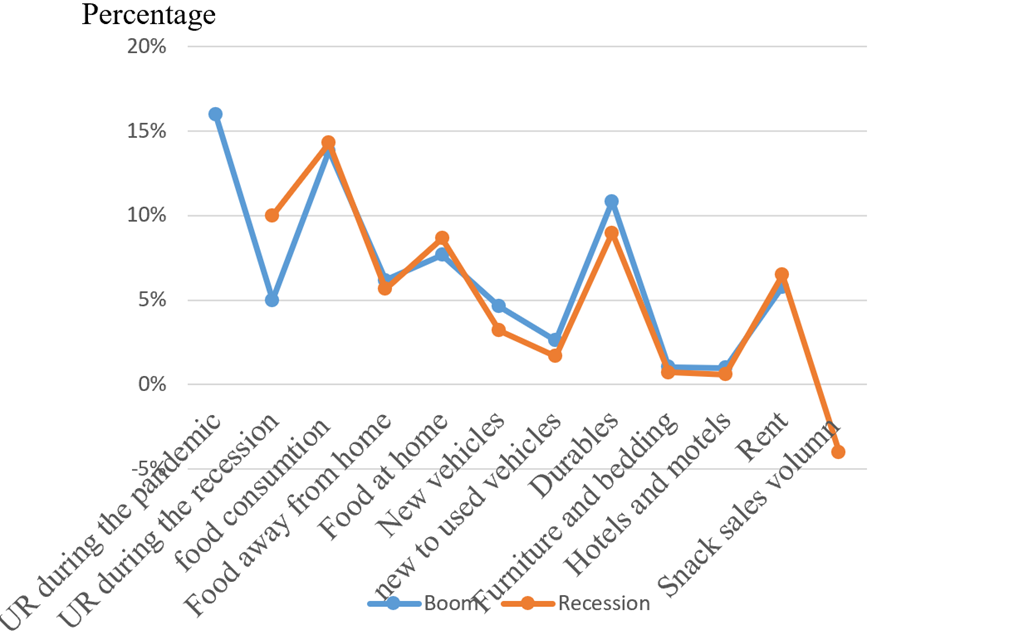
Figure 1: Comparison of consumption of products during boom with recession period
2.3. Method introduction
This article is going to use the Vector Auto Regression (VAR) model to analyze the regression of the economic data and to further conclude the relationship between the recession of the economy with changes in consumers’ consumption habits [10]. The VAR model is a model that has been widely used in analyzing relationships between multiple time series variables, helping to better understand the influence between different variables over time. The model consists of endogenous variables, lags (past values of variables), coefficients, error terms, impulse response function (IRF) (measures how a shock to one variable affects all the others over time), and variance decomposition (showing how much of a variable’s changes are explained by shocks to itself versus shocks to other variables).
3. Results and discussion
3.1. Vector auto regression
Through observation of the data of the economy indicators found that economic recession can be indicated from the macro and micro levels respectively. At the macro level, gross domestic product, real interest rate, inflation rate, and unemployment rate have the closest relationship with the economic situation. By combining the above variable with the analysis, a clearer economic trend can be obtained. Simultaneously, sticky price consumer prices and personal saving rates at the micro level can reflect the purchasing power and consumption level of consumers. Through the fluctuation of purchasing power, the expenditure and storage asset ratio can also reflect the economic trend from the side. By integrating data and analyzing various factors and variables, the auto regression model can then be conducted. The general mathematical model for vector auto regression (VAR) model is:
\( {Y_{1}}={{A_{0}}+A_{1}}{Y_{t-1}}+{A_{2}}{Y_{t-2}}+⋯+{A_{P}}{Y_{t-p}}+{ε_{t}} \) (1)
In the formula above: \( {A_{0}} \) is the constant term, and \( {ε_{t}} \) is the error vector.
Table 2: Regression coefficient table
| GDP | CPI | IR | UR | SPC | PSR |
Constant | 1341.003 | 5.107* | -4.149 | -6.685 | 0.198 | -5.172 |
-0.697 | -2.407 | (-0.501) | (-0.877) | -0.571 | (-0.293) | |
L1 GDP | 0.952** | -0.000 | -0.000 | 0.000 | -0.000 | 0.001 |
-16.025 | (-1.771) | (-0.019) | -0.677 | (-0.404) | -0.971 | |
L1 CPI | -52.657 | 0.2 | 1.846 | 0.971 | 0.028 | -0.33 |
(-0.177) | -0.608 | -1.439 | -0.823 | -0.516 | (-0.121) | |
L1 IR | 87.581 | -0.14 | -0.187 | -0.564 | 0.048* | 0.171 |
-0.847 | (-1.227) | (-0.420) | (-1.375) | -2.548 | -0.18 | |
L1 UR | -70.232 | -0.172 | 0.188 | 1.256** | -0.014 | -0.155 |
(-0.726) | (-1.616) | -0.451 | -3.278 | (-0.787) | (-0.175) | |
L1 SPC | -1457.72 | -1.534 | 6.871 | 15.774 | -0.309 | 0.656 |
(-0.637) | (-0.608) | -0.697 | -1.74 | (-0.749) | -0.031 | |
L1 PSR | 109.612 | -0.132 | 0.352 | -0.125 | 0.018 | 0.71 |
-1.28 | (-1.401) | -0.955 | (-0.369) | -1.155 | -0.904 | |
n | 18 | |||||
LLF | -139.322 | |||||
AIC | 20.147 | |||||
SC | 22.224 | |||||
HQIC | 20.433 | |||||
Table 2 shows the regression coefficients of the multiple linear regression equation model. The table shows that the four variables GDP, CPI, UR, and SPC have the most accurate information. The error does not exceed 0.05, showing that these four variables can provide more accuracy. The lag order of the model is at the first level. Generally, the smaller the lag order, and the higher the sample information is available, the more precise the model is.
3.2. Power of different variables
Based on the data in Table 3, the variance decomposition PSR can further be concluded. As one of the main factors that will affect consumers’ willingness to consume, data in Table 3 shows that at short horizons (1-2 lags), the variance is mainly affected by UR (34.13%), CPI (31.342), and IR (14.29%). At short horizons, GDP has a small power in shocking PSR. At medium horizons (3-6), PSR’s power in shocking itself still remains at a low rate. What’s more, CPI and IR are still at a dominant place in affecting PSR and its rate keeps increasing. At these horizons, though the affection brought by UR is not negligible, its influence has begun to decline gradually compared to the first horizons (34.13%-22.46%). Data from long horizons (lag 7-10) demonstrate that PSR is still being dominated by CPI, which consistently explains at rates around 29%-30%, and IR, which sticks around 19%-29%. Variables such as GDP (8.9%) and SPC (14.8%-16.4%)’s power in affecting the rate of SPR continuously increase in these horizons. Above all, the data indicates that PSR is mostly driven by external economic shocks. It is strongly affected by CPI and IR in all time horizons. UR plays an important role in the short term, while GDP and SPC gradually show their importance in the long term.
Table 3: Variance decomposition-PSR
Order | Variance Decomposition | GDP (%) | CPI (%) | IR (%) | UR (%) | SPC (%) | PSR (%) |
1 | 2.904 | 0.817 | 31.342 | 14.290 | 34.132 | 12.436 | 6.983 |
2 | 3.574 | 0.783 | 33.274 | 15.885 | 31.019 | 12.102 | 6.937 |
3 | 4.178 | 1.924 | 33.135 | 17.583 | 28.484 | 12.152 | 6.721 |
4 | 4.707 | 3.355 | 32.242 | 18.327 | 26.732 | 12.640 | 6.705 |
5 | 5.258 | 5.229 | 31.393 | 18.848 | 24.610 | 13.348 | 6.573 |
6 | 5.882 | 7.130 | 30.686 | 19.163 | 22.464 | 14.135 | 6.422 |
7 | 6.642 | 8.914 | 30.162 | 19.420 | 20.379 | 14.881 | 6.244 |
8 | 7.579 | 10.413 | 29.787 | 19.629 | 18.562 | 15.525 | 6.085 |
9 | 8.737 | 11.604 | 29.523 | 19.810 | 17.073 | 16.039 | 5.950 |
10 | 10.151 | 12.511 | 29.331 | 19.957 | 15.920 | 16.433 | 5.847 |
4. Conclusion
In conclusion, although 160 samples are used in this paper, and the error of a portion of data is comparatively small, the other samples with higher errors and are not accurate enough showing that variables selected in this paper and the Vector Auto Regression model used may still not accurately enough to indicate economic changes due to the various influencing factors and the lag in recognizing changes in the economy. However, the existing model and results can show that variables such as the unemployment rate, personal savings, short run, and long-run investment will still be affected by changes in the level of GDP, lowering consumers’ purchasing power and willingness to consume. Personally speaking, in order to better analyze changes in the economy and the further effects brought to consumers, a more accurate and useful model should be applied. Other models can be put into consideration, such as multiple linear regression (MLR), panel model, autoregressive distributed lag (ARDL) model, or simply logistic regression. Through comparing the accuracy of outcomes these models, thus derive the model with a higher accuracy of data processing and analyzing. This paper only used 160 groups of samples as a reference, causing a smaller sample size, although the research uses macro data, which may lead to a bias. Therefore. In order to improve the accuracy of the relative research, more datasets, a wilder sample size, and more diversified variables can be considered to improve the accuracy of models to process data, and further improve the accuracy of the relative analysis.
References
[1]. Alameddine, M., et al. (2012) A Narrative Review on the Effect of Economic Downturns on the Nursing Labour Market: Implications for Policy and Planning. Human Resources for Health, 10, 20.
[2]. Berger, D. and Joseph, V. (2015) Consumption Dynamics during Recessions. Econometrica, 83, 101-154.
[3]. Berger, D. and Joseph, V. (2015) Consumption Dynamics during Recessions. Econometrica, 83, 101-154.
[4]. Danziger, S. (2013) Evaluating the Effects of the Great Recession. The ANNALS of the American Academy of Political and Social Science, 650, 6-24,
[5]. Eggers, A.C., et al. (2021) The Economic Impact of Recession Announcements. Journal of Monetary Economics, 12.
[6]. Ember, S., et al. (2024) Recession Risks Rise as Consumers Turn Cautious. The New York Times, 7.
[7]. Goodwin, N. et al. (2019) Consumption and the Consumer Society. Routledge EBooks, 1, 188-215.
[8]. Méndez-Diaz, N., et al. (2021) The Evolution of Social Media and the Impact on Modern Therapeutic Relationships. The Family Journal, 30.
[9]. Reed, S. and Malik, C. (2014) How Does Consumer Spending Change during Boom, Recession, and Recovery? International Journal of Forecasting.
[10]. Vrontos, S.D., et al. (2021) Modeling and Predicting U.S. Recessions Using Machine Learning Techniques. International Journal of Forecasting, 37, 647-671.
Cite this article
Lyu,Z. (2025). The Impact of Economic Downturn on People’s Perception of Consumption. Theoretical and Natural Science,106,59-63.
Data availability
The datasets used and/or analyzed during the current study will be available from the authors upon reasonable request.
Disclaimer/Publisher's Note
The statements, opinions and data contained in all publications are solely those of the individual author(s) and contributor(s) and not of EWA Publishing and/or the editor(s). EWA Publishing and/or the editor(s) disclaim responsibility for any injury to people or property resulting from any ideas, methods, instructions or products referred to in the content.
About volume
Volume title: Proceedings of the 3rd International Conference on Mathematical Physics and Computational Simulation
© 2024 by the author(s). Licensee EWA Publishing, Oxford, UK. This article is an open access article distributed under the terms and
conditions of the Creative Commons Attribution (CC BY) license. Authors who
publish this series agree to the following terms:
1. Authors retain copyright and grant the series right of first publication with the work simultaneously licensed under a Creative Commons
Attribution License that allows others to share the work with an acknowledgment of the work's authorship and initial publication in this
series.
2. Authors are able to enter into separate, additional contractual arrangements for the non-exclusive distribution of the series's published
version of the work (e.g., post it to an institutional repository or publish it in a book), with an acknowledgment of its initial
publication in this series.
3. Authors are permitted and encouraged to post their work online (e.g., in institutional repositories or on their website) prior to and
during the submission process, as it can lead to productive exchanges, as well as earlier and greater citation of published work (See
Open access policy for details).
References
[1]. Alameddine, M., et al. (2012) A Narrative Review on the Effect of Economic Downturns on the Nursing Labour Market: Implications for Policy and Planning. Human Resources for Health, 10, 20.
[2]. Berger, D. and Joseph, V. (2015) Consumption Dynamics during Recessions. Econometrica, 83, 101-154.
[3]. Berger, D. and Joseph, V. (2015) Consumption Dynamics during Recessions. Econometrica, 83, 101-154.
[4]. Danziger, S. (2013) Evaluating the Effects of the Great Recession. The ANNALS of the American Academy of Political and Social Science, 650, 6-24,
[5]. Eggers, A.C., et al. (2021) The Economic Impact of Recession Announcements. Journal of Monetary Economics, 12.
[6]. Ember, S., et al. (2024) Recession Risks Rise as Consumers Turn Cautious. The New York Times, 7.
[7]. Goodwin, N. et al. (2019) Consumption and the Consumer Society. Routledge EBooks, 1, 188-215.
[8]. Méndez-Diaz, N., et al. (2021) The Evolution of Social Media and the Impact on Modern Therapeutic Relationships. The Family Journal, 30.
[9]. Reed, S. and Malik, C. (2014) How Does Consumer Spending Change during Boom, Recession, and Recovery? International Journal of Forecasting.
[10]. Vrontos, S.D., et al. (2021) Modeling and Predicting U.S. Recessions Using Machine Learning Techniques. International Journal of Forecasting, 37, 647-671.