


1. Introduction
Research & Development spending is typically regarded as one of the key factors in driving firm income, simply because R&D can be viewed as an investment in future innovation, leading to potential increases in product offerings, efficiency, and market share. For instance, Economic theories have explained the connection between R&D expenditure and firm income. Endogenous growth theory holds that investment in human capital, innovation, and knowledge are significant contributors to economic growth [1]. A resource-based view of the firm suggests that R&D provides firms with unique, inimitable resources leading to a competitive advantage [2]. Schumpeter’s theory of creative destruction mentions that technological advancements, often driven by R&D, can radically shift market dynamics and lead to higher income for firms [3].
Apart from theoretical perspectives, mathematical studies have also measured the impact of R&D spending on firm income. Sridhar used a vector auto regression model of a panel of publicly listed U.S. high technology manufacturing firms [4]. Guo stated that increased R&D spending positively affects firm performance for product differentiation firms linearly using Linear regression with R&D intensity (R&D spending as a percentage of operating income) and its square term to test non-linearity [5]. However, this study was limited to Chinese manufacturing firms, reducing generalizability to other regions or sectors. Yilmaz stated that higher R&D expenses were strongly correlated with increased turnover (a proxy for firm income) using linear regression on natural log-transformed data from 2007–2015 [6]. However, this study relied on historical data (up to 2015), which might not reflect current economic trends.
Arilica stated that public expenditure, including components potentially related to research, had a high positive correlation with economic growth in Pakistan using multiple linear regression using ordinary least squares (OLS) on time series data from 1982–2017 for Pakistan [7]. However, its limited sample size (Pakistan-specific) reduced its generalizability. Zou stated that government expenditure, potentially including research, positively affects economic growth in developing countries but negatively in developed ones, implying varying effects on national income by development stage using panel data analysis (not explicitly linear regression in the abstract) on 100 countries from 1970-2001 [8]. However, its extended time frame (1970-2001) might not accurately reflect modern economic dynamics. Piplica stated that R&D expenditure positively influences economic growth in the EU28, suggesting a beneficial effect on national income over the 2002–2012 period using multiple regression model using data from EU28 countries from 2002–2012, while the period ended in 2012, missing recent economic shifts [9].
Vurur stated that R&D expenditure has a one-way causal effect on operational profit in a Turkish pharmaceutical firm using Granger Causality Test on quarterly data from year 2005 to 2015 for a single firm listed on the Borsa Istanbul (BIST) [10]. However, it used Granger Causality rather than linear regression, testing directionality rather than magnitude of effect. In this article, multiple linear regression models are used to study the effect of Research & Development Expenditure on Apple’s net income.
2. Methods
2.1. Data source
The data set used in this paper is fetched and organized from the statista.com website, a reputable statistical database providing comprehensive and verified financial data. It was from 2010 to 2024. The original dataset about Apple Inc was extensive. This research selected 45 of them which are relatively complete and reliable.
2.2. Variable selection
The analysis focuses on 3 key variables which are: Annual Net Income (Y): Apple's annual net earnings, measured in billions of United States Dollar (USD), indicative of financial health. Research & Development Spending (X1): Annual R&D budget allocation, reflecting Apple's commitment to innovation, measured in billions of USD. Advertising Expenditure (X2): Annual spending on promotional activities, influencing consumer demand and brand strength, measured in billions of USD. A summary of the collected data is provided below in Table 1.
Table 1 summarizes Apple Inc.’s financial data from 2010 to 2024, highlighting net income, R&D spending, and advertising expenditures. Net income measures annual profitability after all expenses, indicating financial health. R&D spending shows Apple's yearly investment in innovation, reflecting strategic commitments to new product development and technological advancement. Advertising expenditures represent the budget for marketing activities aimed at boosting brand recognition and consumer demand. Overall, the table illustrates an upward trend in all three metrics, indicating that increased investments in R&D and advertising correlate positively with rising net income, underscoring their importance in Apple's overall growth strategy.
Table 1: List of data
Year | Net Income (in billions of USD) | R&D Spending (in billion USD) | Advertising Expenditures (in billion USD) |
2024 | 93.74 | 31.37 | 3.262 |
2023 | 97 | 29.92 | 3.116 |
2022 | 99.8 | 26.25 | 3.137 |
2021 | 94.68 | 21.91 | 2.747 |
2020 | 57.41 | 18.75 | 2.490 |
2019 | 55.26 | 16.22 | 2.219 |
2018 | 59.53 | 14.24 | 1.947 |
2017 | 48.35 | 11.58 | 1.670 |
2016 | 45.69 | 10.05 | 1.502 |
2015 | 53.39 | 8.07 | 1.800 |
2014 | 39.51 | 6.04 | 1.499 |
2013 | 37.040 | 4.48 | 1.354 |
2012 | 41.73 | 3.38 | 1.020 |
2011 | 25.92 | 2.43 | 0.775 |
2010 | 14.01 | 1.78 | 0.691 |
2.3. Method introduction
The study uses a multiple linear regression model (a regression model that estimates the relationship between a quantitative dependent variable and two or more independent variables using a straight line.) to examine the impact of R&D expenditure on revenue. The regression equation is specified as:
\( y=β+{β_{1}}{x_{1}}+{β_{2}}{x_{2}}+ϵ \) (1)
Where \( y \) is the annual net income, \( {x_{1}} \) is the R&D expenditure and \( {x_{2}} \) is the advertising expenditure. \( β \) represents the y-intercept. \( {β_{1}} \) and \( {β_{2}} \) are the regression coefficients, indicating the change in net income for a one-unit change in R&D or advertising expenditure. And ϵ is the error term.
The model was estimated using the Ordinary Least Squares (minimizing the sum of the squares of the differences between the observed dependent variable, in this case, the annual net income of Apple Inc, in the input dataset and the output of the linear function of the independent variable, in this case, the Research & Development Expenditure). Graphical analysis which means scatter plots with fitted regression lines was also used to visualize the relationship.
3. Results and discussion
3.1. Descriptive statistics
After plotting the data on a graph with Annual Net Income (in billions of USD) on the y-axis and R&D Spending (in billion USD) on the x-axis, orange spots of estimated values and blue spots of actual values, figure 1 is obtained.
The figure 1 reveals a clear upward trend, suggesting a strong positive correlation between Apple’s R&D spending and its net income. As R&D investment increases over the years, the actual net income also generally rises. The fitted regression line closely aligns with actual data points, indicating that R&D expenditures can reliably predict Apple's financial performance. The close proximity of the estimated values to the actual values demonstrates the accuracy of the regression model, validating the conclusion that increased investment in R&D significantly enhances Apple’s profitability.
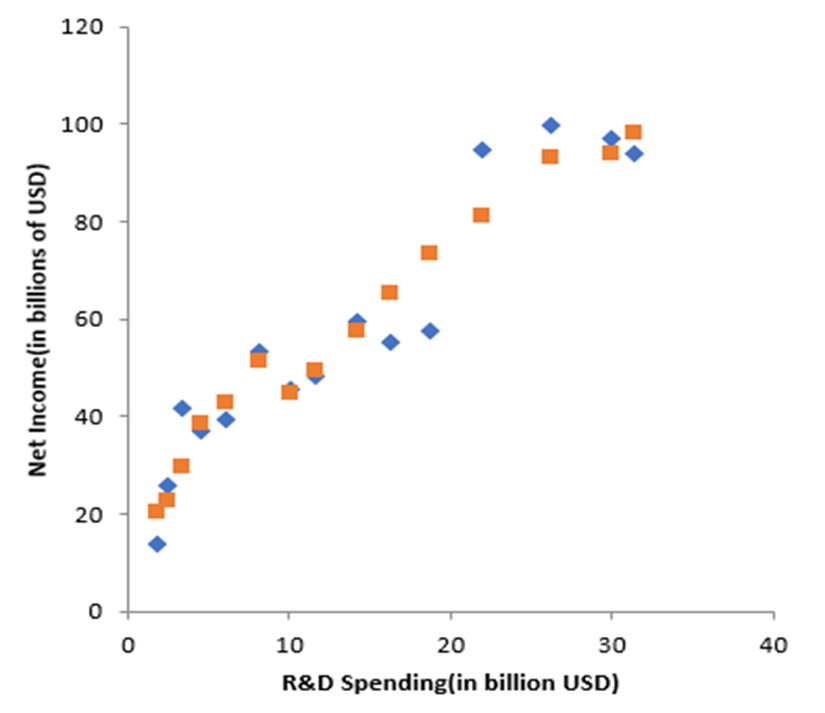
Figure 1: R&D spending (in billion USD) line fit plot
What’s more, figure 2 is obtained by plotting the data on a graph with Annual Net Income (in billions of USD) of y-axis and Advertising Spending (in billion USD) of x-axis, orange spots of estimated values and blue spots of actual values.
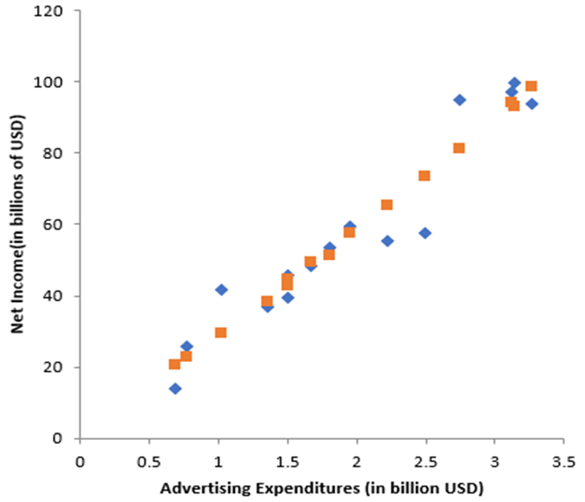
Figure 2: Advertising expenditures (in billion USD) line fit plot
The figure 2 also exhibits a distinct upward trend, indicating a robust positive relationship between advertising spending and net income. The consistent increase in net income alongside higher advertising spending emphasizes advertising’s critical role in enhancing Apple’s revenue. The fitted line closely matches actual data points, signifying a strong predictive capability of the regression model. This alignment underscores the effectiveness of advertising investments in boosting Apple's brand strength, market presence, and financial performance.
3.2. Regression analysis
The regression output is summarized below in Table 2:
\( y=2.240277+0.427859{x_{1}}+25.35549{x_{2}} \) (2)
Table 2: Linear regression results
Parameters | Coefficient | Std. Error | t-value | p-value |
Intercept (β₀) | 2.240 | 0.894 | 2.503 | 0.025 |
R&D Spending (β₁) | 0.427 | 0.054 | 7.876 | <0.001 |
Advertising Spending (β₂) | 25.355 | 3.167 | 8.007 | <0.001 |
R² | 0.917 | |||
Adjusted R² | 0.903 | |||
Correlation | 0.957 |
The results indicate that for every additional billion USD spent on R&D, Apple’s annual revenue increases by approximately 0.438 billion USD (or 438 million USD), holding all else constant. The value of product-moment correlation coefficient is close to 1, suggesting a strong correlation among variables. The high R² and adjusted R² values indicate that over 90% of the variance in Apple's net income is explained by the model, emphasizing the strength and accuracy of the regression analysis (Table 2).
3.3. Implications for Apple
The findings of this study have important strategic implications for Apple, emphasizing the need for continued prioritization of innovation through robust investment in R&D. The strong correlation between Apple’s R&D spending and increased net income indicates that sustained innovation efforts are crucial for maintaining and improving market leadership and financial performance. Apple should consider not only increasing its R&D budget but also strategically focusing its investment areas, such as emerging technologies, consumer electronics, and digital services, to maximize return on investment. Furthermore, Apple's successful integration of advertising strategies highlights the importance of synchronizing marketing efforts with innovation initiatives. This integrated approach can help Apple effectively communicate product innovations to consumers, thereby strengthening brand loyalty and expanding market reach. Finally, Apple can leverage these insights to inform stakeholders, reassuring investors and partners of the firm's strategic commitment to growth through calculated innovation and well-planned advertising campaigns.
3.4. Model limitations
Firstly, the model focuses solely on R&D and advertising expenditure, while other factors (e.g., SG&A, market conditions and employee structures) may also impact income. Secondly, the analysis relies on publicly reported figures, which might have discrepancies or rounding issues. Lastly, correlation identified through regression does not imply causation definitively, highlighting the necessity for further experimental or quasi-experimental approaches to establish direct causality.
4. Conclusion
The analysis robustly demonstrates that Research & Development (R&D) expenditures are critically influential in enhancing Apple Inc.'s annual net income, affirming theoretical perspectives that prioritize innovation as a primary driver of corporate growth. The regression model employed reveals that over 90% of the variability in Apple's net income can be explained by its expenditures in R&D and advertising, reflecting a high level of explanatory power and confidence in the accuracy of these findings.
Strategically, this study emphasizes the significance of ongoing investment in innovation, suggesting that R&D expenditure should continue to be a core component of Apple’s financial and operational strategy. By quantifying the direct financial benefits of increased R&D spending, the analysis provides actionable insights for corporate executives and financial planners aiming to maximize returns on investment and strengthen competitive market positioning. Furthermore, the complementary role of advertising expenditure underscores the importance of integrated marketing and innovation strategies to achieve holistic corporate growth.
However, while this analysis offers compelling evidence regarding the financial benefits associated with increased R&D expenditure, the study acknowledges specific limitations, notably the exclusion of additional factors like market dynamics and administrative costs, which could also significantly impact net income. Additionally, as the findings are based on correlation, future research employing experimental or quasi-experimental methodologies could further clarify causality, enhancing the practical applicability of these insights.
To build upon the current findings, subsequent studies are encouraged to integrate a wider array of influencing variables and leverage advanced econometric techniques. Exploring longitudinal case studies across different sectors could further validate the generalizability of the observed relationships. Ultimately, this analysis reinforces the essential role of strategic R&D investments in corporate profitability and provides a foundation for future research and financial strategy development in innovation-intensive industries.
References
[1]. Aghion, P., Howitt, P., Brant-Collett, M. and García-Peñalosa, C. (1998) Endogenous growth theory. MIT press.
[2]. Wernerfelt, B. (1984) A resource‐based view of the firm. Strategic management journal, 5(2), 171-180.
[3]. Diamond Jr, A.M. (2006) Schumpeter's creative destruction: A review of the evidence. Journal of Private Enterprise, 22(1), 120.
[4]. Sridhar, S., Narayanan, S. and Srinivasan, R. (2014) Dynamic relationships among R&D, advertising, inventory and firm performance. Journal of the Academy of Marketing Science, 42, 277-290.
[5]. Guo, B., Wang, J. and Wei, S.X. (2018) R&D spending, strategic position and firm performance. Frontiers of Business Research in China, 12(14).
[6]. Yilmaz, M. and Yilmaz, O. (2018) Relation of R&D expense to turnover and number of listed companies in all industrial fields. Journal of Open Innovation: Technology, Market, and Complexity, 4(30).
[7]. Arilica, T. (2016) Multiple Linear Regression Analysis on Government Expenditure and Economic Growth. Academia.Education.
[8]. Zou, H.F. and Zhang, B. (2009) The impact of government expenditure on economic growth: How sensitive to the level of development? Journal of International Development.
[9]. Piplica, D. and Aralica, Z. (2016) R&D expenditure and economic growth: EU28 evidence for the period 2002–2012. Economic Research-Ekonomska Istraživanja, 29(1), 1009-1023.
[10]. Vurur, N.S. and Ilarslan, K. (2016) Analysis of the Relationship between R & D Expenditure and Profitability: A Sample Application from BIST. Journal of Multidisciplinary Developments, 1(1), 13-20.
Cite this article
Qiu,Y. (2025). Regression Analysis of Research & Development Expenditure and Annual Net Income: A Case Study of Apple Inc.. Theoretical and Natural Science,109,31-36.
Data availability
The datasets used and/or analyzed during the current study will be available from the authors upon reasonable request.
Disclaimer/Publisher's Note
The statements, opinions and data contained in all publications are solely those of the individual author(s) and contributor(s) and not of EWA Publishing and/or the editor(s). EWA Publishing and/or the editor(s) disclaim responsibility for any injury to people or property resulting from any ideas, methods, instructions or products referred to in the content.
About volume
Volume title: Proceedings of CONF-MPCS 2025 Symposium: Leveraging EVs and Machine Learning for Sustainable Energy Demand Management
© 2024 by the author(s). Licensee EWA Publishing, Oxford, UK. This article is an open access article distributed under the terms and
conditions of the Creative Commons Attribution (CC BY) license. Authors who
publish this series agree to the following terms:
1. Authors retain copyright and grant the series right of first publication with the work simultaneously licensed under a Creative Commons
Attribution License that allows others to share the work with an acknowledgment of the work's authorship and initial publication in this
series.
2. Authors are able to enter into separate, additional contractual arrangements for the non-exclusive distribution of the series's published
version of the work (e.g., post it to an institutional repository or publish it in a book), with an acknowledgment of its initial
publication in this series.
3. Authors are permitted and encouraged to post their work online (e.g., in institutional repositories or on their website) prior to and
during the submission process, as it can lead to productive exchanges, as well as earlier and greater citation of published work (See
Open access policy for details).
References
[1]. Aghion, P., Howitt, P., Brant-Collett, M. and García-Peñalosa, C. (1998) Endogenous growth theory. MIT press.
[2]. Wernerfelt, B. (1984) A resource‐based view of the firm. Strategic management journal, 5(2), 171-180.
[3]. Diamond Jr, A.M. (2006) Schumpeter's creative destruction: A review of the evidence. Journal of Private Enterprise, 22(1), 120.
[4]. Sridhar, S., Narayanan, S. and Srinivasan, R. (2014) Dynamic relationships among R&D, advertising, inventory and firm performance. Journal of the Academy of Marketing Science, 42, 277-290.
[5]. Guo, B., Wang, J. and Wei, S.X. (2018) R&D spending, strategic position and firm performance. Frontiers of Business Research in China, 12(14).
[6]. Yilmaz, M. and Yilmaz, O. (2018) Relation of R&D expense to turnover and number of listed companies in all industrial fields. Journal of Open Innovation: Technology, Market, and Complexity, 4(30).
[7]. Arilica, T. (2016) Multiple Linear Regression Analysis on Government Expenditure and Economic Growth. Academia.Education.
[8]. Zou, H.F. and Zhang, B. (2009) The impact of government expenditure on economic growth: How sensitive to the level of development? Journal of International Development.
[9]. Piplica, D. and Aralica, Z. (2016) R&D expenditure and economic growth: EU28 evidence for the period 2002–2012. Economic Research-Ekonomska Istraživanja, 29(1), 1009-1023.
[10]. Vurur, N.S. and Ilarslan, K. (2016) Analysis of the Relationship between R & D Expenditure and Profitability: A Sample Application from BIST. Journal of Multidisciplinary Developments, 1(1), 13-20.