


1. Introduction
1.1. Problem Background
The most esteemed international athletic event in the world, the Olympic Games also serve as a gauge of a nation's athletic might. Apart from offering a graphic depiction of the achievements of different nations, the Olympic medal table somewhat represents the financial support, athlete training, and investment nations make in sports growth. The medal table's ranking typically causes strong discussion, and the ongoing growth of the worldwide sports business has drawn more national attention to the Olympic Games. Countries should thoroughly investigate the always shifting regulations and main elements influencing the medal table before developing sports-related laws.
1.2. Restatement of the Problem
This article collects the medal tables of past Summer Olympics, information on host countries, the number of events and the performance of participants[1,2], and uses them to predict the medal table of the 2028 Los Angeles Olympics. It analyzes the trends in the performance of countries in competitions and estimates the number of medals that may be won by countries that have not won medals. It also explores the relationship between the type and frequency of competitive events and the number of medals. The following are considered to be the key factors in this paper: the host effect and great coaches and national background. In addition to the main factors, this paper will also consider factors such as the physical condition of the players, audience motivation and sports funding, and select the discriminant features[3,4]. Through case analysis, the model is used to inform the policy-making of the Olympic Committee.
2. Data Overview
2.1. Assumptions
- Assumption 1: A country's performance in past Olympic Games can be used to predict the number of medals it will win in the next Olympic Games.
Justification: Historical medal data reflects a country's traditional strengths in sports and the effectiveness of its training system. If a country has consistently performed well in certain sports, these sports are likely to remain its main source of medals in future Olympic Games.
2.2. Data Preparation
2.2.1. Data Cleaning
For the four csv data files provided, firstly, we eliminated duplicates and outliers, used the mean value filling method for missing values, and modified and merged some country names (e.g., USSR was decomposed into Russia, and East and West Germany were merged into Germany), and then we extracted the host country information from summerOly\_hosts file, and extracted the information of players and their countries as well as the awards from summerOly\_athletes file, and extracted the country award information of each year from summerOly\_medal\_counts file, and extracted the information of each year corresponding to the country award information from summerOly\_medal\_counts file. Then we extracted the host country information from the summerOly\_hosts file, the information about the players and their countries as well as the awards from the summerOly\_athletes file, the information about the awards and the ranking of the countries in each year from the summerOly\_medal\_counts file, and the number of sports programs in each year from the summerOly\_programs file. Finally, we integrate the data from each file into our own dataset.
2.2.2. Data Pre-processing
In this paper, relevant indicators are abbreviated and interpreted. As shown in Table1.
Table 3. Abbreviations and Description for factors
| Former | Glossary | Discription |
| Total events | TE | Number of Olympic events participated in |
| People | POP | Number of participating athletes |
| AD rate | ADR | Proportion of dominant events |
| Host | Host | Binary indicator for host country (1 = host, 0 = non-host) |
| Gold Medals per people | GMP | Gold medals per athlete |
| Total Medals per people | TMP | Total medals per athlete |
| Gold advantage | GAD | Gold medals weighted by dominant events |
| Event scale | ESC | Total events scaled by athletes |
| Host advantage | HAD | Host status weighted by total events |
| Total Medals per event | TME | Total medals per event |
| Gold Medals per event | GME | Gold medals per event |
| Total Medals | TM | Total number of medals |
| Gold | Gold | Number of gold medals |
3. XGBoost Unveils the 2028 Olympic Medal Rac
3.1. Problem analysis
For Task 1: we need to use past data, especially the number of gold medals and total medals won by each country, to guess how the medals will be distributed at the 2028 Olympic Games in Los Angeles. We also need to figure out which countries will do better or worse than they did in 2024. To begin with, we chose a set of indicators and used correlation analysis to determine the most influential ones on Olympic success. They included the number of athletes participating, the dominant sport share, and the host country advantage. In order to find a country's dominant sport share, the number of medals that it possesses in a specific event at the five latest Olympics is taken into consideration. Higher values mean the country is more dominant[5]. Then we used feature engineering to make "number of gold medals per capita," "total number of medals/number of sports," "gold medal advantage," "sport size," and "host country advantage" to see how each of these things affected the number of medals. Then, we normalized the features to make sure that the sizes were all the same. Next, we chose the XGBoost regression model to show the complicated connection between features and award counts. We checked how well the model worked using cross-validation and test sets. Finally, we used the training model to guess the medal table for the 2028 Olympics and figure out which countries are most likely to move up or down through the ranks[6].
3.2. Model establishment
We use XGBoost regression model to predict the number of gold medals and the total number of medals.XGBoost is based on gradient boosting tree, which has the advantages of being efficient, flexible and able to handle nonlinear relationships. XGBoost was chosen because Olympic medal prediction involves multiple complex factors that may have nonlinear relationships, and XGBoost can effectively capture these relationships by constructing multiple decision trees. Feature engineering was performed before modeling and the following mathematical formulas were used to construct the derived features in data preprocessing:
\begin{align*}
TMF &= \frac{TM}{TE} &
GMP &= \frac{Gold}{POP} &
TMP &= \frac{TM}{POP} &
GAD &= Gold \times ADR &
ESC &= TE \times POP &
HAD &= Host \times TE &
\end{align*}
The meanings of the variables among the formulas are shown in Table 1.Then, we used the Pearson correlation coefficient formula for all the characteristics:
Then we calculate the correlation matrix (with \( x_i\) and \( y_i\) as the feature variables, \(n\) as the number of samples, and \( \overline{x}\) and \( \overline{y}\) as the means), and plot it as a heatmap to show the feature correlation, as shown in Fig. 1.
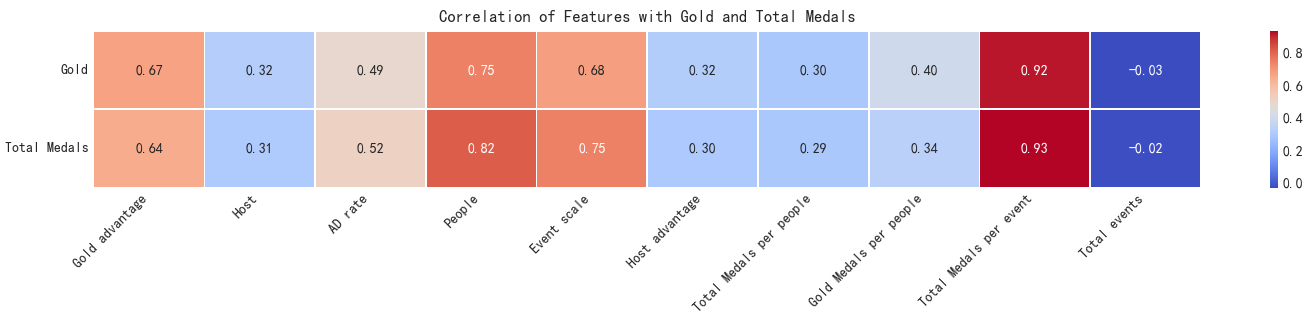
Table 1: Related strength level table
| Range | Relevance |
| 0.8-1.0 | Extremely correlated |
| 0.6-0.8 | Strong correlated |
| 0.4-0.6 | Medium correlated |
| 0.2-0.4 | Weak correlated |
| 0.0-0.2 | Extremely weak or none correlated |
Based on the analysis of Figure 1 and Table 2, it is found that except for the poor correlation of Total events, the correlation of other features is at least above weak correlation, so we can choose all the features except Total events as the indicator
Afterwards, the feature data are standardized to make each feature have the same scale, the formula is as follows:
In Equation (2), \(X\) is the original feature data, \(\mu\) is the mean of the feature, and \(\sigma\) is the standard deviation of the feature. After the data has been pre-processed, it is input into our model for inference. Now, let's say we have n samples, and each sample is defined by \(x_{i}\) and the goal value is \(y_i\) . The objective function of XGBoost can be stated as follows:
included among these
- \(L(y_i,\hat{y}_i)\) is the loss function that measures the difference between the predicted value \(\hat{y}_{i}\) and the actual value \(y_{i}\) . For linear regression problems, the mean square error (MSE) is usually used as the loss function: In our problem, \(y_{i}\) can be the number of gold medals ( \(y_{\mathrm{ Gold}}\) ) or the number of medals ( \(y_{\mathrm{Total}}\) ), and \(\hat{y}_{i}\) is the model's prediction of the number of gold medals or the number of medals.\begin{equation}L(y_i,\hat{y}_i)=(y_i-\hat{y}_i)^2\end{equation}
- \(\Omega(f_{k})\) is the regularization term, which is used to control the complexity of the model and prevent overfitting.The regularization term in XGBoost usually includes the number of leaf nodes of the tree and the weights of the leaf nodes:
Where T is the number of leaf nodes of the tree, \(w_{j}\) is the weight of the jth leaf node, and \(\gamma\) and \(\lambda\) are the regularization parameters. The role of the regularization term is to prevent the model from being too complex, thus avoiding overfitting.\begin{equation}\Omega(f_k)=\gamma T+\frac{1}{2}\lambda\sum_{j=1}^Tw_j^2\end{equation}
By minimizing the objective function, XGBoost can find the optimal decision tree \(f_{k}\) and add it to the model. The weighting results obtained after model training are shown in (a) and (b) of Fig. 2:
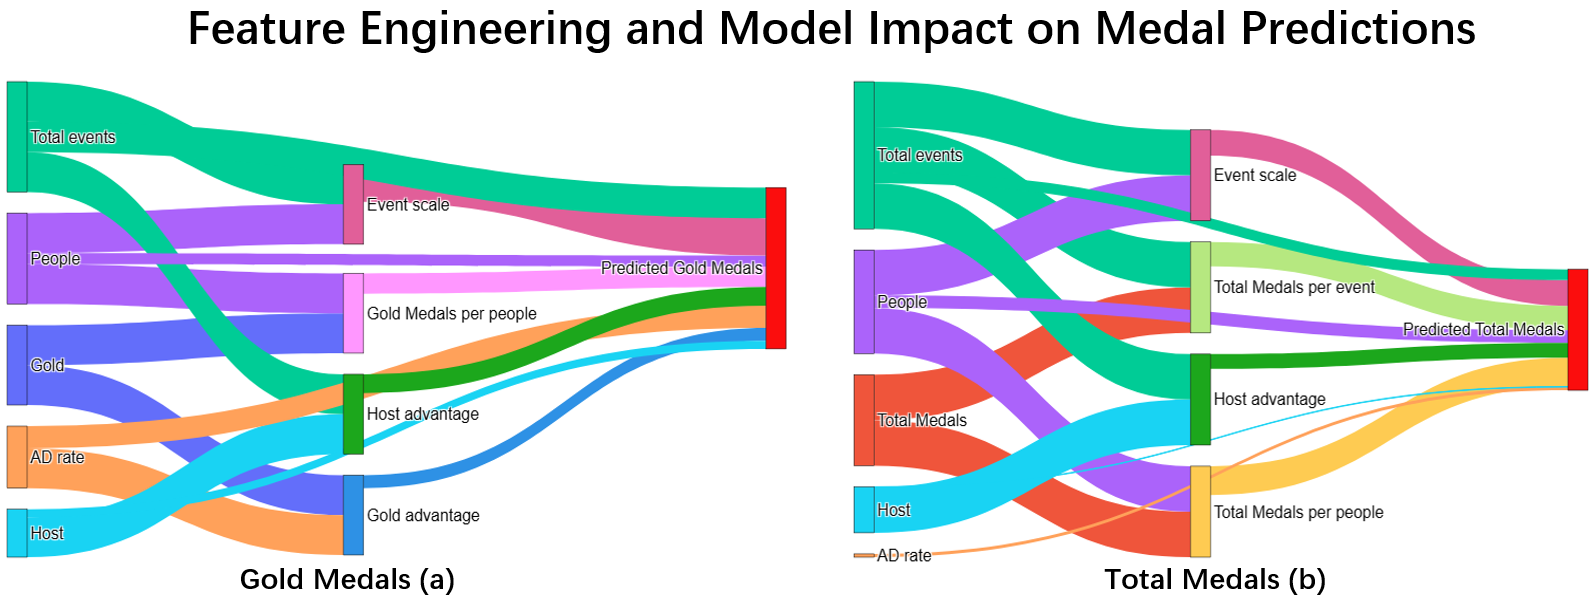
Interpretation for results (a) and (b) of Fig. 2:
- In (a), "gold medal advantage" (GAD) has the largest contribution (32.5%), indicating that the performance of dominant events plays a decisive role in the prediction of the number of gold medals. “Number of Participants” (POP) contributes 28.0%, reflecting that countries with larger numbers of participants have an advantage in the race for gold medals. "Gold Medals Per Capita" (GMP) and "Size of Program" (ESC) account for 10.2% and 8.4% respectively, reflecting the impact of numbers and size of programs. "Host Country Advantage" (HAD) and ‘Host Country Status’ (Host) contribute less (4.7% and 2.0%), indicating that the host country status has a limited impact on the number of gold medals.
- In (b), "TME" contributes the most (53.7%), indicating that overall program performance is decisive for the forecast of the total number of medals. "Program Size" (ESC) accounts for 5.7%, reflecting the impact of program size. "Number of Participants" (POP) and "Total Medals Per Capita" (TMP) contribute less (6.3% and 0.7%), indicating that the number of participants has a limited impact on the total number of medals. The contributions of “Host Country Advantage” (HAD) and “Host Country Status” (Host) are 3.3% and 0.1% respectively, further indicating that the host country status has a small impact on the total number of medals.
Finally, we estimate the accuracy of the model. The evaluation was based on historical Olympic data using the RMSE and \(\mathbb{R}^2\) metrics, with the relevant mathematical formulas as follows:
Where \(n\) is the total number of samples, \(y_{i}\) is the actual value of the \(i\) sample, \(\hat{y}_i\) is the predicted value of the \(i\) sample, and \(\bar{y}\) is the mean value of the target variable. The smaller the RMSE is, the smaller the prediction error of the model is, and the better the accuracy. \({R}^{2}\) is closer to 1, indicating that the model is able to explain most of the variance in the target variable, and the better the fit is; \({R}^{2}\) is closer to 0, indicating that the model's predictive ability is poor.
To better represent the performance of our model, we introduce a linear regression model for comparison. The results are shown in Table 3
Table 2: XGBoost vs Linear Regression: RMSE and \(R^2\) Comparison
| Class | Gold | Total Medals | ||
|---|---|---|---|---|
| RMSE | \(R^2\) | RMSE | \(R^2\) | |
| XGBoost | 1.36 | 0.97 | 2.05 | 0.99 |
| Linear Regression | 3.54 | 0.82 | 3.84 | 0.96 |
According to the data in Table 3, the XGBoost model is significantly better than the linear regression model in the prediction of the number of gold medals and the total number of medals. In the prediction of the number of gold medals, the RMSE of XGBoost is 1.36, while that of linear regression is 3.54, and the \( R^2 \) value of XGBoost is 0.97, while that of linear regression is 0.82, which indicates that XGBoost can more accurately capture the nonlinear relationship between the number of gold medals and each feature. In the prediction of the total number of medals, the RMSE of XGBoost is 2.05, while the linear regression is 3.84, and the \( R^2 \) of XGBoost is 0.99, which is close to a perfect fit, which further proves the advantage of XGBoost in handling complex data.
3.2.1. Result analysis
We randomly selected five countries to make a line graph of predicted and actual results, and their number of gold medals and total medals are shown in Fig. 3.
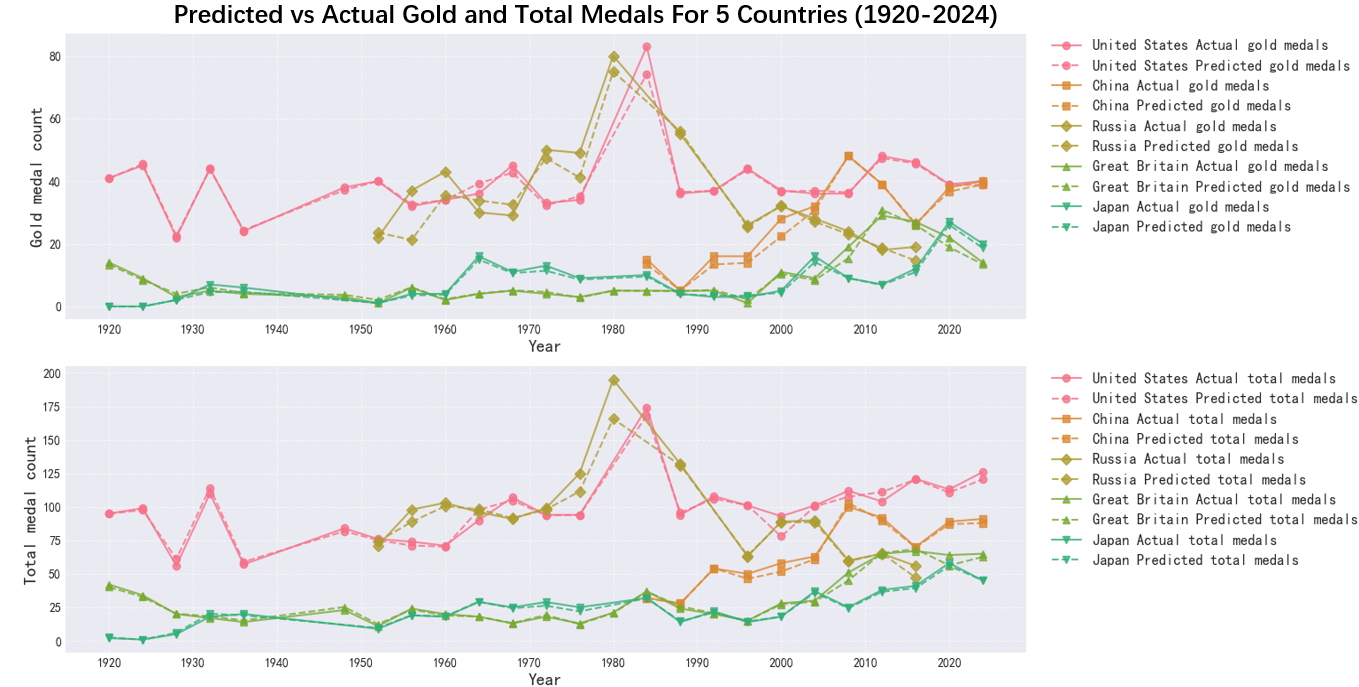
Fig. 3 shows that the predicted values of the XGBoost model are highly consistent with the actual values, especially in the big medal countries such as the United States, China and Russia, where the predicted curves almost overlap with the actual curves, indicating that the model has a high accuracy in predicting the number of medals for these countries.Despite some deviations in the early Olympics, the overall trend matches well, indicating that the model captures the trend of medal count changes in each country well.
Since flag football, cricket, stick tennis, squash and baseball were added to the 2028 Olympics, based on historical data it was determined that these were the dominant sports in the United States, so the ADR indicator for the United States was slightly higher than that of other countries. Substitute the modified data into the model to predict the top 10 countries' results in the 2028 Olympic Games and their comparison with 2024, as shown in Fig. 4.
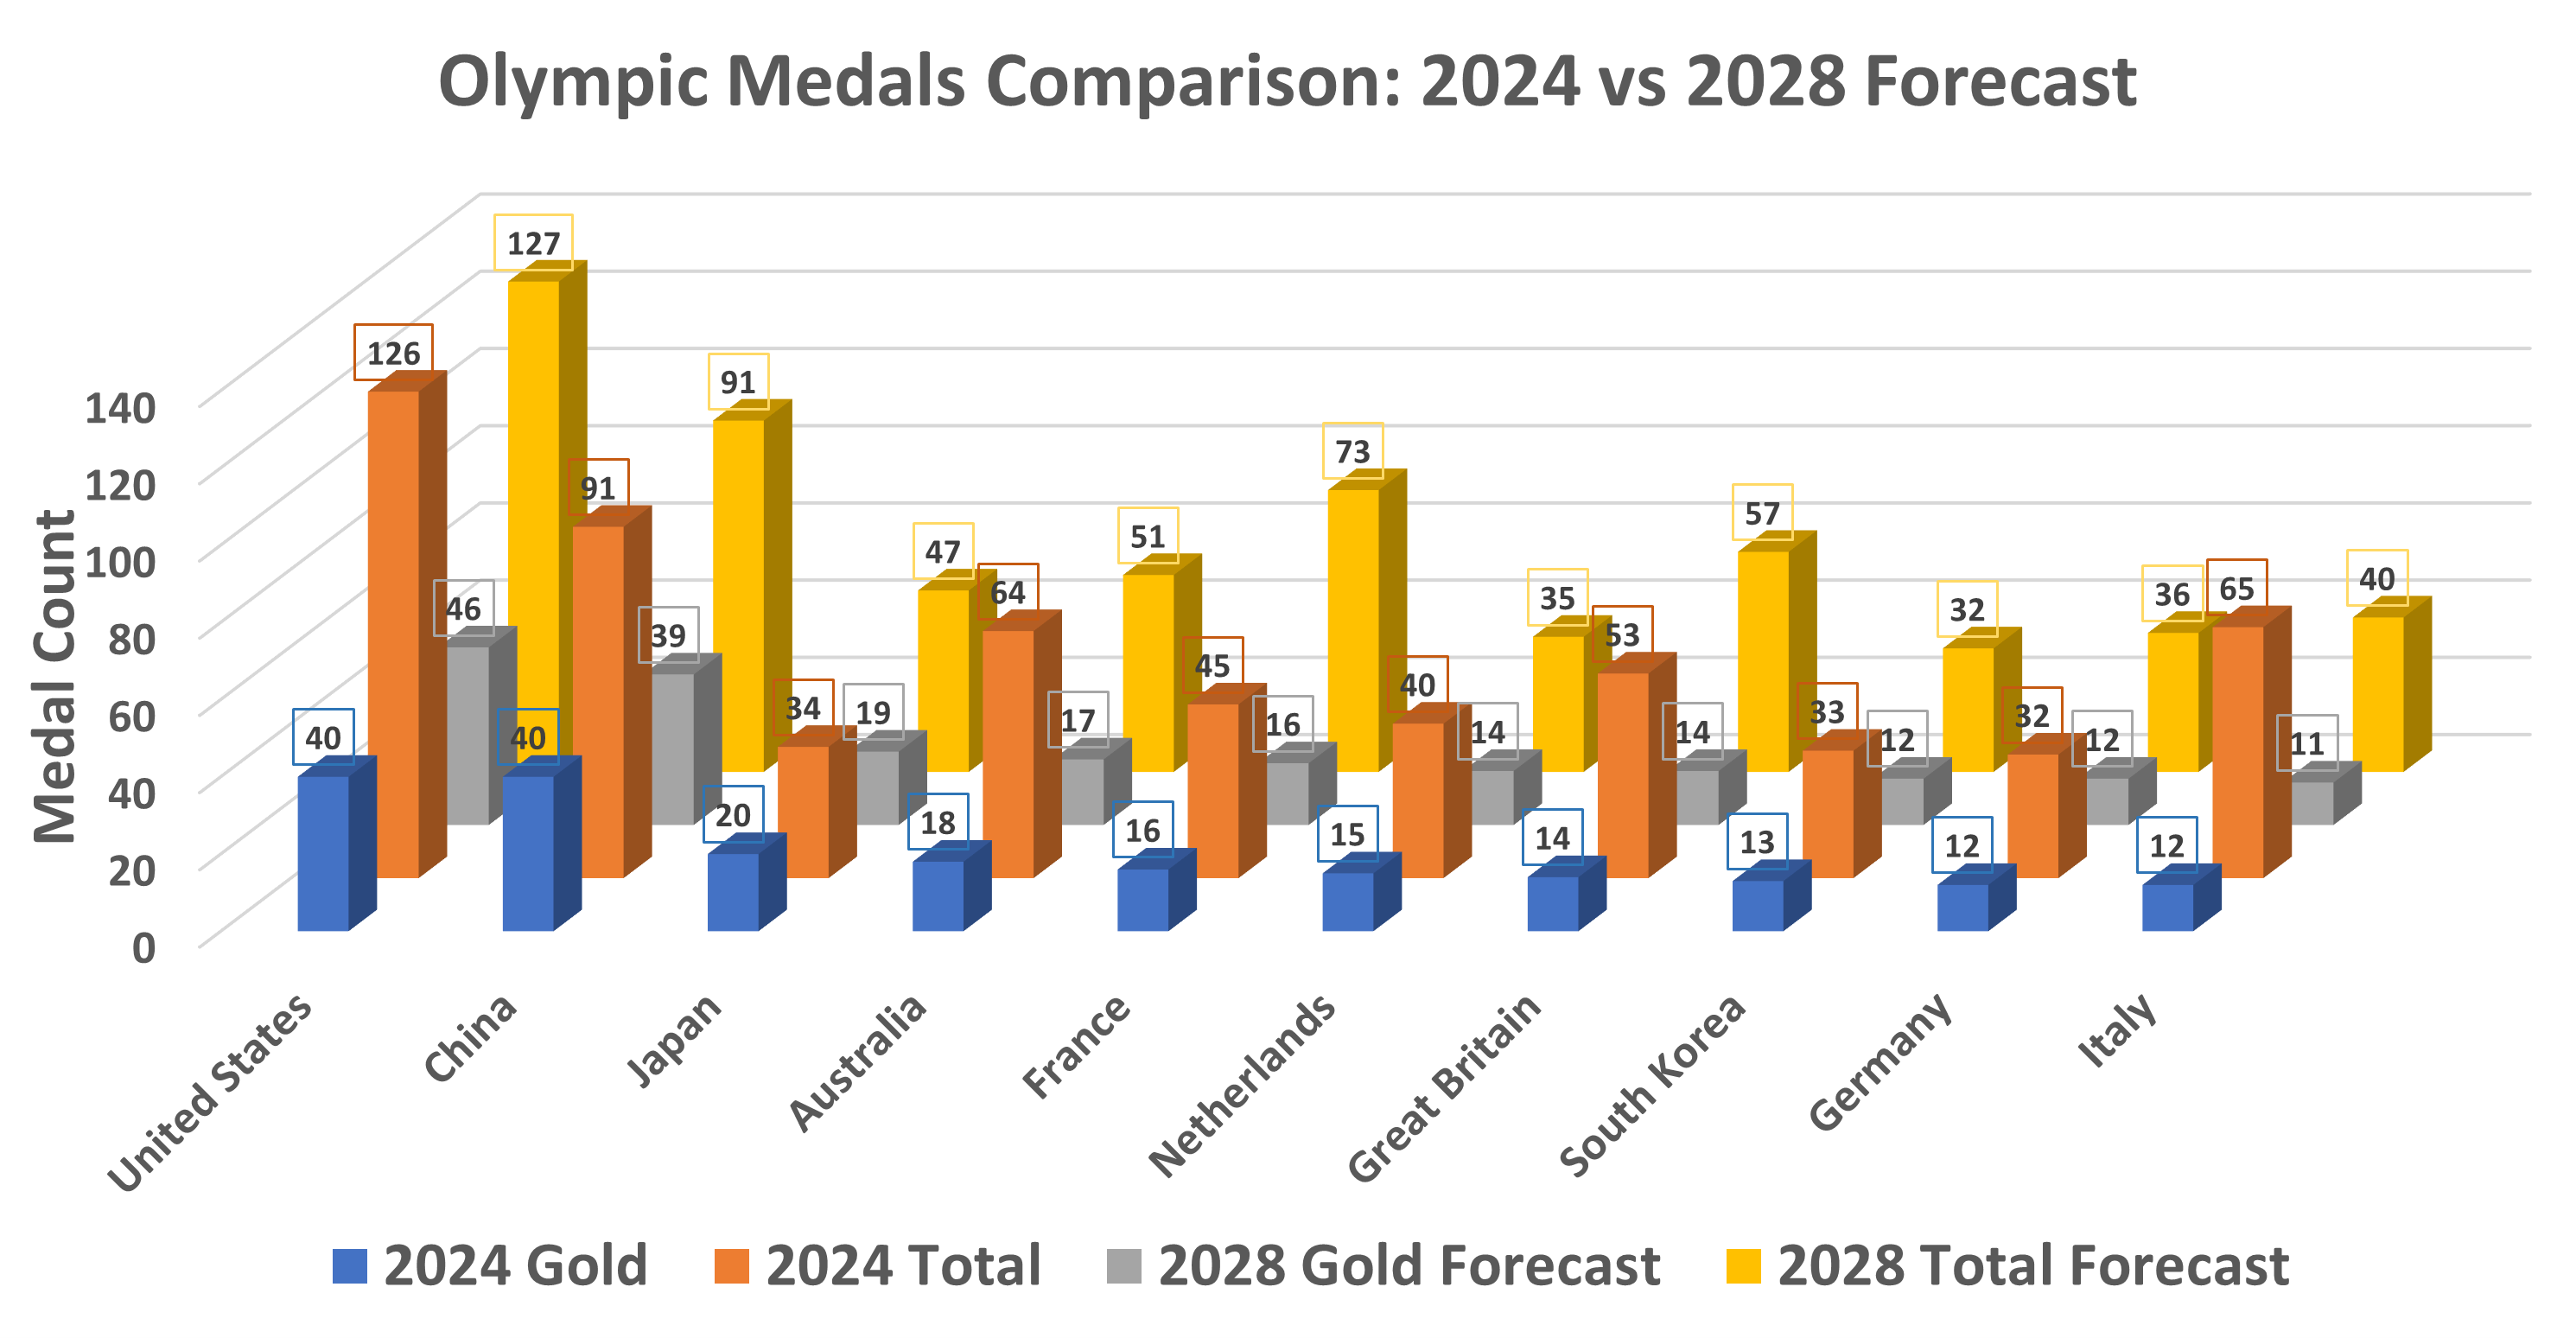
Interpretation of the results of Fig.4: The rankings of the gold medal standings and overall medal standings for the 2028 Olympics are shown in the order on the chart. In the gold medal standings, the United States has improved significantly, while the other countries have remained largely unchanged. In the overall medal standings, France, Great Britain, Japan, and Germany all improved, while Australia, Italy, and the Netherlands regressed, and the other countries remained essentially unchanged. In conclusion, n\_estimators, max\_depth, and learning\_rate have a significant effect on the model. n\_estimators have diminishing returns above 150, max\_depth is best set at 5, and learning\_rate 0.1 performs best. Tuning these hyperparameters is critical to optimizing the model.
4. Conclusion
In this study, we have made significant efforts in analyzing and predicting Olympic medal distribution. By leveraging historical data and advanced machine learning techniques such as XGBoost and Random Forest, we have achieved remarkable results. The XGBoost model has demonstrated outstanding performance in predicting the number of gold medals and total medals for each country in the Olympics. With an value of 0.97 for gold medal prediction and 0.99 for total medal prediction, it outperforms the linear regression model, indicating its strong ability to capture the complex relationships among various factors. Through feature engineering and correlation analysis, we have identified key factors influencing medal counts, such as the number of participants, dominant sport share, and host country advantage. The model's predictions for the 2028 Los Angeles Olympics show that the United States is expected to improve in the gold medal standings, while some countries like France, Great Britain, Japan, and Germany will likely see improvements in the overall medal standings. The Random Forest model has also proven to be effective in assessing the probability of non-medal-winning countries achieving their first medal. With an accuracy of 91 Overall, our research not only provides accurate predictions but also offers valuable decision support for countries in terms of resource allocation and competitive strategy formulation. Future studies could further explore additional factors and refine the models to enhance the accuracy and reliability of the predictions. \addcontentsline{toc}{section}{References}
References
[1]. Yelkur R, Tomkovick C, Pennington J. The alchemy of Olympics advertising & sponsorship: Turning the games into gold[J]. Journal of Management Policy and Practice, 2012, 13(2): 34-45.
[2]. Lee S, Ghaye T, Dixon M, et al. Realising the Olympic dream—bring on the alchemists[M]//Coaching for Performance: Realising the Olympic Dream. Routledge, 2016: 1-12.
[3]. Nevill Alan M, Balmer Nigel J, Winter Edward M. Congratulations to team GB, but why should we be so surprised? Olympic medal count can be predicted using logit regression models that include ’home advantage’. British journal of sports medicine, 46(14), 958-9. (2012).
[4]. Brad R. Humphreys, Bruce K. Johnson, Daniel S. Mason, John C. Whitehead. Estimating the Value of Medal Success in the Olympic Games. Journal of Sports Economics, 19(3), 398-416. (2018).
[5]. Ohl F, Schoch L, Bozzini F, et al. Advocating for athletes or appropriating their voices? A frame and field analysis of power struggles in sport[J]. The Sociological Review, 2024, 72(3): 611-632.
Cite this article
Peng,F.;Qiu,X.;Zou,X.;Deng,J. (2025). Olympic Alchemy: Turning Data into Medals. Theoretical and Natural Science,105,171-178.
Data availability
The datasets used and/or analyzed during the current study will be available from the authors upon reasonable request.
Disclaimer/Publisher's Note
The statements, opinions and data contained in all publications are solely those of the individual author(s) and contributor(s) and not of EWA Publishing and/or the editor(s). EWA Publishing and/or the editor(s) disclaim responsibility for any injury to people or property resulting from any ideas, methods, instructions or products referred to in the content.
About volume
Volume title: Proceedings of the 3rd International Conference on Mathematical Physics and Computational Simulation
© 2024 by the author(s). Licensee EWA Publishing, Oxford, UK. This article is an open access article distributed under the terms and
conditions of the Creative Commons Attribution (CC BY) license. Authors who
publish this series agree to the following terms:
1. Authors retain copyright and grant the series right of first publication with the work simultaneously licensed under a Creative Commons
Attribution License that allows others to share the work with an acknowledgment of the work's authorship and initial publication in this
series.
2. Authors are able to enter into separate, additional contractual arrangements for the non-exclusive distribution of the series's published
version of the work (e.g., post it to an institutional repository or publish it in a book), with an acknowledgment of its initial
publication in this series.
3. Authors are permitted and encouraged to post their work online (e.g., in institutional repositories or on their website) prior to and
during the submission process, as it can lead to productive exchanges, as well as earlier and greater citation of published work (See
Open access policy for details).
References
[1]. Yelkur R, Tomkovick C, Pennington J. The alchemy of Olympics advertising & sponsorship: Turning the games into gold[J]. Journal of Management Policy and Practice, 2012, 13(2): 34-45.
[2]. Lee S, Ghaye T, Dixon M, et al. Realising the Olympic dream—bring on the alchemists[M]//Coaching for Performance: Realising the Olympic Dream. Routledge, 2016: 1-12.
[3]. Nevill Alan M, Balmer Nigel J, Winter Edward M. Congratulations to team GB, but why should we be so surprised? Olympic medal count can be predicted using logit regression models that include ’home advantage’. British journal of sports medicine, 46(14), 958-9. (2012).
[4]. Brad R. Humphreys, Bruce K. Johnson, Daniel S. Mason, John C. Whitehead. Estimating the Value of Medal Success in the Olympic Games. Journal of Sports Economics, 19(3), 398-416. (2018).
[5]. Ohl F, Schoch L, Bozzini F, et al. Advocating for athletes or appropriating their voices? A frame and field analysis of power struggles in sport[J]. The Sociological Review, 2024, 72(3): 611-632.