


1. Introduction
In recent years, in order to promote rapid economic and technological development, human beings have massively expanded urban land and reduced greenfield resources for infrastructure development.
For example, in China, the urbanisation process has accelerated significantly since the reform and opening up (1978), especially in the 1990s when it entered a rapid development phase. The state has concentrated most of its resources on the development of productivity in several key cities, which has directly led to the migration of large numbers of people to these cities. As a result, the land use and land cover change (LUCC) in cities has changed dramatically, and today more than 45 percent of the earth's surface has been converted from its original use due to human activities [1]. However, land use change directly alters the earth's climate change and indirectly exacerbates ecological problems such as the greenhouse effect and the heat island effect.
The changes in the original ecosystem brought about by these phenomena have also attracted the study of scholars around the world. Houghton et al. estimated and analysed the carbon emissions caused by land-use change in the United States from 1700-1990 and found that. Their study showed that since the beginning of the Industrial Revolution, atmospheric carbon dioxide concentrations have increased by nearly 30%; humans have fixed more atmospheric nitrogen than all natural terrestrial sources combined; more than half of all available surface freshwater has been used by humans; and about one-quarter of the planet's birds have become extinct [2]. Hutyra et al. studied the impacts of land cover change on the Seattle metropolitan area of the USA on the terrestrial carbon stocks and its relationship to urban expansion, finding that land use change released 27 ± 6 pb of carbon to the atmosphere before 1945 and accumulated 2 ± 2 pb of carbon after 1945, and that in the 1980s, net fluxes of carbon from land management offset between 10 and 30 percent of fossil fuel emissions in the United States [3]. Both studies illustrate that land use change can have a large impact on ecology and carbon sinks. In addition, Ding Haiyong et al. analysed the urban heat island in Nanjing, China, from 2000 to 2015, and found that the year-round temperature in urban areas was higher than that in suburban areas and that the intensity of the heat island continued to increase with the development of the city [4]. Related studies have pointed out that in the early to mid-20th century, high-resolution aerial photographs were taken by aeroplanes carrying film cameras, and then the types of features in the photographs, such as buildings, roads, and bodies of water, were manually interpreted visually. This led to limitations in labour costs, efficiency and accuracy. However, analyses through satellite remote sensing have the advantages of greater range coverage, access to multi-dimensional data and all-weather and all-day working hours, which make the results more comprehensive and efficient.
For China's recent high-intensity development, it is of great significance to re-plan the proportion of urban land use to ensure sustainable development and ecological health. This paper is based on time series and takes Shanghai, one of China's development centers, as the study area. Using remote sensing technology, it discusses the trend of land use classification changes in Shanghai city, as well as the changes in heat island intensity and carbon sink efficiency in Shanghai in corresponding years. It then speculates on future environmental changes to provide a basis and argument for future urban development and rational land use planning.
2. Overview of the study area
Located at 31.23°N, 121.47°E, Shanghai is situated in the eastern part of the Yangtze River Delta, bordered by the East China Sea in the east, Hangzhou Bay in the south, Jiangsu Province and Zhejiang Province in the west, and the mouth of the Yangtze River in the north [5]. The city's topography is dominated by plains, accounting for about 99% of the city's area, and is a typical estuarine alluvial plain with low relief and an average elevation of about 4 metres above sea level; sporadic distribution of residual hills is mainly concentrated in the western part of the city, and Sheshan is the highest point in the territory, with an elevation of 100.2 metres above sea level. Shanghai has a subtropical monsoon climate, with four distinct seasons, hot, humid and rainy summers, and mild winters with little rain. The average annual temperature is 16.5℃, the annual sunshine hours are about 1,900 hours, and the frost-free period reaches more than 230 days. The average annual precipitation is about 1,200 mm, and most of the precipitation is concentrated from May to September, with significant precipitation during the rainy season and typhoon season [6]. According to the seventh national census, as of 1 November 2020, the resident population of Shanghai was 24.87 million. Shanghai as the economic centre of China for urban expansion and land use classification changes in recent times is particularly obvious, so the Shanghai administrative planning area was selected as the study area of this paper, see Figure 1.

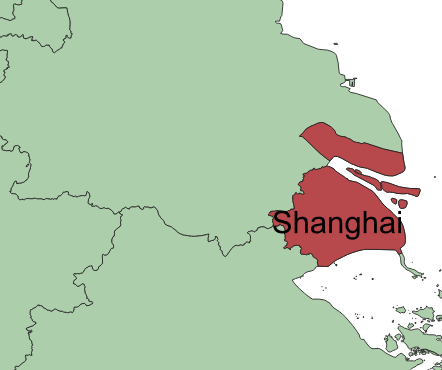
Figure 1: Geographical location of the study area
3. Data processing and research methodology
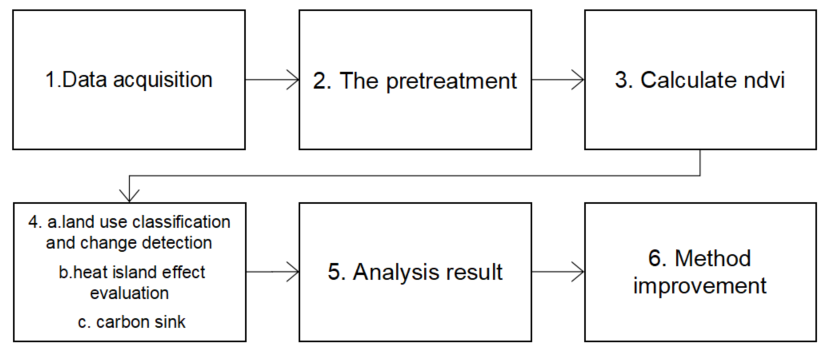
Figure 2: Research process
Figure 2 shows that this text search for suitable data through the geospatial data cloud firstly, then this text pre-process the existing data in remote sensing software. Thirdly, the Normalized Difference Vegetation Index (NDVI) was calculated as the basis for the next study, and fourthly, land use maps, Land Surface Temperature maps, and carbon distribution maps were made and analysed for their impacts. Finally, the methodology used was improved.
3.1. Data sources
Remote sensing data contains Landsat OLI images (2010-2020, spatial resolution 30m) and Sentinel-2 MSI images (2015-2023, spatial resolution 10m), which are used to extract the spatial distribution of urban built-up areas and green spaces.
MODIS LST product (MOD11A2, 2010-2023, 1km spatial resolution) to support spatial and temporal analyses of the heat island effect.
The MODIS NDVI (MOD13Q1, 2010-2023) was selected as the vegetation index data for this study. The spatial resolution of this data is 250m, which can assist in the calculation of carbon sink efficiency.
3.2. Data processing
Data preprocessing mainly includes atmospheric correction, radiometric calibration, cropping and fusion of images of the study area. QGIS was used to classify the land types in Shanghai into six land types: building land, forest land, farmland, grassland, water and other land. The surface temperature inversion was performed using Landsat data in ENVI using the single window algorithm [7], with the equation:
\( LST=\frac{BT}{γ(l+(\frac{λ\cdot BT}{ρ})lnϵ)}+δ⋯γ=\frac{{λ^{4}}{L_{λ}}}{{c_{l}}}⋯δ=BT-γ \) (1)
Geometrically correct all data in QGIS to standardise coordinates to WGS 1984 UTM Zone 51N to ensure accuracy in overlaying different layers.
3.3. Research methodology
3.3.1. Quantifying the dynamics of urban green space expansion and contraction
The rate of urban expansion is calculated by using the urban area in different years, and the rate of green space shrinkage is calculated by using the green space area in different years.
3.3.2. Land use classification
According to the Current Land Use Classification and the Third National Land Survey, land is mainly divided into three categories, i.e. agricultural land, construction land and unused land. Agricultural land includes arable land, garden land, forest land and grassland. Construction land includes urban and rural residential land, industrial and mining land, transport land, water conservancy facility land, special land, etc. Unused land includes sandy land, bare land, etc [8].
From the geographical background of Shanghai, Shanghai is located in southeastern China, at the mouth of the Yangtze River, and belongs to the Yangtze River Delta Plain region. The terrain is low and flat, with a dense river network. Historically, it was an important agricultural area. With the rapid development of urbanisation, a large amount of agricultural land has been converted into construction land, resulting in a reduction of arable land and an increase in impermeable surfaces. Meanwhile, land reclamation and river regulation may have changed the distribution of water bodies. Therefore, in this study, this text mainly divide Shanghai into three parts: farmland, water and impervious surface.
3.3.3. Heat island monitoring methods
Surface temperature is the temperature that can be detected on the surface of the city, which is influenced by the distribution of different land uses such as building land, forest land, agricultural land, and so on, as well as by the development of the society [9]. Because of the heat island effect, the temperature in the suburbs is much lower than in the city centre. The heat island effect needs to be controlled in order to maintain the sustainable and healthy development of the city.
By analysing the LST images of each year, the trend of the percentage of high temperature zone, medium temperature zone and low temperature zone in Shanghai, thus the trend of the change of the impact of the heat island effect in Shanghai can be derived.
3.3.4. Analysing carbon emission effects by land use types
According to the IPCC's carbon emission accounting study, the main pathways of carbon emission are fossil fuel combustion, industrial and agricultural production and land use change, etc. This paper focuses on analysing the effect of land use. The focus of this study is to analyse the effect of carbon emissions caused by land use changes, so this study uses the six land use types of the previous land use classification to analyse the effect of carbon emissions, namely forest land, grassland, watersheds, farmland, construction land and other land use [10]. Among them, construction land and arable land are the main land use types that cause carbon emission effects, while woodland, grassland, water and other land use types are capable of carbon sequestration. What is more special is that arable land emits CH4 and CO2 into the atmosphere during agricultural production on the one hand, and on the other hand, it continuously absorbs CO2 from the atmosphere during the reproductive period of crops, so arable land experiences both carbon emission and carbon sequestration effects at the same time [4].
Carbon emission estimation model:
\( E=∑{τ_{i}}=∑{S_{i}}\cdot {δ_{i}}\cdot ⋯\cdot {E_{t}}={E_{f}}{σ_{f}}+{E_{m}}{σ_{m}}+{E_{n}}{σ_{n}}(construction) \) (2)
Therefore, different land use types such as agricultural land, forest land and urban land have different carbon emission targets. The carbon emission estimation model is used to calculate the carbon dioxide absorbed or emitted per square hectare by different land use types. Finally, the carbon conversion efficiency of each type of land use in each year is calculated and compared by the annual land use classification [11].
4. Analysis of results
4.1. Changes in land use rate
Figure 3 shows the land use classification of Shanghai in 2000, 2005, 2010, 2015 and 2020. The method used in the text is supervised classification. The yellow part is farmland, the blue part is water body, and the pink part is impervious surface. It can be clearly seen that imperviousness is mainly concentrated in the city centre of Shanghai and distributed along both sides of the river, and the area of the impervious part gradually increases. The farmland portion is mainly distributed in the periphery of the city and Chongming District, and the two islands are located in the northern part of the map. Its area decreases from 2000 to 2020. There is basically no significant difference with the water body part. It is dominated by rivers, such as the Huangpu River, the water bodies between Chongming Island and the main body of Shanghai, Dianshan Lake. In addition, I would like to point out that the area of Shanghai is actually expanding. in 2000, the part in the lower right corner was still a body of water, which was gradually turned into land in the following years of development.
Similarly, to ensure the objectivity and correctness of the results, K-means classification, which is unsupervised classification, is used in this paper. The yellow part is the impervious surface, the dark blue part is the water body and the light blue part is the agricultural land. The result proved to be not significantly different from the previous supervised classification.
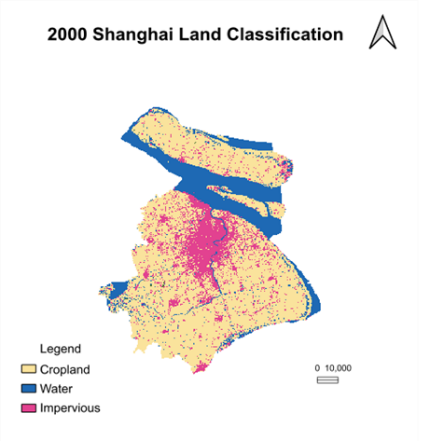
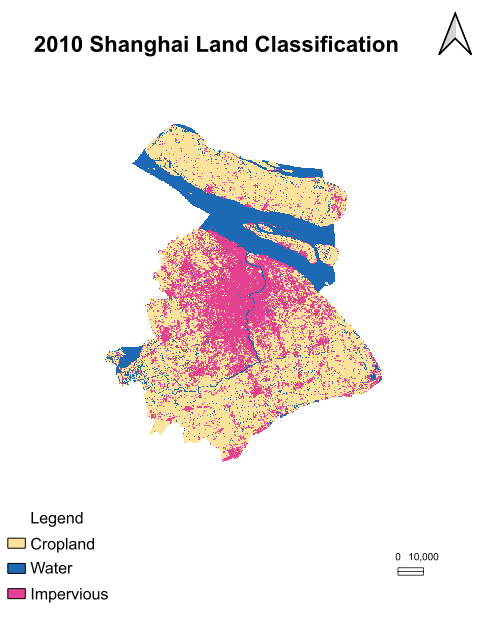
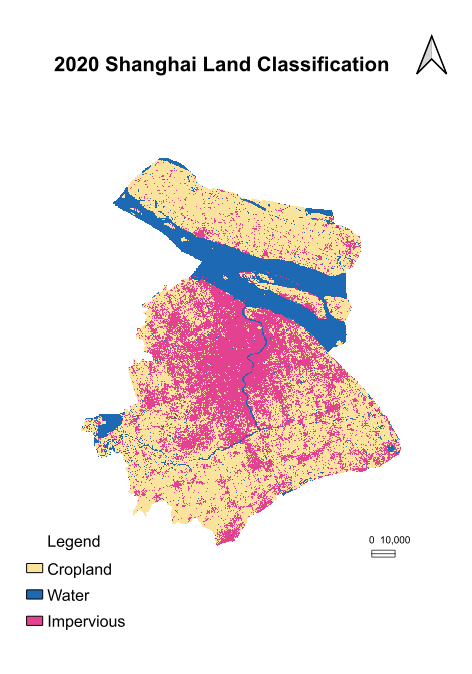
Figure 3: Distribution of land use in Shanghai (2000-2020)
This study gives a breakdown of the three land use types in the form of a pie chart, showing the changes in their proportions, and concludes that the proportion of impervious surfaces in Shanghai shows a clear upward trend from 2005 - 2020, while the proportions of farmland and water bodies show a gradual decline.
The increase in cropland is particularly pronounced and the decrease in cropland is very fast, reflecting the fact that Shanghai has been developing rapidly from 2000 - 2010, and that overall Shanghai has been in the midst of development. The portion of water bodies is relatively stable with a slight decrease.
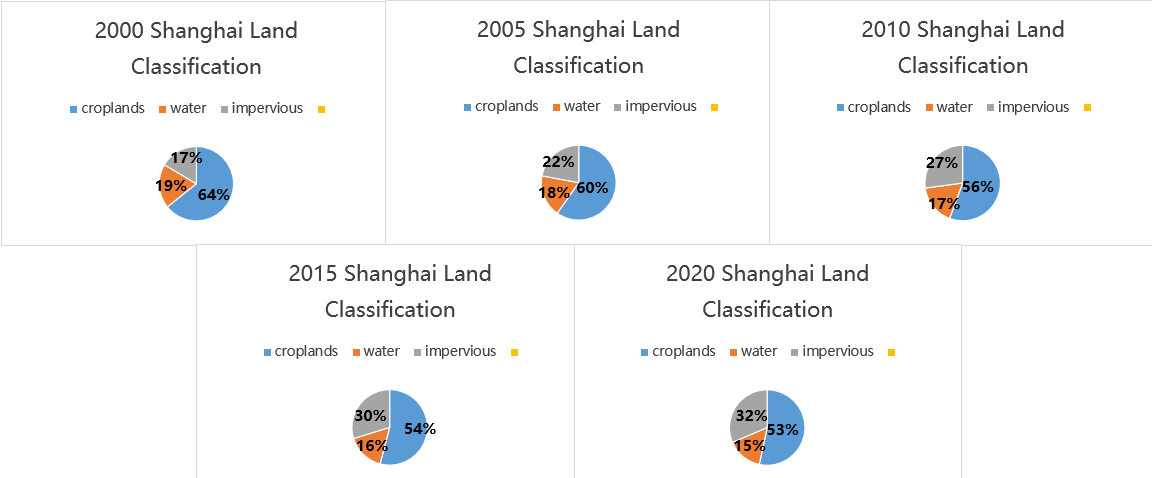
Figure 4: Distribution of the share of land use types in Shanghai (2000-2020)
4.2. Changes in heat island effect
In order to show the change of the heat island effect in Shanghai more intuitively, this paper only shows three maps in 2010, 2015 and 2020 in Figure 5. The maps clearly show the location of high temperature zone, medium temperature zone and low-temperature zone, and the heat island effect can also be clearly seen that the average surface temperature in Shanghai maintains a small upward trend from 2000 - 2020. However, the LST plot shows that the maximum temperature difference between different areas of Shanghai has been decreasing every year, with from about 48 degrees Celsius in 2010 to about 36 degrees Celsius in 2015 and 2020. It drops by about 12 degrees Celsius, which is a big change
In addition, based on the proportional change of different temperature changes, it can be concluded that from 2010 - 2015, Shanghai is still in a stage of rapid development and the city continues to expand, resulting in more high-temperature areas in the city centre, but the heat island effect is weakened due to the smaller temperature difference. However, there are still many areas affected by the heat island effect.
By 2020, Shanghai still maintains a less large temperature difference, while the occurrence of high temperature zones decreases. This results in fewer areas affected by the heat island effect.
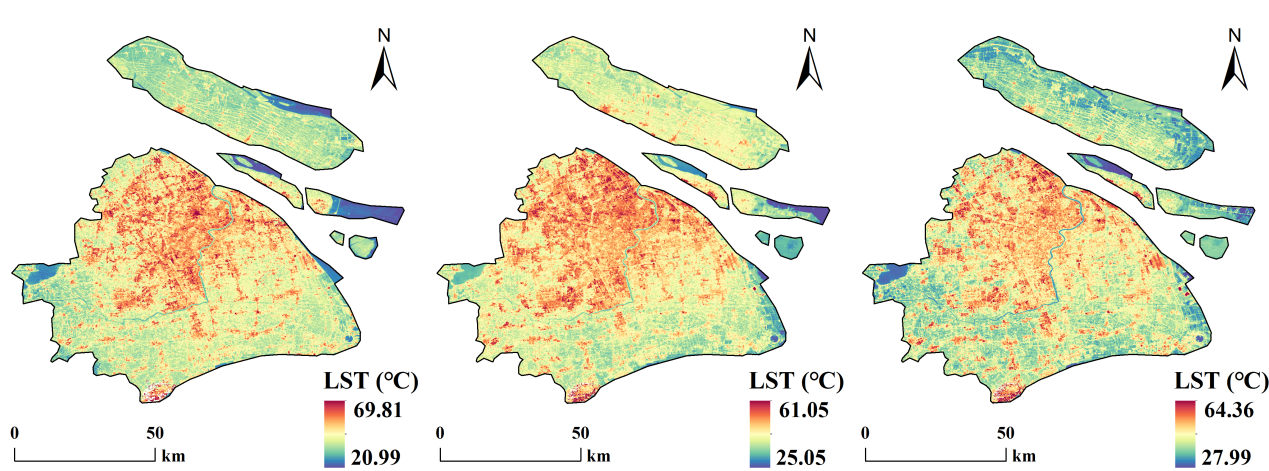
Figure 5: Inverse map of surface temperature in Shanghai city
4.3. Trend of carbon sink efficiency
According to the calculation of the valuation model, the amount and proportion of carbon emissions and carbon absorption on various types of land use in Shanghai from 2010 to 2020 are derived. From the Table 1, it can be seen that negative values are in green and positive and negative values are in red.
Among the land use types in Shanghai, forest land, grassland, water bodies and other land are carbon sinks, while construction land and arable land are carbon sources. From the green part this text can also see that forest land has the strongest carbon sequestration capacity, followed by water, grassland and other land. Construction land has the greatest impact on carbon emissions, followed by forests, and the remaining four categories have less of an impact.
Over time, the impact of construction land on carbon emissions is decreasing, while the carbon sink effect of forest land is increasing.
Table 1: Trend of carbon emission/absorption and share of each land use type, 2010-2020
Land Use Type | 2010 | 2015 | 2020 | |||
Carbon emission /104t | proportion/% | Carbon emission /104t | proportion/% | Carbon emission /104t | proportion/% | |
forestland | -286.1934 | 13.5433 | -269.6527 | 12.5843 | -479.7971 | 28.8710 |
grassland | -0.0034 | 0.0002 | -0.0027 | 0.0001 | -0.0277 | 0.0017 |
water | -6.8918 | 0.3261 | -6.5494 | 0.3056 | -4.8337 | 0.2909 |
farmland | 9.3536 | 0.4426 | 9.4331 | 0.4402 | 7.9799 | 0.4802 |
construction | 1810.7231 | 85.6876 | 1857.1333 | 86.6696 | 1169.2269 | 70.3563 |
others | -0.0018 | 0.0001 | -0.0019 | 0.0001 | 0 | 0.0000 |
Also based on this for the four land use types of carbon which are carbon source, carbon sink, carbon neutral and carbon storage, the results of the visualisation distribution are derived:
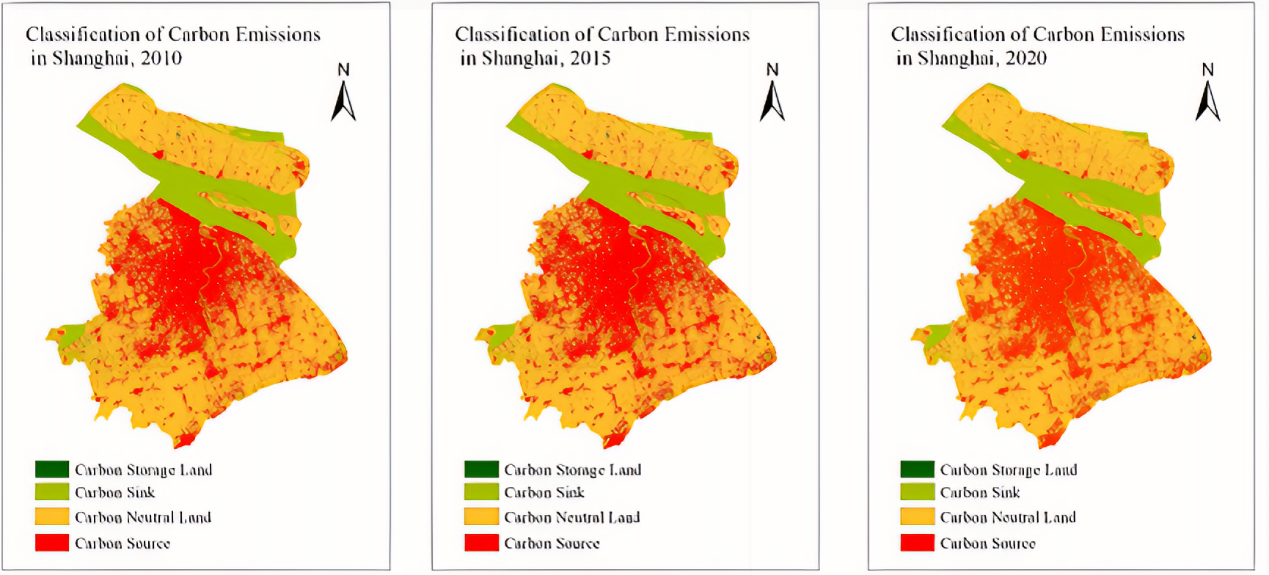
Figure 6: Spatial pattern of carbon sources-sinks and the visualised distribution of sustainable land use in Shanghai
Categorised according to land use types and carbon emissions, the areas of each category are not equal. Firstly, the area of land with carbon stock represented by the dark green part in Figure 6 is very small, which indicates that the area of forests and ecological wetlands in Shanghai is more limited and needs to be improved urgently. Second, the area of construction land (i.e., the red part of the figure) as a carbon source has decreased from 2015 to 2020. This is closely related to the planning policies of the Shanghai Municipal Government. For example, the Pudong New Area Land Use Master Plan, approved in 2014, clearly states that the scale of construction land should be strictly controlled, and the task of reduction outside the centralised construction area reaches 80 square kilometres. Through the centralised construction model, the efficiency of land use will be enhanced and the need for new construction land will be reduced. At the same time, the policy encourages the replenishment of arable land and the strengthening of the protection of basic farmland, increasing the area of arable land and ecological land, optimising the land-use structure and promoting the high-quality development of the city.
5. Conclusions
In this paper, the trends of heat island effect and carbon distribution in Shanghai from 2010 to 2020 are investigated based on the change of land use classification and NDVI assistance. It was found that the green space area of Shanghai decreased from 2010 to 2015 due to the high speed of economic development, but with the government's emphasis on environmental issues, the green space area increased significantly in 2020, and the area of building land also decreased through the reduction of useless buildings. Therefore, this paper finds that the heat island effect and carbon distribution in Shanghai also follow the same trend as the land use classification, showing an increase and then a decrease.
In addition, different areas of Shanghai have different development goals. In areas such as Huangpu and Xuhui, Shanghai has always maintained a large proportion of building land. This has led to them being high-temperature and carbon-emitting areas. Suburban areas such as Songjiang and Fengxian districts, where Shanghai maintains a large proportion of agricultural and forest land, are mostly low-temperature zones and do not become a source of carbon. The eastern part of Shanghai, such as Pudong, where building land has risen sharply since 2000 and has only begun to slow down in recent years, is not as bad as the central part of the city but is also mostly a medium-high temperature and carbon source area until 2015.
However, due to the resolution of the data and some missing for the land use classification is not fine enough, this paper does not separate lakes and oceans, woodlands and grasslands and other sub-division of the land use area, so this will affect the accuracy of the subsequent analysis. In the future, the land use distribution of Shanghai can be comprehensively scanned by using commercial satellites with higher accuracy or by using new drone technology.
Finally, it is hoped that the analyses in this paper will help to predict changes in the heat island effect and carbon distribution in Shanghai in the coming years to help achieve the city's climate adjustment and dual carbon goals.
References
[1]. Vitousek, P.M.; Mooney, H.A.; Lubchenco, J.; Melillo, J.M. Human domination of earth’s ecosystems. Science 1997, 277, 494–499.
[2]. Houghton R A, Hackler J L, Lawrence K T. The U S. Carbon buget: contributions from land-use change. Science, 1999, 285 ( 5427) : 574-578.
[3]. Huty R, Yoon R, Hepinstall-Cymerman J, et al. Carbon consequences of land cover change and expansion of urban lands: A case study in the seattle metropolitan region . Landscape Urban Plan, 2011, 103( 6) : 83-93.
[4]. Han Pengpeng, Chen Jinsong, Han Yu. Research on Carbon Emission Effects of Regional Land Use Change Based on Remote Sensing [C]// Editorial Board of Environmental Engineering, Industrial Building Magazine Co., Ltd. Proceedings of the 2018 National Academic Conference of Environmental Engineering (Volume II). Space Information Research Center, Shenzhen Institutes of Advanced Technology, Chinese Academy of Sciences; Urban Traffic Planning Institute of Huizhou City; 2018: 887-892.
[5]. Xin X, Zhang T, He F, et al. Assessing and simulating changes in ecosystem service value based on land use/cover change in coastal cities: A case study of Shanghai, China[J]. Ocean & Coastal Management, 2023, 239: 106591
[6]. Cui L, Shi J. Urbanization and its environmental effects in Shanghai, China[J]. Urban Climate, 2012, 2: 1-15.
[7]. Abera B. Evaluation of Urban Thermal Environment Variation and Stress Using Remote Sensing Imagery and QGIS for Sustainable Urban Development over Adama City, Ethiopia[J]. 2024.
[8]. Yin J, Yin Z, Zhong H, et al. Monitoring urban expansion and land use/land cover changes of Shanghai metropolitan area during the transitional economy (1979–2009) in China[J]. Environmental monitoring and assessment, 2011, 177: 609-621.
[9]. Nakata-Osaki C M, Souza L C L, Rodrigues D S. THIS–Tool for Heat Island Simulation: A GIS extension model to calculate urban heat island intensity based on urban geometry[J]. Computers, Environment and Urban Systems, 2018, 67: 157-168.
[10]. Houghton R A, House J I, Pongratz J, et al. Carbon emissions from land use and land-cover change[J]. Biogeosciences, 2012, 9(12): 5125-5142.
[11]. Débora Joana Dutra et al. Challenges for reducing carbon emissions from Land-Use and Land Cover Change in Brazil[J]. Perspectives in Ecology and Conservation, 2024, 22(3) : 213-218.
Cite this article
Zhang,Z. (2025). RS-based Analysis of the Impact of Land Use Change on Hotspot Effect and Carbon Distribution in Shanghai (2010- 2020). Theoretical and Natural Science,102,60-68.
Data availability
The datasets used and/or analyzed during the current study will be available from the authors upon reasonable request.
Disclaimer/Publisher's Note
The statements, opinions and data contained in all publications are solely those of the individual author(s) and contributor(s) and not of EWA Publishing and/or the editor(s). EWA Publishing and/or the editor(s) disclaim responsibility for any injury to people or property resulting from any ideas, methods, instructions or products referred to in the content.
About volume
Volume title: Proceedings of ICEGEE 2025 Symposium: Impact of Technological Innovation on Energy Efficiency in European Countries
© 2024 by the author(s). Licensee EWA Publishing, Oxford, UK. This article is an open access article distributed under the terms and
conditions of the Creative Commons Attribution (CC BY) license. Authors who
publish this series agree to the following terms:
1. Authors retain copyright and grant the series right of first publication with the work simultaneously licensed under a Creative Commons
Attribution License that allows others to share the work with an acknowledgment of the work's authorship and initial publication in this
series.
2. Authors are able to enter into separate, additional contractual arrangements for the non-exclusive distribution of the series's published
version of the work (e.g., post it to an institutional repository or publish it in a book), with an acknowledgment of its initial
publication in this series.
3. Authors are permitted and encouraged to post their work online (e.g., in institutional repositories or on their website) prior to and
during the submission process, as it can lead to productive exchanges, as well as earlier and greater citation of published work (See
Open access policy for details).
References
[1]. Vitousek, P.M.; Mooney, H.A.; Lubchenco, J.; Melillo, J.M. Human domination of earth’s ecosystems. Science 1997, 277, 494–499.
[2]. Houghton R A, Hackler J L, Lawrence K T. The U S. Carbon buget: contributions from land-use change. Science, 1999, 285 ( 5427) : 574-578.
[3]. Huty R, Yoon R, Hepinstall-Cymerman J, et al. Carbon consequences of land cover change and expansion of urban lands: A case study in the seattle metropolitan region . Landscape Urban Plan, 2011, 103( 6) : 83-93.
[4]. Han Pengpeng, Chen Jinsong, Han Yu. Research on Carbon Emission Effects of Regional Land Use Change Based on Remote Sensing [C]// Editorial Board of Environmental Engineering, Industrial Building Magazine Co., Ltd. Proceedings of the 2018 National Academic Conference of Environmental Engineering (Volume II). Space Information Research Center, Shenzhen Institutes of Advanced Technology, Chinese Academy of Sciences; Urban Traffic Planning Institute of Huizhou City; 2018: 887-892.
[5]. Xin X, Zhang T, He F, et al. Assessing and simulating changes in ecosystem service value based on land use/cover change in coastal cities: A case study of Shanghai, China[J]. Ocean & Coastal Management, 2023, 239: 106591
[6]. Cui L, Shi J. Urbanization and its environmental effects in Shanghai, China[J]. Urban Climate, 2012, 2: 1-15.
[7]. Abera B. Evaluation of Urban Thermal Environment Variation and Stress Using Remote Sensing Imagery and QGIS for Sustainable Urban Development over Adama City, Ethiopia[J]. 2024.
[8]. Yin J, Yin Z, Zhong H, et al. Monitoring urban expansion and land use/land cover changes of Shanghai metropolitan area during the transitional economy (1979–2009) in China[J]. Environmental monitoring and assessment, 2011, 177: 609-621.
[9]. Nakata-Osaki C M, Souza L C L, Rodrigues D S. THIS–Tool for Heat Island Simulation: A GIS extension model to calculate urban heat island intensity based on urban geometry[J]. Computers, Environment and Urban Systems, 2018, 67: 157-168.
[10]. Houghton R A, House J I, Pongratz J, et al. Carbon emissions from land use and land-cover change[J]. Biogeosciences, 2012, 9(12): 5125-5142.
[11]. Débora Joana Dutra et al. Challenges for reducing carbon emissions from Land-Use and Land Cover Change in Brazil[J]. Perspectives in Ecology and Conservation, 2024, 22(3) : 213-218.