1. Introduction
With the restructuring of the global energy landscape and the ongoing adjustment of China’s energy structure, solar photovoltaic (PV) technology is receiving increasing attention. Although PV modules emit almost no greenhouse gases during their operational phase, a comprehensive life cycle assessment of PV power generation must also consider the environmental impact during the decommissioning phase [1]. The resource recovery of retired PV modules represents the final step in the PV industry chain and is a concrete manifestation of the sustainable development concept. As the PV industry continues to flourish, the increasing number of decommissioned PV modules has become a pressing issue. A key technical challenge in recycling these modules lies in the efficient removal of the encapsulant layer, particularly the EVA (ethylene-vinyl acetate) film.
To address EVA removal, Doni et al. [2] used a heated plate, achieving separation of the glass cover under 400 W of power and a heating time of 15 minutes. Pyrolysis has also been explored as a method to remove the EVA film, which can enable the separation of multiple components in PV modules, facilitating their individual recycling. Dong Li et al. [3], leveraging the excellent thermoplastic properties of EVA [4], conducted pyrolysis experiments using a tubular furnace with different gaseous atmospheres. Thermogravimetric analysis revealed that EVA pyrolysis occurs in two stages. In the first stage, the ester bonds in the EVA polymer break down, releasing acetic acid in gaseous form; in the second stage, the remaining high-molecular-weight polymers break apart, followed by the reformation of new chemical bonds. In this study, EVA film was extracted from discarded PV panels manufactured by Canadian Solar Inc. After preheating, thermogravimetric analysis was used to determine the decomposition temperature range and to examine the influence of heating rates on the pyrolysis behavior of the film. The Flynn–Wall–Ozawa (FWO) kinetic model [5-6] was employed to build a thermal decomposition model of the EVA film, segmenting the pyrolysis process into distinct phases and calculating the activation energy at each stage based on nine predefined conversion points.
2. Experiment
2.1. Sample preparation
The experiment utilized retired PV panels from Canadian Solar Inc. in Baotou, which had been in service for 15 years. A standard size of 4 cm × 4 cm was used for manually cutting the samples. The cut samples were subjected to simulated industrial preheating in a muffle furnace at 140 °C for 30 minutes. After preheating, the glass cover was removed, and the encapsulant material (EVA film) was scraped off using a spatula. The EVA film was then analyzed using thermogravimetric analysis, and the results are shown in Fig. 1:
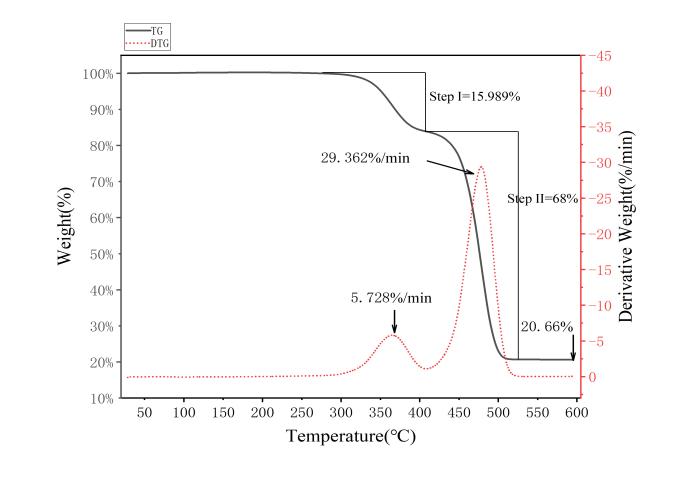
Figure 1: Thermogravimetric analysis curve of EVA film
Based on Equation (1), the vinyl acetate content of the sample was calculated to be 22.92%, which is significantly below the standard encapsulant range of PV modules (30–35%), and thus meets the experimental requirements.
\( {V_{A}}\%={H_{Ac}}\%×\frac{{M_{VA}}}{{M_{HAc}}} \) (1)
Where: VA% is the vinyl acetate content, HAc% is the acetic acid content produced from the decomposition of the vinyl acetate component, MVA is the molar mass of vinyl acetate (86 g/mol), MHAc is the molar mass of acetic acid (60 g/mol).
2.2. Experimental apparatus and methods
A Netzsch 209F3 thermogravimetric analyzer (Germany) was used for the thermogravimetric experiments. The extracted EVA film was divided into four groups, each containing 10 mg samples. Based on different heating rates, the groups were labeled as: A (5 °C/min), B (10 °C/min), C (15 °C/min), and D (20 °C/min). The samples were heated from room temperature to 600 °C under a nitrogen atmosphere with a flow rate of 40 ml/min.
The pyrolysis kinetic model was developed using the Flynn–Wall–Ozawa (FWO) method, a model-free kinetic analysis technique. Based on the TG (thermogravimetric) curves at the four different heating rates, kinetic parameters were obtained to calculate the activation energy of the EVA pyrolysis reaction and to characterize the different reaction stages. The kinetic model employed the 𝑔(𝛼) function, as shown in Equation (2):
\( g(α)=-ln(1-α) \) (2)
Here, 𝛼 represents the conversion rate of the EVA pyrolysis reaction, calculated using Equation (3):
\( α=\frac{{m_{0}}-{m_{t}}}{{m_{0}}-{m_{f}}} \) (3)
Where: m0 is the initial mass of the EVA film before the reaction, mt is the real-time mass of the EVA film at a given time, mf is the final mass of the EVA film at the end of the reaction.
The heterogeneous reaction kinetics equation is shown in Equation (4):
\( \frac{dα}{dT}=\frac{A}{β}exp(-\frac{E}{RT})f(α) \) (4)
Where: α is the conversion rate (see Equation (3)), T is the thermodynamic temperature (K), A is the pre-exponential factor (min⁻¹), β is the heating rate (°C/min), E is the activation energy (kJ/mol), R is the molar gas constant, typically 8.314 J/(mol·K), f(α) is the reaction mechanism function.
3. Results and analysis
3.1. Analysis of TG and DTG characteristics
Thermogravimetric analysis (TG) was conducted on EVA film samples at four different heating rates: A (5 ℃/min), B (10 ℃/min), C (15 ℃/min), and D (20 ℃/min). The thermogravimetric (TG) and derivative thermogravimetric (DTG) curves of the EVA film under these different heating rates are shown in Figures 2 and 3.
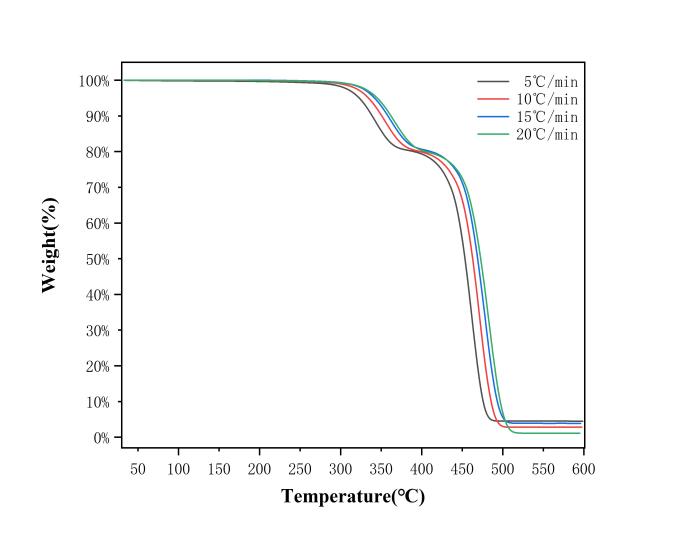
Figure 2: Thermogravimetric EVA film with different heating rates
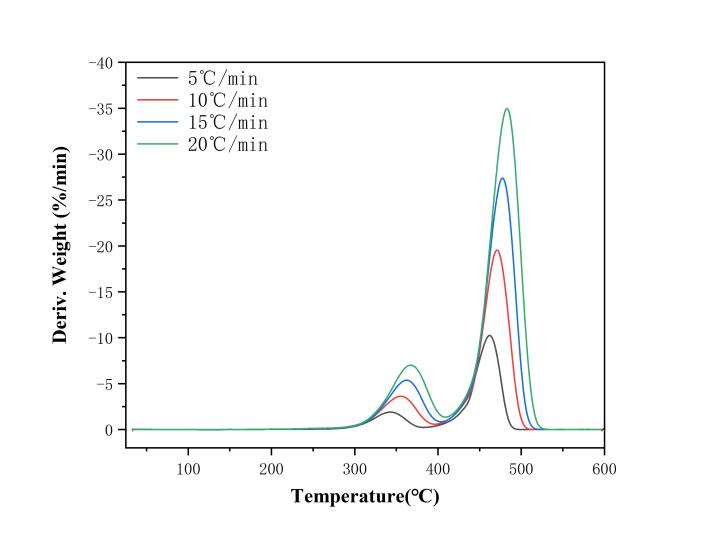
Figure 3: Differential thermogravimetric curves of EVA film with different heating rates
The thermogravimetric analysis of the EVA film enables the characterization and evaluation of its pyrolysis behavior and thermal performance. In conjunction with the DTG curves, the primary reaction stages and corresponding weight loss during the pyrolysis process of the film can be identified.
According to the TG curves, the overall mass loss of the EVA film reaches approximately 95%, and no significant reaction occurs beyond 500 ℃. When the pyrolysis temperature is below 300 ℃, the film shows almost no mass loss, indicating a very low moisture content in the sample. The pyrolysis process of the EVA film exhibits two distinct mass loss stages, consistent with findings reported in the literature [7]. Based on this, the pyrolysis process can be divided into two stages: the first stage occurs between 300 ℃ and 420 ℃, during which the film loses about 20% of its mass. The primary weight loss peak in this stage is attributed to the decomposition of vinyl acetate side chains in the EVA, releasing ethylene and acetic acid. As the temperature continues to rise above 420 ℃, a sharp decrease in mass is observed, marking the second stage of the pyrolysis process (420 ℃–500 ℃). The maximum weight loss peak occurs during this stage, mainly due to the breakdown of the polyethylene backbone, removal of vinyl acetate side chains, and the dissociation of cross-linked structures [8]. This is the principal stage of thermal degradation in the EVA film. After 500 ℃, the mass of EVA remains largely unchanged, and weight loss slows significantly. This is likely due to the formation of a carbonaceous layer from polyenes and unsaturated compounds during pyrolysis, which inhibits further decomposition. Additionally, at 600 ℃, the EVA film still contains residues, with remaining char accounting for less than 1%.
As the heating rate increases, both TG and DTG curves shift to the right, and the weight loss peaks in the DTG curves move toward higher temperature regions. This is caused by temperature lag due to variations in heat transfer efficiency.
Based on the thermogravimetric analysis curves, the key parameters of EVA pyrolysis are summarized in Table 1. Here, β represents the heating rate of the pyrolysis reaction (℃/min); T0 is the initial temperature at which pyrolysis begins (℃); Tm1 is the temperature corresponding to the first weight loss peak during pyrolysis (℃); Tm2 is the temperature corresponding to the maximum weight loss peak (℃); and Tf is the final temperature when the pyrolysis reaction terminates (℃).
Table 1: Key parameters of pyrolysis of EVA adhesive film
Heating Rate β(℃/min) | Initial Temperature T0(℃) | Thermogravimetric Peak Temperature Tm1(℃) | Thermogravimetric Peak Temperature Tm2(℃) | Final Temperature Tf(℃) |
5 | 311.85 | 343.6 | 462.87 | 493.7 |
10 | 324.89 | 355.5 | 470.60 | 509.4 |
15 | 332.07 | 362.6 | 477.55 | 516.8 |
20 | 334.15 | 368.1 | 483.58 | 529.9 |
3.2. Pyrolysis kinetics analysis
Figure 4 shows the conversion rate (α) curves of EVA film under four different heating rates. The conversion rate α was calculated using Equation (3). The heating rates corresponding to each curve are: Curve A – 5 ℃/min, Curve B – 10 ℃/min, Curve C – 15 ℃/min, and Curve D – 20 ℃/min.
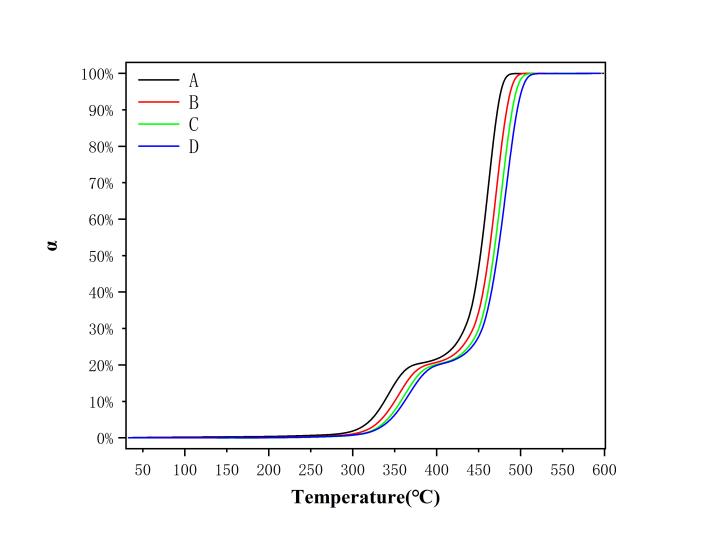
Figure 4: EVA film α–T diagram
The basic reaction rate equation is expressed by Equation (5):
\( \frac{dα}{dt}=kf(α) \) (5)
Here, k is the reaction rate at time t, and f(α) is the kinetic model function for solid-state reactions. The reaction rate constant k, which depends on temperature, is typically described by the Arrhenius equation:
\( k={A_{0}}exp(\frac{-{E_{a}}}{RT}) \) (6)
The parameters in the Arrhenius equation are defined as follows: A0 is the pre-exponential factor (also known as the Arrhenius constant, with units of min⁻¹), Ea is the activation energy of the pyrolysis reaction (in kJ/mol), T is the reaction temperature (in Kelvin), and R is the universal gas constant (8.314 J·K⁻¹·mol⁻¹). To obtain the kinetic parameters Ea and A0 for the pyrolysis reaction of the EVA film, the Coats–Redfern method was used to rearrange and integrate Equation (6), resulting in the following expression:
\( ln[\frac{g(α)}{{T^{2}}}]=ln[\frac{{A_{0}}R}{R{E_{a}}}(1-\frac{RT}{{E_{a}}})]-\frac{{E_{a}}}{RT} \) (7)
The Flynn–Wall–Ozawa method is expressed as:
\( ln{(β)}=ln\frac{AE}{RG(α)}-5.331-1.0516\frac{{E_{a}}}{RT} \) (8)
Based on analysis of the TG curves, the pyrolysis process of EVA film consists of two distinct stages, each involving different reactions and products. Therefore, the kinetic parameters of EVA film pyrolysis were determined separately for each stage. The pyrolysis process was divided into two temperature ranges: room temperature to 400 °C, and 400 °C to 600 °C. Activation energy was calculated for each stage individually. The conversion rate α was divided into intervals of 0.1, resulting in nine reaction progress points (from 0.1 to 0.9). A linear regression analysis of lnβ versus T-1 was conducted, and the activation energy Ea was determined from the slope of the fitted line. The apparent activation energy E and corresponding coefficient of determination R2 were obtained for each conversion rate.
Figure 5 shows the ln-T-1 plots and the variation of apparent activation energy for the two stages of the EVA film pyrolysis process. In the ln-T-1 plots, the four data points on the vertical axis represent the lnβvalues corresponding to the four different heating rates (A, B, C, and D), while the horizontal axis indicates the reciprocal of the corresponding temperature in Kelvin. Each curve reflects the trend of lnβ-T-1 at a specific conversion rate. The slope of each curve is obtained by fitting a linear regression equation, which is then used to calculate the activation energy.
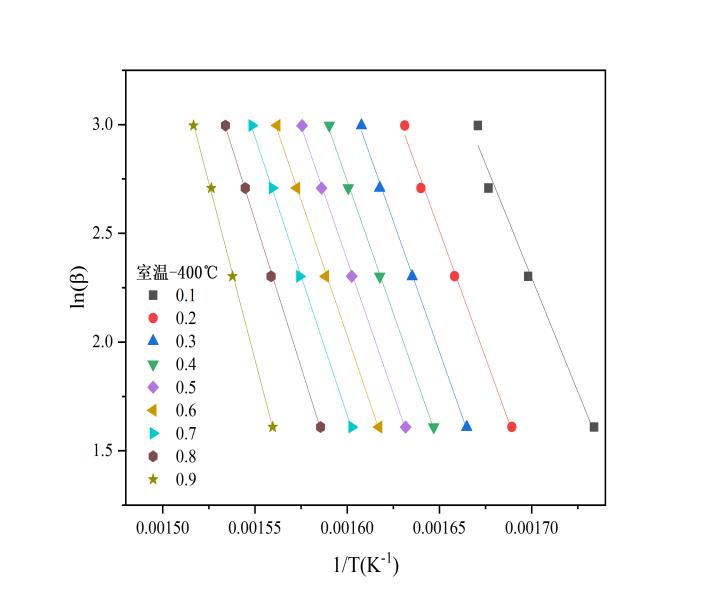
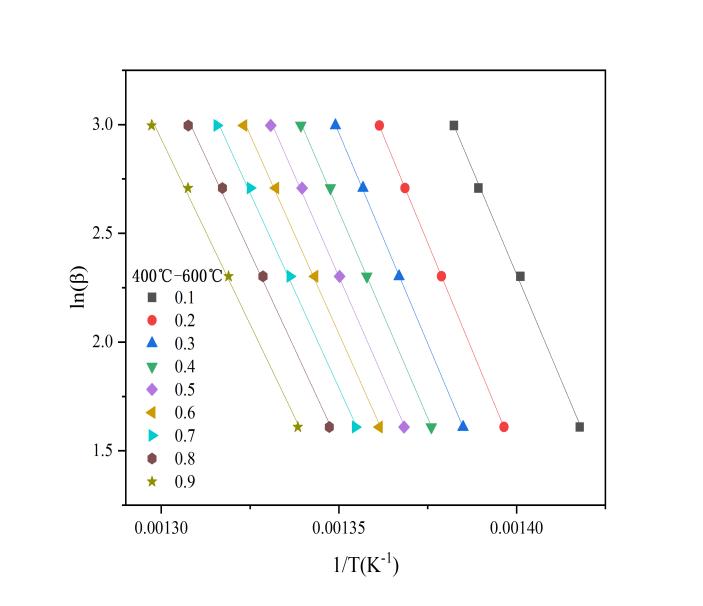
(a) ln(β)–1/T plot in the first stage (b) ln(β)–1/T plot in the second stage
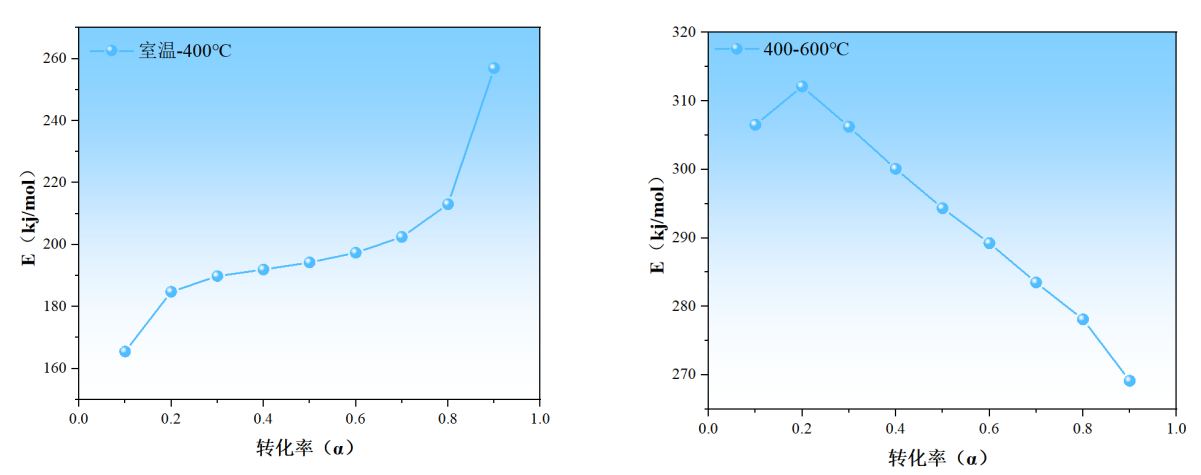
(c) Activation energy of the first-stage reaction (d) Activation energy of the second-stage reaction
Figure 5: Linear fitting and activation energy
In the kinetic analysis based on the Flynn–Wall–Ozawa (FWO) kinetic reaction model, a coefficient of determination (R2) greater than 0.96 for the linear regression equation indicates a high level of data reliability. The variation in the apparent activation energy during the pyrolysis of EVA film at different conversion rates (α) can be characterized by the R2 values obtained from the linear regression of lnβ versus 1/T. Table 2 presents the R² values and corresponding activation energies (E) at various conversion rates during the first stage of EVA pyrolysis.
Table 2: Phase 1 kinetic parameters
α | R2 | E(kJ/mol) |
0.1 | 0.985 | 165.48 |
0.2 | 0.996 | 184.77 |
0.3 | 0.998 | 189.82 |
0.4 | 0.999 | 191.92 |
0.5 | 0.999 | 194.23 |
0.6 | 0.999 | 197.36 |
0.7 | 0.999 | 202.46 |
0.8 | 0.999 | 213.02 |
0.9 | 0.999 | 256.92 |
The minimum R² value in Phase 1 is 0.985, which is greater than 0.96 and thus falls within the range of high reliability, indicating that the apparent activation energy data derived from it are credible. The R² values and apparent activation energies for the second stage are shown in Table 3:
Table 3: Phase 2 kinetic parameters
α | R2 | E(kJ/mol) |
0.1 | 0.998 | 306.50 |
0.2 | 0.999 | 312.11 |
0.3 | 0.999 | 306.22 |
0.4 | 0.999 | 300.07 |
0.5 | 0.999 | 294.34 |
0.6 | 0.998 | 289.23 |
0.7 | 0.998 | 283.48 |
0.8 | 0.998 | 278.10 |
0.9 | 0.997 | 269.13 |
Using the FWO method, the average apparent activation energies for the two stages of EVA film pyrolysis were calculated. The average activation energy for the first stage is 199.55 kJ/mol, and for the second stage, it is 293.24 kJ/mol. These two stages do not exhibit a consistent trend in activation energy, which is attributed to the fact that different chain segments are broken during each stage, resulting in distinct reaction products. The significantly higher activation energy in the second stage is due to the lower energy required for side-chain elimination compared to the higher energy needed to break the main polymer backbone.
By constructing a kinetic model for the EVA pyrolysis process and calculating the apparent activation energy, the two reaction stages can be delineated.
The first-stage reaction can be subdivided into three sub-stages based on changes in activation energy: Stage I (α = 0.1–0.2): The activation energy increases with the rise in conversion rate. Stage II (α = 0.2–0.8): The activation energy continues to rise but at a more gradual and stable rate. Stage III (α = 0.8–0.9): The activation energy increases sharply with the conversion rate. This suggests that in the first stage of the reaction, EVA begins to undergo thermal decomposition. This stage involves the initial breakdown of ethylene-vinyl acetate (EVA), primarily through deacetylation. Vinyl acetate units decompose through a six-membered ring transition state, during which hydrogen bonds form between the carboxyl group oxygen and adjacent hydrogen atoms, generating chemically unstable enol intermediates. These intermediates continue to react as temperature increases, with energy input driving the rearrangement of side-chain groups. The deacetylation process is completed, marking the end of the first stage. The associated mass loss results from the volatilization of acetic acid in the gaseous state. Therefore, the activation energy trend during this stage first rises, then slows as intermediates form, and finally increases sharply as the side-chain acetyl groups are eliminated with rising temperature.
The second-stage reaction can be divided into two sub-regions based on changes in activation energy: Region a (α = 0.1–0.2): Activation energy increases with conversion rate. Around 425 °C, the second pyrolysis stage begins, involving the scission of the carbon backbone and decomposition into long-chain olefins and alkanes. As temperature increases, hydrocarbons are released, mainly olefins and alkanes in the C4–C30 range [9], including butenes, 1-hexene, 1-heptene, as well as octane, nonane, and decane. Region b (α = 0.2–0.9): Activation energy begins to gradually decrease with increasing conversion rate. This is because, as the primary reaction completes and the backbone is mostly broken down, further heating causes the remaining EVA side chains to decompose, producing increasing amounts of olefins and aromatic hydrocarbons.
4. Conclusion
(1) Thermogravimetric analysis (TGA) of EVA films from decommissioned photovoltaic (PV) modules shows that the acetic acid content is significantly lower than that of standard modules, resulting in a generally lower activation energy during pyrolysis. The thermal stability of aged EVA films is notably reduced.
(2) The pyrolysis of EVA films from decommissioned PV modules primarily occurs between 300 °C and 510 °C, with two distinct stages of thermal weight loss: Stage 1: 300 °C–400 °C, with a weight loss of 15.989%. Stage 2: 400 °C–510 °C, with a weight loss of 68%. With increasing heating rates, the onset and end temperatures, as well as the temperature of maximum weight loss, shift toward higher temperatures, indicating a pronounced thermal lag.
(3) The Flynn–Wall–Ozawa method was used to segment the EVA thermal degradation curves and obtain kinetic parameters for the two main reaction stages. Activation energies were calculated for each stage. The first-stage reaction was further divided into three sub-stages, and the second-stage reaction into two. The activation energy in the first stage is significantly lower than that in the second stage, indicating that complete decomposition of EVA requires higher energy. The first stage corresponds to side-chain elimination, while the second stage involves main-chain scission, which requires greater activation energy.
References
[1]. Wang, M., Hu, Z. F., Bai, B., et al. (2024). A review on dissociation and resource utilization of decommissioned crystalline silicon photovoltaic modules. Journal of China Coal Society, 49(10), 4188–4202.
[2]. Doni, A., & Dughiero, F. (2012). Proceedings of the 38th IEEE Photovoltaic Specialists Conference (pp. 000757–000762). Austin, TX, USA.
[3]. Dong, L., Liu, J. Y., Zhou, X. Y., et al. (2016). Thermal treatment and products analysis of EVA in waste crystalline silicon photovoltaic modules. Environmental Pollution & Control, 38(10), 61–66.
[4]. Jin, G. T. (1995). The theory and progress of polymer chemistry [M]. China Sinopec Press.
[5]. Ozawa, T. (1986). Non-isothermal kinetics and generalized time. Thermochimica Acta, 100(1), 109–118.
[6]. Flynn, J. H., & Wall, L. A. (1966). General treatment of the thermogravimetry of polymers. Journal of Research of the National Bureau of Standards Section A: Physics and Chemistry, 70(6), 487.
[7]. Xu, C., Lin, B., Yuan, X., et al. (2019). Recycling of waste crystalline silicon photovoltaic module. Chinese Journal of Environmental Engineering, 13(06), 1417–1424.
[8]. Dong, L., Zhou, X. Y., Liu, J. Y., et al. (2020). Research on thermogravimetric dynamics and products distribution of EVA in waste photovoltaic modules. Acta Energiae Solaris Sinica, 41(04), 14–19.
[9]. Bugada, D. C., & Rudin, A. (1992). Molecular structure and melting behaviour of ethylene-vinyl acetate copolymers. European Polymer Journal, 28(3), 219–227.
Cite this article
Zhao,Z.;Pang,Y.;Zhang,T.;Jiang,X. (2025). Pyrolysis Kinetic Analysis of Decommissioned Photovoltaic Encapsulation Films. Theoretical and Natural Science,118,85-93.
Data availability
The datasets used and/or analyzed during the current study will be available from the authors upon reasonable request.
Disclaimer/Publisher's Note
The statements, opinions and data contained in all publications are solely those of the individual author(s) and contributor(s) and not of EWA Publishing and/or the editor(s). EWA Publishing and/or the editor(s) disclaim responsibility for any injury to people or property resulting from any ideas, methods, instructions or products referred to in the content.
About volume
Volume title: Proceedings of the 3rd International Conference on Environmental Geoscience and Earth Ecology
© 2024 by the author(s). Licensee EWA Publishing, Oxford, UK. This article is an open access article distributed under the terms and
conditions of the Creative Commons Attribution (CC BY) license. Authors who
publish this series agree to the following terms:
1. Authors retain copyright and grant the series right of first publication with the work simultaneously licensed under a Creative Commons
Attribution License that allows others to share the work with an acknowledgment of the work's authorship and initial publication in this
series.
2. Authors are able to enter into separate, additional contractual arrangements for the non-exclusive distribution of the series's published
version of the work (e.g., post it to an institutional repository or publish it in a book), with an acknowledgment of its initial
publication in this series.
3. Authors are permitted and encouraged to post their work online (e.g., in institutional repositories or on their website) prior to and
during the submission process, as it can lead to productive exchanges, as well as earlier and greater citation of published work (See
Open access policy for details).
References
[1]. Wang, M., Hu, Z. F., Bai, B., et al. (2024). A review on dissociation and resource utilization of decommissioned crystalline silicon photovoltaic modules. Journal of China Coal Society, 49(10), 4188–4202.
[2]. Doni, A., & Dughiero, F. (2012). Proceedings of the 38th IEEE Photovoltaic Specialists Conference (pp. 000757–000762). Austin, TX, USA.
[3]. Dong, L., Liu, J. Y., Zhou, X. Y., et al. (2016). Thermal treatment and products analysis of EVA in waste crystalline silicon photovoltaic modules. Environmental Pollution & Control, 38(10), 61–66.
[4]. Jin, G. T. (1995). The theory and progress of polymer chemistry [M]. China Sinopec Press.
[5]. Ozawa, T. (1986). Non-isothermal kinetics and generalized time. Thermochimica Acta, 100(1), 109–118.
[6]. Flynn, J. H., & Wall, L. A. (1966). General treatment of the thermogravimetry of polymers. Journal of Research of the National Bureau of Standards Section A: Physics and Chemistry, 70(6), 487.
[7]. Xu, C., Lin, B., Yuan, X., et al. (2019). Recycling of waste crystalline silicon photovoltaic module. Chinese Journal of Environmental Engineering, 13(06), 1417–1424.
[8]. Dong, L., Zhou, X. Y., Liu, J. Y., et al. (2020). Research on thermogravimetric dynamics and products distribution of EVA in waste photovoltaic modules. Acta Energiae Solaris Sinica, 41(04), 14–19.
[9]. Bugada, D. C., & Rudin, A. (1992). Molecular structure and melting behaviour of ethylene-vinyl acetate copolymers. European Polymer Journal, 28(3), 219–227.


