


1. Introduction
Diabetes, as a global pandemic, has become a significant issue on the international health agenda. It is considered a major threat to human health and the global economy [1]. In 2013, the global number of diabetes patients reached 382 million. It is estimated that by 2035, this number will approach 600 million [2]. The overall diabetes prevalence in China has nearly reached 12%, with the prevalence among those aged 60 and above soaring to one-third [3].
In summary, building and applying a diabetes prediction model is a key path to breaking through the bottleneck of disease prevention and control, achieving early precision intervention and optimal resource allocation, and is of strategic significance for reducing the global disease burden. Among them, the study of factors affecting diabetes is not only the logical starting point for building an efficient prediction model and achieving early and precise intervention, but also the scientific cornerstone for revealing the mechanism of disease occurrence and a key bridge connecting disease mechanism research and prediction technology innovation.
According to research, diabetes is due to insufficient insulin secretion or dysfunction of its function, which leads to the failure of blood sugar (glucose) to be metabolized normally in cells. It manifests as elevated blood sugar levels accompanied by disturbances in fat and protein metabolism [4]. Diabetes can be divided into type 1 diabetes, type 2 diabetes, pregnancy diabetes, and some rare types. There are many risk factors that may lead to diabetes. Ou and other scholars conducted research using the LightGBM algorithm model. The results showed that the risk of diabetes is associated with multiple factors such as fasting blood glucose, triglycerides, and BMI. They also mentioned that indicators such as large platelet ratio and total white blood cell count are also important factors affecting the risk of diabetes [5]. Lian used decision trees, random forests, and logistic regression models to analyze the risk factors for diabetes. The study showed that polyuria and polydipsia are the core risk factors for diabetes [6].
The influencing factors of diabetes provide a data basis for the prediction model, which helps identify high-risk individuals and guide preventive measures by quantifying the role of these factors. Therefore, the combination of models and influencing factor data is very important for the prediction of diabetes prevention. Hou et al. proposed a DPN diabetes prediction method based on a one-dimensional convolutional neural network and established a support vector machine model and a BP neural network prediction model. The experimental results show that the 1D-CNN model has an accuracy rate of 98.3%, which is the best [7]. Zhang et al. applied the stacking ensemble learning method to the diagnosis of diabetes and used support vector machines, random forests, and artificial neural networks as base learners for the stacking ensemble in the Pima Indian diabetes dataset in the UCI database. The results show that the fused model has a better classification effect than a single model, with a classification accuracy of 92.2% [8]. Qiao et al. used a method based on multi-feature attribute similarity of patients for diabetes diagnosis. They analyzed the similarity of different features and grouped them using a clustering method, and used random forest to fit the grouping results to obtain disease prediction results. The experimental results show that the proposed method is more effective than other methods, and the prediction accuracy is improved [9]. Tarun used principal component analysis (PCA) and a support vector machine to classify diabetic patients. The experimental results of this study showed that the classification accuracy reached 93.66%, which was an improvement over the previous level [10].
However, there are still some gaps and challenges in existing research. For example, challenges include the complexity of prediction models, data diversity, and insufficient data quality. Here, this study aims to use a diabetes prediction dataset to compare the prediction accuracy of three machine learning methods: Logistic Regression model (LR model), Random Forest model (RF model), and Back Propagation Neural Network model (BPNN model).
This helps to more accurately predict the risk of diabetes and improve decision support capabilities in clinical and public health management, advancing the development of personalized and precision medicine.
2. Methods
2.1. Data source
The comprehensive diabetes health data used in this study is sourced from Kaggle [11]. The dataset is owned by Rabie El Kharoua. The availability score of this dataset is 10.0. A total of 1,879 patients participated, which provides important evidence for revealing the associations between risk factors and diabetes.
2.2. Variable selection
The original dataset contains 1,879 instances and 46 variables, and there are no missing values. Among the 1,879 patients, 752 individuals were diagnosed with diabetes, approximately 60 percent of the dataset. Since the original “Doctor In Charge” variable is all “Confidential” and the “Patient Id” is used solely to distinguish between individual patients, this paper does not consider these two variables.
The remaining 44 variables in the dataset are still inappropriate for the model. A model containing a large number of features may become extremely complex, resulting in poor performance of the model on new data. Not all features can have a positive impact on the performance of the model. Some features may be redundant or have a weak relationship with the target variable.
Therefore, this paper chooses to screen variables by calculating the Spearman correlation coefficient and the p-value. The Spearman rank correlation coefficient can be represented as:
Where the ranks
Here, the subscript
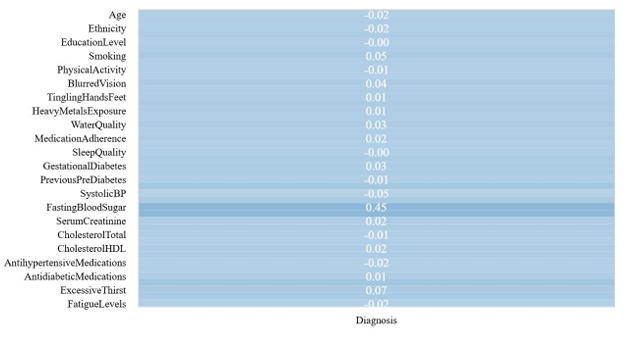
Figure 1: Visualization graph of Spearman correlation (picture credit: original)
Through calculations, the remaining ten variables, including Smoking, Family History Diabetes, Hypertension, Systolic BP, Diastolic BP, Fasting Blood Sugar, HbA1c, Frequent Urination, Excessive Thirst, and Unexplained Weight Loss, that have a significant correlation with diabetes are selected. Thus, the complexity of the model can be reduced and its generalization ability can be improved.
2.3. Method introduction
Diabetes has gone beyond the scope of a single disease and has become a microcosm of the global health crisis. Its early and accurate prediction is of great significance to clinical intervention and public health. In recent years, the rapid development of machine learning technology has spawned a variety of diabetes prediction models. However, different models have significant differences in feature selection, algorithm mechanism, and prediction performance. In order to compare the accuracy of diabetes prediction models, this study selected three classification models, namely the LR model, the RF model, and the BPNN model.
The LR model is based on selected risk factors, and the weight of the impact of each feature on diabetes is quantified through regression analysis. The model is simple and intuitive. It is highly interpretable and suitable for preliminary screening. RF model uses an integrated learning algorithm to improve prediction accuracy through multiple decision trees voting, and can process high-dimensional data (such as genes and lifestyle information). It has the advantages of natural handling of nonlinear problems, strong resistance to overfitting, and the ability to explore complex correlations between features. BPNN model automatically learns deep data features through multi-layer nonlinear transformation, especially suitable for integrating multimodal data such as genes and images (such as fundus images).
All the models in this paper divide the dimension-reduced dataset into a training set and a testing set according to the ratio of 8:2. On the basis of setting the intercept, the L-BFGS optimization algorithm is used in the LR model, and L2 regularization is employed for model building. The RF model sets the number of decision trees to 100, the node splitting standard to Gini, and no limit on the maximum depth of the tree for modeling. Each hidden layer network node of the BPNN model is set to (100), and the activation function uses the Relu function for modeling.
For the evaluation of the models, this paper calculates their accuracy, precision, recall rate and F1-score to draw a conclusion through comparison.
3. Results and discussion
|
|
|
|
|
(a) |
(b) |
(c) |
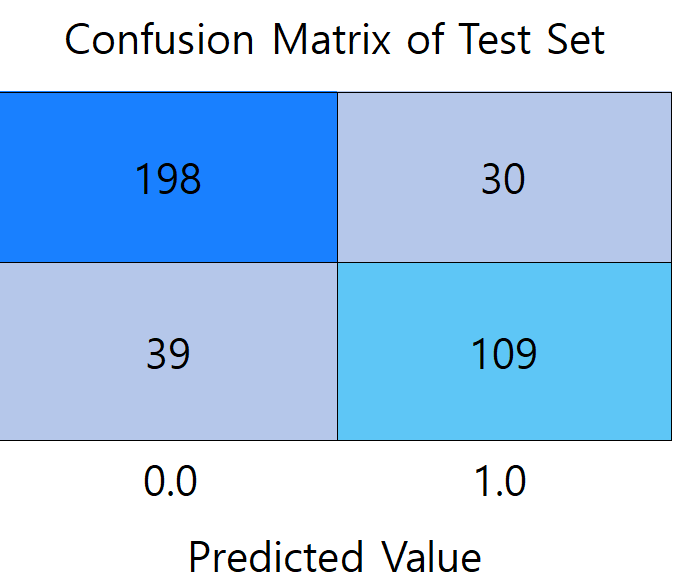
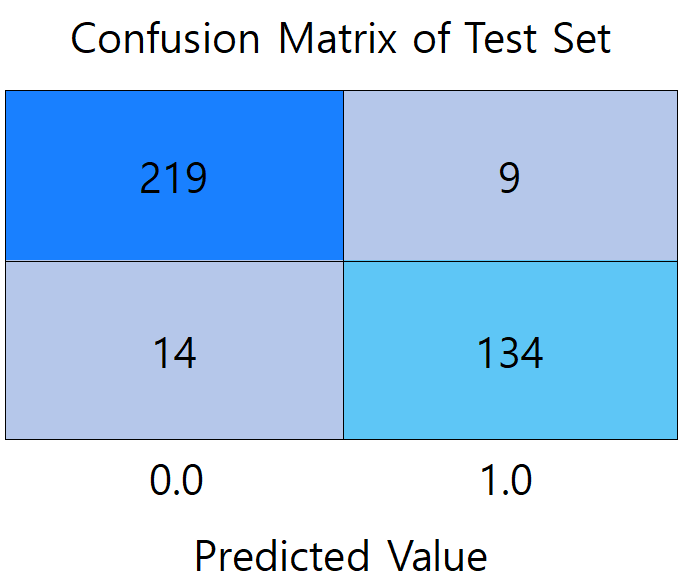
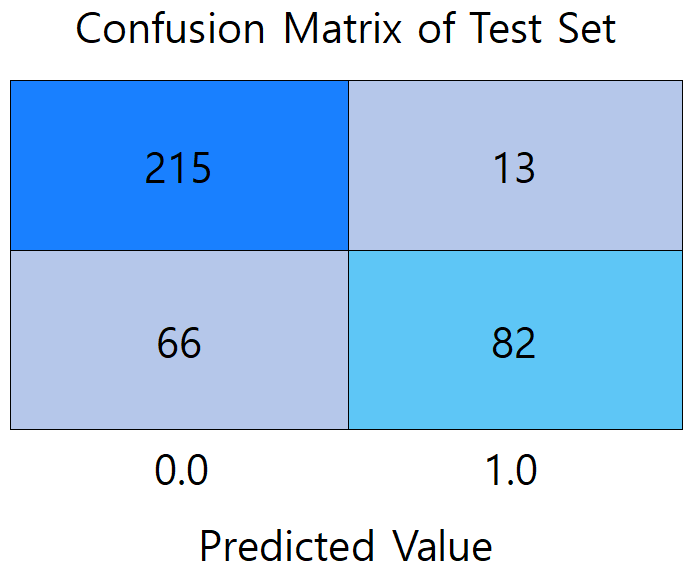
Figure 2: Confusion matrix diagram of models (picture credit: original)
Figure 2 presents a comparison of the confusion matrices between the three models. (a) shows the confusion matrix of the LR model, which misdiagnosed the largest number of patients with undiseased samples, reaching 30 people. (b) shows the confusion matrix of the RF model, which has the highest prediction accuracy among the three models, with the total number of correctly predicted samples of 353. 219 participants met both the actual non-diabetes and correct prediction (true negative), and 134 were correctly identified as diabetic (true positive). (c) It is a confusion matrix graph of the BPNN model, which diagnoses 66 patients who actually suffer from diabetes as not ill, with the largest number of mispredicted people among the three models.
|
|
|
|
(a) |
(b) |
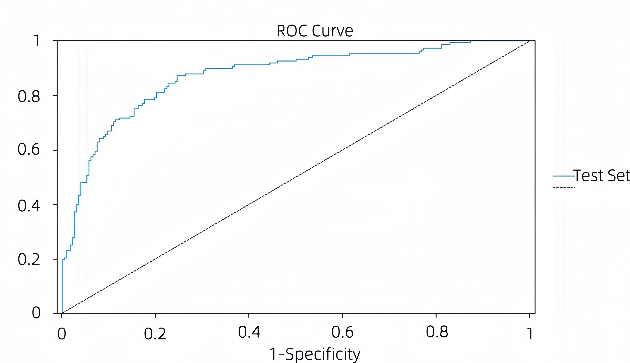
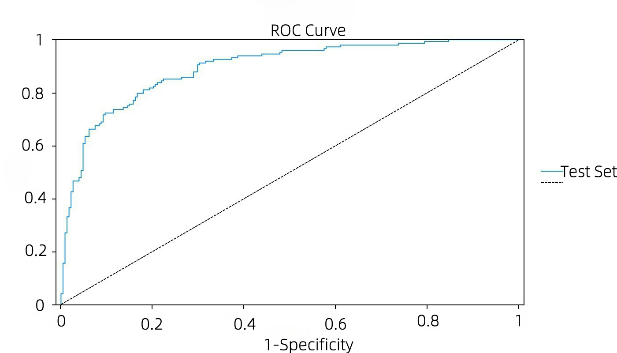
Figure 3: ROC curve graph of models (picture credit: original)
Figures 3 (a) and (b) show the ROC curves of the BPNN model and the LR model, respectively. The stability of both the LR model and the BPNN model is guaranteed, and the ROC curve of the BPNN model is closer to the middle diagonal than that of the LR model. With a higher AUC value, the LR model has better overall performance in classification performance and stability. In the BPNN model, the AUC of the training set and the AUC of the test set were 0.872. The ROC curve of the LR model is close to the upper left corner, which has a good balance between sensitivity and 1-speciality, and has a strong ability to distinguish between positive and negative samples. The AUC of the training set of the LR model was 0.917 and the AUC of the test set was 0.893, both of which were at a high level, and the difference between the two was small, indicating that the model not only fit the training data well, but also maintained a high generalization ability on the test data, and the risk of overfitting was low.
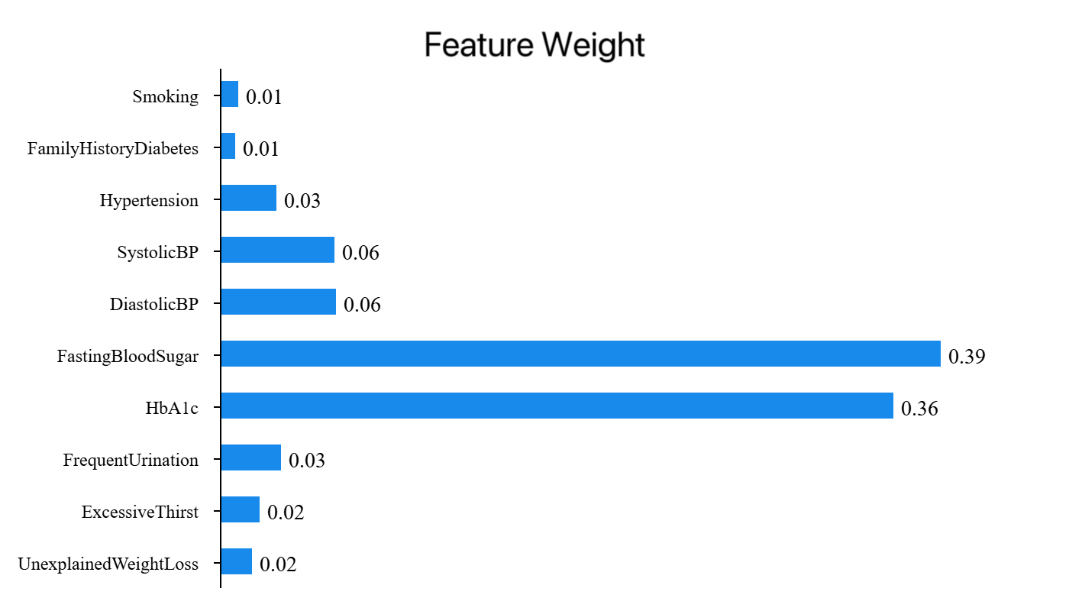
Figure 4: Feature weight of RFNN model (picture credit: original)
Figure 4 shows the feature weights of each variable in the random forest model, showing the importance of each feature's contribution to the m00odel, and the sum of the values is 1. As can be seen from the figure 4, Fasting Blood Sugar accounts for 38.99%, having the highest weight and playing a crucial role in model construction. HbA1c accounts for 36.41%, being the second most important feature and playing a significant role in model construction. Diastolic BP accounts for 6.26%. The total proportion of these three features is 81.67%.
|
Training set |
Test set |
|||||||
|
Accuracy (comprehensive) |
Recall (comprehensive) |
f1-score (comprehensive) |
Number of samples |
Accuracy (comprehensive) |
Recall (comprehensive) |
f1-score (comprehensive) |
Number of samples |
|
|
LR |
0.85 |
0.85 |
0.85 |
1503 |
0.82 |
0.82 |
0.82 |
376 |
|
RF |
1.00 |
1.00 |
1.00 |
1503 |
0.94 |
0.94 |
0.94 |
376 |
|
BPNN |
0.80 |
0.79 |
0.78 |
1503 |
0.80 |
0.79 |
0.78 |
376 |
As can be seen from Table 1, the accuracies of the final models of the LG model, RF model, and BPNN model on the test set are 81.65%, 93.88%, and 78.99%, respectively. The accuracy (comprehensive) of them is 81.53%, 93.88%, and 80.37%, respectively. The recall (comprehensive) is 81.65%, 93.88%, and 78.99%, respectively. As for the F1-score (comprehensive), it is 0.82, 0.94, and 0.78, respectively.
It is worth noting that the difference in model performance is not due to a single factor: the depth of feature engineering, the completeness of data cleaning, and the combination of hyperparameters may have a significant impact on the final performance. Therefore, this study has the shortcoming of not finding the best performance of the model under the optimal parameters. This leads to some flaws in the scientific nature of this study.
In addition, these three models themselves have certain limitations. The LR model has limited ability to capture nonlinear relationships and is limited in performance on complex datasets. To address this limitation, the two most important improvement strategies are to introduce nonlinear relationships through feature engineering and to integrate with nonlinear models to make up for the shortcomings in capabilities. The RF model has difficulties in handling high-cardinality categorical variables, unbalanced data, time series prediction, variable interpretation, and is sensitive to hyperparameters [12]. When processing unbalanced data, the random forest algorithm cannot make good predictions for the minority class, resulting in a large error between the final classification result and the actual result [13]. The model can be improved by optimizing feature encoding and adjusting the splitting strategy, as well as optimizing sample weighting and integration strategy. The model can be improved by optimizing feature encoding and adjusting the splitting strategy, as well as optimizing sample weighting and integration strategy.
4. Conclusion
This study compared the measured performance of LR, RF, and BPNN in the diabetes prediction scenario and found that the RF model took the lead with the highest prediction accuracy (93.88%) in the test set. This result suggests that the algorithm has a stronger pattern-capturing ability in the feature space of the current dataset.
Given the high sensitivity requirements of medical prediction, subsequent research can focus on two aspects of the RF model: First, by integrating clinical experience through grid search, dynamic weights are assigned to high-risk indicators such as blood sugar and BMI (for example, the importance of blood sugar features is increased by 40%), and the tree depth (≤12 layers) and leaf node samples (≥5 cases) are simultaneously constrained. Second, in the face of multi-center data bias, domain adaptation preprocessing and adversarial training were used to eliminate equipment/population differences between hospitals, so that the cross-domain AUC of the model was stabilized at 0.91 (single-center fluctuation <0.06), and the decision tree path was visualized. In this way, doctors can trace each step of reasoning logic, making the random forest model a real "smart stethoscope" to assist in diabetes prediction.
References
[1]. Zimmet, P. Z., Magliano, D. J., Herman, W. H., & Shaw, J. E. (2014). Diabetes: a 21st-century challenge. The lancet Diabetes & endocrinology, 2(1), 56-64.
[2]. Sun, C. (2014). A study of biomarker analysis in association with type 1 diabetes and its shared features in rheumatoid arthritis. Karolinska Institutet (Sweden).
[3]. National Geriatrics Center, Chinese Medical Association Geriatrics Branch & Chinese Geriatrics Association Diabetes Professional Committee. (2024). Chinese elderly diabetes diagnosis and treatment guidelines (2024 edition). Peking Union Medical College Journal, 15(04), 771-800.
[4]. Roglic, G. (2016). WHO Global report on diabetes: A summary. International Journal of Noncommunicable Diseases, 1(1), 3-8.
[5]. Ouyang, P, Li X, Leng, F, Lai, X, Zhang, H, Yan, C, ... & Li, W. (2021). Application of a machine learning algorithm in diabetes risk prediction in the physical examination population. Chinese Journal of Disease Control, 25(7), 849-853.
[6]. Chunlan. L. (2023). Early diabetes risk prediction based on machine learning methods. Statistics and Application, 12, 974.
[7]. Li, J.S. (2023). Diabetes prediction based on machine learning and SHAP feature analysis. Intelligent Computers and Applications, 13(1), 153-157.
[8]. Zhang, Q., Zhou, L., Zou, Q., & Yu, X. (2020). Research on a diabetes prediction method based on stacking. Intelligent Computers and Applications, 10(2), 107-110.
[9]. Han, Q., Zhijun, R., Ying, X., Binbin D., & Hui, Z.. (2022). Early prediction method of diabetes based on multi-feature attribute similarity. Science, Technology and Engineering, 21(36), 15497-15502.
[10]. Han, J., Pei, J., & Tong, H. (2022). Data mining: concepts and techniques. Morgan Kaufmann.
[11]. Kaggle. (2024). https://www.kaggle.com/datasets/rabieelkharoua/diabetes-health-dataset-analysis
[12]. Zhu, T. (2020, August). Analysis on the applicability of the random forest. In Journal of Physics: Conference Series (Vol. 1607, No. 1, p. 012123). IOP Publishing.
[13]. Qin, X. (2020). Improvement and application of the random forest algorithm (Master's thesis, Lanzhou Jiaotong University). Master's degree.
Cite this article
Zhu,W. (2025). Comparison of Prediction Models for Diabetes: Accuracy Analysis of Logistic Regression, Random Forest, and Back Propagation Neural Network. Theoretical and Natural Science,119,69-76.
Data availability
The datasets used and/or analyzed during the current study will be available from the authors upon reasonable request.
Disclaimer/Publisher's Note
The statements, opinions and data contained in all publications are solely those of the individual author(s) and contributor(s) and not of EWA Publishing and/or the editor(s). EWA Publishing and/or the editor(s) disclaim responsibility for any injury to people or property resulting from any ideas, methods, instructions or products referred to in the content.
About volume
Volume title: Proceedings of ICEGEE 2025 Symposium: Sensor Technology and Multimodal Data Analysis
© 2024 by the author(s). Licensee EWA Publishing, Oxford, UK. This article is an open access article distributed under the terms and
conditions of the Creative Commons Attribution (CC BY) license. Authors who
publish this series agree to the following terms:
1. Authors retain copyright and grant the series right of first publication with the work simultaneously licensed under a Creative Commons
Attribution License that allows others to share the work with an acknowledgment of the work's authorship and initial publication in this
series.
2. Authors are able to enter into separate, additional contractual arrangements for the non-exclusive distribution of the series's published
version of the work (e.g., post it to an institutional repository or publish it in a book), with an acknowledgment of its initial
publication in this series.
3. Authors are permitted and encouraged to post their work online (e.g., in institutional repositories or on their website) prior to and
during the submission process, as it can lead to productive exchanges, as well as earlier and greater citation of published work (See
Open access policy for details).
References
[1]. Zimmet, P. Z., Magliano, D. J., Herman, W. H., & Shaw, J. E. (2014). Diabetes: a 21st-century challenge. The lancet Diabetes & endocrinology, 2(1), 56-64.
[2]. Sun, C. (2014). A study of biomarker analysis in association with type 1 diabetes and its shared features in rheumatoid arthritis. Karolinska Institutet (Sweden).
[3]. National Geriatrics Center, Chinese Medical Association Geriatrics Branch & Chinese Geriatrics Association Diabetes Professional Committee. (2024). Chinese elderly diabetes diagnosis and treatment guidelines (2024 edition). Peking Union Medical College Journal, 15(04), 771-800.
[4]. Roglic, G. (2016). WHO Global report on diabetes: A summary. International Journal of Noncommunicable Diseases, 1(1), 3-8.
[5]. Ouyang, P, Li X, Leng, F, Lai, X, Zhang, H, Yan, C, ... & Li, W. (2021). Application of a machine learning algorithm in diabetes risk prediction in the physical examination population. Chinese Journal of Disease Control, 25(7), 849-853.
[6]. Chunlan. L. (2023). Early diabetes risk prediction based on machine learning methods. Statistics and Application, 12, 974.
[7]. Li, J.S. (2023). Diabetes prediction based on machine learning and SHAP feature analysis. Intelligent Computers and Applications, 13(1), 153-157.
[8]. Zhang, Q., Zhou, L., Zou, Q., & Yu, X. (2020). Research on a diabetes prediction method based on stacking. Intelligent Computers and Applications, 10(2), 107-110.
[9]. Han, Q., Zhijun, R., Ying, X., Binbin D., & Hui, Z.. (2022). Early prediction method of diabetes based on multi-feature attribute similarity. Science, Technology and Engineering, 21(36), 15497-15502.
[10]. Han, J., Pei, J., & Tong, H. (2022). Data mining: concepts and techniques. Morgan Kaufmann.
[11]. Kaggle. (2024). https://www.kaggle.com/datasets/rabieelkharoua/diabetes-health-dataset-analysis
[12]. Zhu, T. (2020, August). Analysis on the applicability of the random forest. In Journal of Physics: Conference Series (Vol. 1607, No. 1, p. 012123). IOP Publishing.
[13]. Qin, X. (2020). Improvement and application of the random forest algorithm (Master's thesis, Lanzhou Jiaotong University). Master's degree.