


1. Introduction
COVID-19 is a global disaster, taking away millions of lives, destroying every country’s economy, and smashing many human cultures. Vaccines are the most important solution to controling the spread of this infectious disease [1,2]. On July 5, the British government announced that due to the large-scale vaccination, all restrictions would be lifted on July 19[3]. In fact, in May, the British government begun to gradually relax its control over the epidemics. However, according to the official data from the United Kingdom, since the control of social distance began to end, the number of infected people started to rebound, from 1354 per day on May 1st to 35707 per day on July 10th [4]. Therefore, it is worth studying whether the current vaccination rate in the UK can support the UK in ending all of the restrictions. The SIR model divides all people into three parts, including susceptible, infected, and recovered [5]. This paper aims to use the SIR model to predict the epidemics after ending all restrictions on social distance in the UK, which will help researchers and governments better understand the spread models of COVID-19 and dtermine a more appropriate time to end all restrictions.
2. Materials and methods
In order to establish a SIR model, this paper divided the population into three categories, S, I, and R. S represents the number of susceptible individuals; I means the number of infected individuals; and R indicates the number of individuals recovered (and immune) from the diseases. There is an assumption that the vaccines are 100% effective, which means the susceptible won’t be infected once they are vaccinated. As a result, the vaccine takes people from being susceptible to infection to being recovered. There is an another assumption that \( N=S+I+R \) is a constant that represents the total population of the country. It also needs to consider the probability that people from each category will meet and interact. In Fig. 2, beta represents the transmission rate, birth the birth rate, death the death rate, recovery the recovery rate, and vaccination the vaccination rate [2,6].
|
Figure 1. SIR model. |
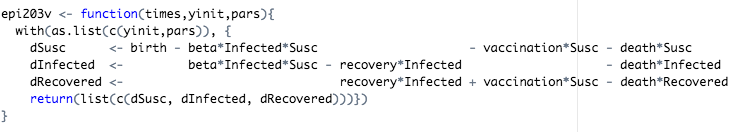
This image shows the SIR model with the vaccine.
When the SIR model is set, it is necessary to import the data from the British government and process it with R. The data includes the number of confirmed cases from March 1, 2021, to July 10, 2021. After getting the data, it uses the FME and rootSolve packages from R to fit the data to find the optimal parameters that fit the SIR model.
|
Figure 2. United Kingdom number of infected cases daily growth chart. [4]. |
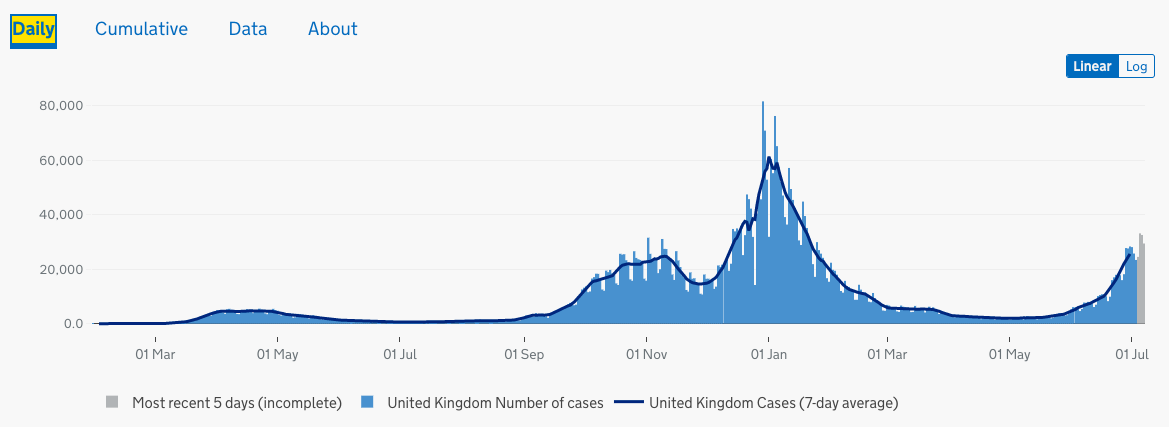
Figure 1 depicts the number of people who tested positive in the United Kingdom between March 1st and July 10th, 2021. It demonstrates that since the British government began to gradually reduce the restrictions on social distance in May, the number of infected people has increased again.
3. Results
After importing the data into the SIR model, R produced some parameters that fit the actual values best and an image that shows the distributions of fitted values and actual values about the daily infected cases.
|
Figure 3. The distributions of fitted values and actual values observed from SIR model through R. |
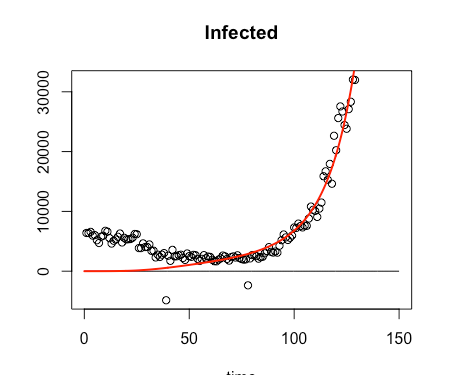
On this image, before May, because the British government was still implementing strict social distance control, our fitted values were not very close to the actual values. However, since May, social distance restrictions have been gradually reduced in the UK, and the fitted values have begun to approach the real values. The number of daily confirmed cases has also increased dramatically since May.
|
Figure 4. Parameters obtained from R software. |
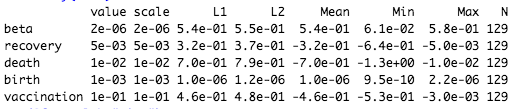
As shown in Figure 4, R processed the actual data and produced some optimal parameters, making the SIR model close to the real situation.
When putting these fitted parameters obtained from R into the SIR model again, we could get one image that predicts the spread of COVID-19 in the UK.
|
Figure 5. Illustration of the SIR model. |
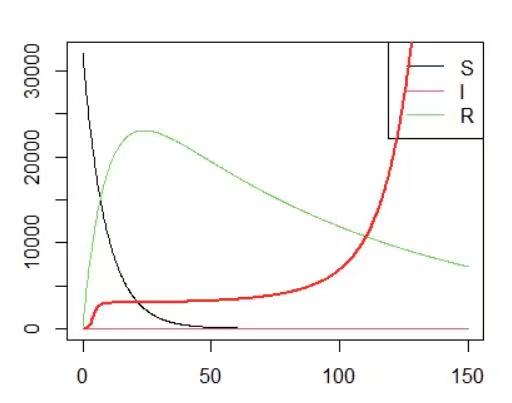
This image shows that it would take about 50 days to clear all the susceptibles, which means the British government should wait at least another 50 days before ending all restrictions on COVID-19. This paper assumes that vaccines are 100% effective, but the vaccine cannot guarantee that a vaccinated person will not become infected. As a result, the British government should wait longer before lifting all restrictions.
4. Conclusion
This paper is a study that forecasts the upcoming COVID-19 epidemics in the UK according to the official data from 2021 March 1st to July 10th based on the SIR model with vaccines. As of July 8, 2021, although 86.8% of the adult population in the UK has been vaccinated with the first dose of the vaccine, the number of people infected will continue to increase after deregulation, reaching approximately 30000 per day. The results also show that the governments should at least wait another 50 days to end the restrictions. There are still a lot of limitations to the SIR model, but it provides relatively precise forecasting about the COVID-19 epidemics in the UK. This SIR model uses two assumptions. The first assumption is that the vaccines are 100% effective. Future research should consider the vaccine's efficacy as well. The second assumption is that N is a constant. The following research can incorporate more refined population changes into the SIR model. It also needs to consider the probability that people from each category will meet and interact.
Acknowledgement
Throughout the writing of this paper, I would like to thank professor Oordero for his lectures, explanation and guidance. I would also like to thank my parents for their support and accompany.
References
[1]. Masaaki Ishikawa, “Optimal Strategies for Vaccination using the Stochastic SIRV Model”, Transactions of the Institute of Systems, Control and Information Engineers,Vol. 25, No. 12, pp. 343–348, 2012
[2]. Ross, Ronald (1 February 1916). "An application of the theory of probabilities to the study of a priori pathometry.—Part I". Proceedings of the Royal Society of London. Series A, Containing Papers of a Mathematical and Physical Character. 92 (638): 204–230. Bibcode:1916RSPSA..92..204R. doi:10.1098/rspa.1916.0007
[3]. “England May Be Lifting Nearly All Of Its Coronavirus Restrictions By July 19” https://www.npr.org/sections/coronavirus-live-updates/2021/07/05/1013215599/england-may-be-lifting-nearly-all-of-its-coronavirus-restrictions-by-july-19
[4]. The British government official website. https://coronavirus.data.gov.uk/
[5]. Harko, Tiberiu; Lobo, Francisco S. N.; Mak, M. K. (2014). "Exact analytical solutions of the Susceptible-Infected-Recovered (SIR) epidemic model and of the SIR model with equal death and birth rates". Applied Mathematics and Computation. 236: 184–194.
[6]. B. D. Ripley, “The R project in statistical computing,” MSOR connect., 1(1), 23–25, 2001
Cite this article
Zhang,C. (2023). Research on British epidemic forecast——Based on SIR model. Theoretical and Natural Science,6,35-38.
Data availability
The datasets used and/or analyzed during the current study will be available from the authors upon reasonable request.
Disclaimer/Publisher's Note
The statements, opinions and data contained in all publications are solely those of the individual author(s) and contributor(s) and not of EWA Publishing and/or the editor(s). EWA Publishing and/or the editor(s) disclaim responsibility for any injury to people or property resulting from any ideas, methods, instructions or products referred to in the content.
About volume
Volume title: Proceedings of the International Conference on Modern Medicine and Global Health (ICMMGH 2023)
© 2024 by the author(s). Licensee EWA Publishing, Oxford, UK. This article is an open access article distributed under the terms and
conditions of the Creative Commons Attribution (CC BY) license. Authors who
publish this series agree to the following terms:
1. Authors retain copyright and grant the series right of first publication with the work simultaneously licensed under a Creative Commons
Attribution License that allows others to share the work with an acknowledgment of the work's authorship and initial publication in this
series.
2. Authors are able to enter into separate, additional contractual arrangements for the non-exclusive distribution of the series's published
version of the work (e.g., post it to an institutional repository or publish it in a book), with an acknowledgment of its initial
publication in this series.
3. Authors are permitted and encouraged to post their work online (e.g., in institutional repositories or on their website) prior to and
during the submission process, as it can lead to productive exchanges, as well as earlier and greater citation of published work (See
Open access policy for details).
References
[1]. Masaaki Ishikawa, “Optimal Strategies for Vaccination using the Stochastic SIRV Model”, Transactions of the Institute of Systems, Control and Information Engineers,Vol. 25, No. 12, pp. 343–348, 2012
[2]. Ross, Ronald (1 February 1916). "An application of the theory of probabilities to the study of a priori pathometry.—Part I". Proceedings of the Royal Society of London. Series A, Containing Papers of a Mathematical and Physical Character. 92 (638): 204–230. Bibcode:1916RSPSA..92..204R. doi:10.1098/rspa.1916.0007
[3]. “England May Be Lifting Nearly All Of Its Coronavirus Restrictions By July 19” https://www.npr.org/sections/coronavirus-live-updates/2021/07/05/1013215599/england-may-be-lifting-nearly-all-of-its-coronavirus-restrictions-by-july-19
[4]. The British government official website. https://coronavirus.data.gov.uk/
[5]. Harko, Tiberiu; Lobo, Francisco S. N.; Mak, M. K. (2014). "Exact analytical solutions of the Susceptible-Infected-Recovered (SIR) epidemic model and of the SIR model with equal death and birth rates". Applied Mathematics and Computation. 236: 184–194.
[6]. B. D. Ripley, “The R project in statistical computing,” MSOR connect., 1(1), 23–25, 2001