


1. Introduction
Churn prediction plays an important role in the telecom industry. When people change their mobile phones, the change of telecom service may happen because of a higher cost-effectiveness. Therefore, detecting potential customers that have probability to churn may benefit the related company. According to Ribeiro et al., customer retention outweighs attracting new customers, considering the overall cost [1].
Several studies were conducted in this field. Xiahou and Harada proposed B2C e-commerce by combining k-means clustering with SVM and found a higher accuracy than logistic regression [2]. Asif et al. introduced a new ensemble model by using the weighted probability of XGBoost, CatBoost, and LightGBM, which had a better performance than other single models [3].
With the development of deep learning, more and more scientists have applied deep learning to churn prediction. Ajao invented a combined method of Relief-F feature selection and CNN, which achieved higher accuracy than random forest [4]. Domingos et al. analyzed the DNN model in the banking sector and stated that hyperparameters and optimizers significantly affect model performance [5]. Khattak et al. applied BiLSTM followed by CNN in prediction and obtained notable accuracy [6]. A ChurnNet model was constructed by Saha et al., incorporating a combination of residual connections, modules for channel-wise recalibration, and mechanisms for spatial attention [7]. Liu et al. integrated Multi-Head Self-Attention into a BiLSTM-CNN model and further boosted the accuracy [8].
Manzoor et al. collected and compared 212 essays, suggesting that ensembled models and deep learning models are recommended in future exploration [9]. Although there is a large amount of research in ensembled deep learning models, deep learning models with complex structures have a high computational cost and may not be useful in the real world [8], and there are few studies in integrating deep learning and machine learning together as an ensembled model in the telecom churn field. This essay proposed an ensemble model of DNN and XGBoost, stacked by logistic regression, which has both high prediction accuracy and low computational cost. It also provides references for the telecom field and future research.
2. Method
2.1. Data preprocessing
The training data and testing data were obtained from Kaggle, where there are 20 columns and 4250 rows in the training set, 750 rows in the testing set [10]. The 'state’ column was dropped, considering that there are 51 different string values. Additionally, one-hot coding was used in the area_code column, so that three columns representing different area values were generated. Besides, all the data were normalized to achieve a zero mean and unit variance. Finally, 20% training data was split into a validation set.
2.2. Data augmentation
Asif et al. applied SMOTE to balance the dataset, leading to more 'churn’ data to avoid the bias of the model [3]. However, balancing the training set may not improve the model in the real world. If the training data is sampled from recent historical data, the distribution of the future customer may have a similar churn distribution to historical customers. Therefore, retaining the original distribution may help prediction.
In this model, SVM selection was applied to augment the 'boundary data’, the data points situated near the separation boundary, which are more likely to be misclassified as the opposite class by the model. Specifically, an SVM model with an RBF kernel was trained. The distance of each sample to the SVM decision hyperplane was calculated. For both classes, churn and not churn, several samples closest to the decision boundary were augmented with 0.1 level Gaussian noise. The newly generated samples were combined with the original training data to create an augmented dataset. In this way, the churn rate did not change, and it helped the model better learn the pattern of 'boundary data’.
2.3. Model construction
Mohammed and Kora introduced a stacking-based ensemble method, where several distinct models independently generate predictions, which are then integrated by an additional model to determine the final result [11]. DNN and XGBoost were selected as level-0 models, where DNN has high predictive ability [5], and XGBoost contributes to lower variance [11]. To capture the relationships between the outputs of the two base models, logistic regression was selected as the meta-learner at the second layer.
For the DNN model, the network architecture allocated 64 computational units to the first hidden layer and 32 to the second. Throughout the hidden layers, the ReLU function was applied, whereas the concluding layer used a sigmoid activation function to derive the model's final output, which scaled the value into 0 to 1. If the value is higher than 0.5, the final prediction will be 'churn’. AdamW was set as the optimizer, and the size of the batch was fixed to 16. To enable the model to effectively handle data it has not encountered during training, a 0.4 dropout rate was applied, meaning that during training, 40% of the neurons in each layer were randomly omitted. Besides, batch normalization was deployed to accelerate training and alleviate gradient issues. CosineAnnealing with warmup from 1e-4 to 1e-6 was used as the learning rate scheduling. Lastly, binary cross-entropy was used because there were only two types of output.
When implementing XGBoost, parameters were specified as follows: 200 as the number of estimators, 0.05 for the learning rate, 5 for the maximum depth, and both the subsample and colsample_bytree values fixed at 0.8, and log loss was adopted as the evaluation metric.
Random forest was also constructed to compare with the ensembled model, where the model was adjusted to use 50 estimators and a tree depth limit of 10.
2.4. Model evaluation
Although Kaggle offered test data to check the accuracy, other valuation metrics like recall or precision could not be seen in the test data [10]. Besides, the rate of public data and private data was unknown. Therefore, the valid dataset instead of the Kaggle test set was used for evaluation. All the models used the same valid data set, so the validation dataset’s performance metrics, for example, F1-score and accuracy, could be compared.
3. Result
Table 1 shows accuracy, F1-score, recall, and precision for several models. There are SDB, DNN, XGBoost and Random Forest. Besides, there are four SDB models with different SVM augmentation rates, ranging from 0 to 0.3 with a step size of 0.1. Overall, all the SDB models obtained higher accuracy and F1-score than other single models. SDB with 10% boundary data augmentation achieved the best performance. SDB with 20% boundary data augmentation achieved a similar performance but a slightly lower F1-score. Meanwhile, SDB with no data augmentation and SDB with 30% data augmentation achieved the third highest accuracy, while the former had lower recall than DNN, and the latter had lower precision than Random Forest.
|
accuracy |
F1-score |
recall |
precision |
|
|
SDB-no noise |
0.9694 |
0.8908 |
0.8217 |
0.9725 |
|
SDB-0.1 noise |
0.9718 |
0.9008 |
0.8450 |
0.9646 |
|
SDB-0.2 noise |
0.9718 |
0.9000 |
0.8372 |
0.9730 |
|
SDB-0.3 noise |
0.9694 |
0.8926 |
0.8372 |
0.9558 |
|
DNN |
0.9682 |
0.8880 |
0.8295 |
0.9554 |
|
XGBoost |
0.9647 |
0.8739 |
0.8062 |
0.9541 |
|
Random forest |
0.9612 |
0.8584 |
0.7752 |
0.9615 |
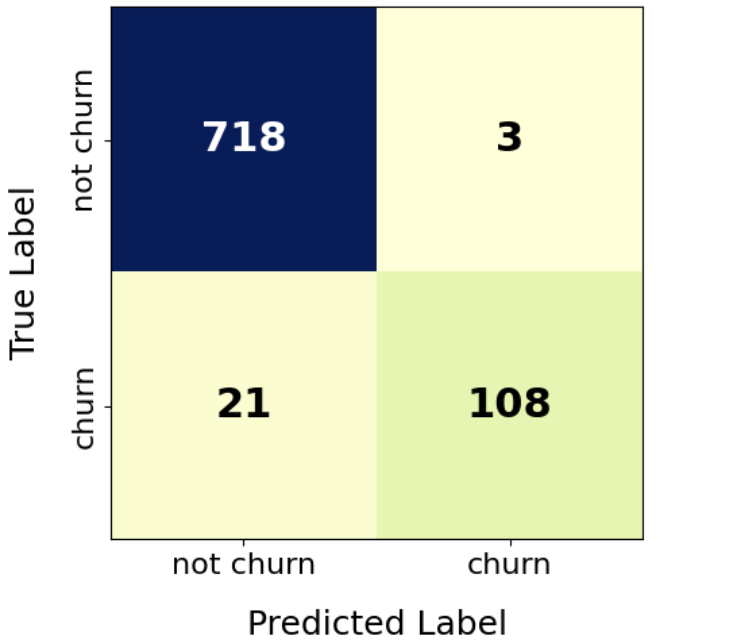
Figure 1 demonstrates the confusion matrix of the SDB model with 20% boundary data augmentation. The model successfully predicted 718 out of 721 non-churn customers and 108 out of 129 churn customers. Notably, the model predicted 111 churn customers, and 108 of them were correct.
4. Discussion
The SDB model, no matter whether augmented no not, achieved higher accuracy and F1-score than DNN, XGBoost, and Random Forest, meaning that the ensembled stack structure made the model more effective. The SDB model used logistic regression to combine both DNN predictions and XGBoost predictions into a final prediction, absorbing both the advantages of the two models.
The SDB model with 10% and 20% boundary data augmentation achieved notably higher accuracy and F1-score than the base SDB model with no boundary data augmentation, indicating that the SVM boundary data augmentation helped the model to capture the pattern of the boundary data that was difficult to classify. However, when the augmentation rate increased to 30%, the accuracy, F1-score, and precision significantly decreased. One possible reason may be that although the SVM boundary data did not change the rate of the label, churn and not churn, it changed the distribution of data. Therefore, there was a trade-off between abstracting attention to boundary data and shifting the distribution of original data. When the augmentation rate is too high, some of the data that is not near the boundary may be augmented, making no effect but adding meaningless noise to the data. Therefore, it is crucial to choose a suitable rate in SVM augmentation.
The SDB models tend to have high precision but low recall. Take SDB with 20% boundary data augmentation as an example, its precision achieved 0.9730, but it only had 0.8372 recall. It is acceptable because sometimes high precision may be more beneficial than high recall. 0.9730 precision means that if the model finds 1000 customers that may churn, 973 of them will churn. In the real world, companies will take action on customers who are predicted by the model to churn, and these customers have a 97.3% probability of churning. This means that 97.3% of the company's resources are effectively used on customers who are truly at risk of churning. If the model's recall is high but its precision is low, although most churn customers will be identified, the company will end up wasting a lot of resources on customers who are not about to churn. This, in turn, goes against the original intention of increasing company revenue by improving customer retention. Therefore, this SDB model is of certain value to the telecom industry.
There are some limitations in this research. The SDB model only used the Kaggle dataset, which may have some differences from the telecom data in the real world. For example, a real-world dataset may contain several temporal data on each customer, which enables more advanced models like using LSTM instead of DNN to improve accuracy. Besides, since only a radial basis function kernel was used and 0.1 level Gaussian noise was applied in the SVM boundary data augmentation, other choices like linear kernel and various noise levels could be compared in a future study.
5. Conclusion
The proposed SDB model selected boundary data using SVM to make partial augmentation, and trained data with DNN and XGBoost, spreading both predictions to a logistic regression to export the final prediction. With a suitable augmentation rate, it showed significant improvement compared to a single DNN, machine learning model, and base ensembled model. Not only did this work propose a novel approach for data augmentation, but it also bridged the gap by integrating traditional machine learning techniques alongside advanced neural network architectures for telecom churn analysis. Besides, the high precision of the model enables companies to retain customers without wasting many resources. Meanwhile, more types of datasets in the real world, like temporal data, could be applied in this model, and various choices of hyperparameters and models could be explored to optimize the performance.
References
[1]. Ribeiro, H., Barbosa, B., Moreira, A.C. et al. Determinants of churn in telecommunication services: a systematic literature review. Manag Rev Q 74, 1327–1364 (2024).
[2]. Xiahou, X.; Harada, Y. B2C E-Commerce Customer Churn Prediction Based on K-Means and SVM. J. Theor. Appl. Electron. Commer. Res. 2022, 17, 458-475.
[3]. Daniyal Asif, Muhammad Shoaib Arif, Aiman Mukheimer, A data-driven approach with explainable artificial intelligence for customer churn prediction in the telecommunications industry, Results in Engineering, Volume 26, 2025, 104629, ISSN 2590-1230.
[4]. Ajao J. A Churn Prediction System for Telecommunication Company Using Random Forest and Convolution Neural Network Algorithms. ICST Transactions on Mobile Communications and Applications. doi: 10.4108/EETMCA.V6I21.2181
[5]. Domingos, E.; Ojeme, B.; Daramola, O. Experimental Analysis of Hyperparameters for Deep Learning-Based Churn Prediction in the Banking Sector. Computation 2021, 9, 34.
[6]. Khattak, A., Mehak, Z., Ahmad, H. et al. Customer churn prediction using composite deep learning technique. Sci Rep 13, 17294 (2023).
[7]. S. Saha, C. Saha, M. M. Haque, M. G. R. Alam and A. Talukder, "ChurnNet: Deep Learning Enhanced Customer Churn Prediction in Telecommunication Industry, " in IEEE Access, vol. 12, pp. 4471-4484, 2024, doi: 10.1109/ACCESS.2024.3349950.
[8]. Liu, X., Xia, G., Zhang, X. et al. Customer churn prediction model based on hybrid neural networks. Sci Rep 14, 30707 (2024).
[9]. A. Manzoor, M. Atif Qureshi, E. Kidney and L. Longo, "A Review on Machine Learning Methods for Customer Churn Prediction and Recommendations for Business Practitioners, " in IEEE Access, vol. 12, pp. 70434-70463, 2024, doi: 10.1109/ACCESS.2024.3402092.
[10]. Kostas Diamantaras. Customer Churn Prediction 2020. https: //kaggle.com/competitions/customer-churn-prediction-2020, 2020. Kaggle.
[11]. Ammar Mohammed, Rania Kora, A comprehensive review on ensemble deep learning: Opportunities and challenges, Journal of King Saud University - Computer and Information Sciences, Volume 35, Issue 2, 2023, Pages 757-774, ISSN 1319-1578.
Cite this article
Ge,Q. (2025). An Ensembled DNN and XGBoost Model with SVM Augmentation in Churn Prediction. Theoretical and Natural Science,132,72-77.
Data availability
The datasets used and/or analyzed during the current study will be available from the authors upon reasonable request.
Disclaimer/Publisher's Note
The statements, opinions and data contained in all publications are solely those of the individual author(s) and contributor(s) and not of EWA Publishing and/or the editor(s). EWA Publishing and/or the editor(s) disclaim responsibility for any injury to people or property resulting from any ideas, methods, instructions or products referred to in the content.
About volume
Volume title: Proceedings of CONF-APMM 2025 Symposium: Simulation and Theory of Differential-Integral Equation in Applied Physics
© 2024 by the author(s). Licensee EWA Publishing, Oxford, UK. This article is an open access article distributed under the terms and
conditions of the Creative Commons Attribution (CC BY) license. Authors who
publish this series agree to the following terms:
1. Authors retain copyright and grant the series right of first publication with the work simultaneously licensed under a Creative Commons
Attribution License that allows others to share the work with an acknowledgment of the work's authorship and initial publication in this
series.
2. Authors are able to enter into separate, additional contractual arrangements for the non-exclusive distribution of the series's published
version of the work (e.g., post it to an institutional repository or publish it in a book), with an acknowledgment of its initial
publication in this series.
3. Authors are permitted and encouraged to post their work online (e.g., in institutional repositories or on their website) prior to and
during the submission process, as it can lead to productive exchanges, as well as earlier and greater citation of published work (See
Open access policy for details).
References
[1]. Ribeiro, H., Barbosa, B., Moreira, A.C. et al. Determinants of churn in telecommunication services: a systematic literature review. Manag Rev Q 74, 1327–1364 (2024).
[2]. Xiahou, X.; Harada, Y. B2C E-Commerce Customer Churn Prediction Based on K-Means and SVM. J. Theor. Appl. Electron. Commer. Res. 2022, 17, 458-475.
[3]. Daniyal Asif, Muhammad Shoaib Arif, Aiman Mukheimer, A data-driven approach with explainable artificial intelligence for customer churn prediction in the telecommunications industry, Results in Engineering, Volume 26, 2025, 104629, ISSN 2590-1230.
[4]. Ajao J. A Churn Prediction System for Telecommunication Company Using Random Forest and Convolution Neural Network Algorithms. ICST Transactions on Mobile Communications and Applications. doi: 10.4108/EETMCA.V6I21.2181
[5]. Domingos, E.; Ojeme, B.; Daramola, O. Experimental Analysis of Hyperparameters for Deep Learning-Based Churn Prediction in the Banking Sector. Computation 2021, 9, 34.
[6]. Khattak, A., Mehak, Z., Ahmad, H. et al. Customer churn prediction using composite deep learning technique. Sci Rep 13, 17294 (2023).
[7]. S. Saha, C. Saha, M. M. Haque, M. G. R. Alam and A. Talukder, "ChurnNet: Deep Learning Enhanced Customer Churn Prediction in Telecommunication Industry, " in IEEE Access, vol. 12, pp. 4471-4484, 2024, doi: 10.1109/ACCESS.2024.3349950.
[8]. Liu, X., Xia, G., Zhang, X. et al. Customer churn prediction model based on hybrid neural networks. Sci Rep 14, 30707 (2024).
[9]. A. Manzoor, M. Atif Qureshi, E. Kidney and L. Longo, "A Review on Machine Learning Methods for Customer Churn Prediction and Recommendations for Business Practitioners, " in IEEE Access, vol. 12, pp. 70434-70463, 2024, doi: 10.1109/ACCESS.2024.3402092.
[10]. Kostas Diamantaras. Customer Churn Prediction 2020. https: //kaggle.com/competitions/customer-churn-prediction-2020, 2020. Kaggle.
[11]. Ammar Mohammed, Rania Kora, A comprehensive review on ensemble deep learning: Opportunities and challenges, Journal of King Saud University - Computer and Information Sciences, Volume 35, Issue 2, 2023, Pages 757-774, ISSN 1319-1578.