


1. Introduction
With the development of neural network models, the problem of stock price prediction has increasingly attracted attention. This issue has had a remarkable impact on the general public, especially on groups of highly enthusiastic investors. In practical terms, solving the stock prediction problem can greatly reduce asset losses caused by blind investment decisions, while improving the relative success rate and efficiency of stock purchases among investors.
This paper addresses the stock price prediction problem by comparing the predictive accuracy and model complexity of different neural network approaches. The CAR-BPNN model offers excellent linear and nonlinear prediction capabilities, enabling it to comprehensively reflect various types of information in the stock price system. The variable-structure temporal neural network can transform stock data into temporal data, making it more suitable for nonlinear and nonstationary data environments. The DAE-BP neural network excels in handling stock prediction problems where multicollinearity exists among indicators. Other methods include models based on improved Artificial Fish Swarm Algorithm with RBF neural networks, neural network learning algorithms using Extended Kalman Filter, models combining GRU and ALBERT, and short-term stock prediction models based on LAMSTAR neural networks.
This paper is organized into five sections: Literature Review, Methodology, Results, Discussion, and Conclusion. The Literature Review introduces the research landscape of stock price prediction. Methodology describes the methods used in this study. Results presents experimental findings in data and chart form. Discussion provides subjective analysis of the results, exploring the reasons behind them. Conclusion summarizes the study’s findings and reflections.
2. Literature review
For the problem of stock price prediction, different scholars have proposed a variety of methods. Some have focused on approaches suitable for markets with long-term information. For example, Meng and Zhu [1] transformed stock data into temporal data and built a variable-structure model. Yan and Li [2] demonstrated unique advantages in predicting closing prices and achieved results that generalize well across multiple markets. Yuan et al. [3] introduced the concept of investor sentiment factors, which effectively reduced prediction errors and improved model fit. Qin et al. [4] enhanced the original BP model by applying time-series forecasting methods and integrating it with the Particle Swarm Optimization algorithm, significantly improving prediction performance. Guo [5] combined Genetic Algorithms (GA) with BP neural networks using Principal Component Analysis, achieving high prediction accuracy. Ai [6] replaced the BP network's gradient-descent-based weight adjustment with a globally optimized PSO approach, greatly mitigating the BP network’s tendency to get stuck in local minima and its slow convergence issues. Xu et al. [7] proposed a bidirectional gated recurrent unit with residual graph attention networks, effectively mining and fusing critical stock features by dynamically weighting node relationships in financial graphs. Liu [8] integrated complex network analysis with LSTM, capturing topological structures of stock markets. Preprocessed market data via independent component analysis to suppress noise and enhance real-time prediction robustness. Zhang and Hao [9] designed an encoder-decoder architecture with attention mechanisms, enabling adaptive focus on key temporal patterns in financial sequences and improving long-range dependency modeling. Hu [10] constructed a hybrid GARCH-RNN model that synergizes statistical volatility modeling (GARCH) with deep sequential learning (RNN), significantly improving volatility forecasting accuracy. Luo and Zhang [11] developed a multi-scale feature extraction framework to capture complex price dynamics, enhancing prediction precision and generalization for investment decision support. Shi and Zi [12] combined wavelet theory with support vector regression (SVR), decomposing price series into multi-resolution components to boost stability against market noise. Zhou et al. [13] Proposed SDAE-CNN-BiLSTM-CM, a novel architecture fusing channel attention and multi-head self-attention to address nonlinearity, multi-scale patterns, and high noise in stock time series. However, other researchers have developed methods tailored to predicting markets with short-term information. For example, Xie et al. [14] used mass calculation in gravitational search to adaptively weight the vision range of the Artificial Fish Swarm Algorithm and updated its step size using acceleration calculations from gravitational search. He and Chen [15] specialized in handling markets with large volumes of historical data. Cui and Huang [16] incorporated attention mechanisms into various algorithms and found that combinations featuring GRU models performed especially well. Xie and Li [17] employed the LAMSTAR model for short-term stock price prediction. Tao [18] achieved strong prediction performance in stock classification tasks using the C5.0 version of the decision tree model. Therefore, in the domain of stock price prediction, despite variations in prediction horizons, data volume, and market conditions, there are always different methods—or improved versions of existing methods—capable of providing tailored solutions for diverse market scenarios. Moreover, these methods continue to be refined and innovated over time.
3. Methodology
Based on prior experience, neural network methods have proven suitable for stock price prediction. The neural network architecture adopted in this study uses a layered layout of neurons, consisting of an input layer, hidden layers, and an output layer. The input layer receives the input data, while the output layer delivers the network's prediction results. The hidden layers lie between the input and output layers and are not directly visible externally. Neurons within the same layer are not connected to each other. Each neuron in layer
Computation of Network Output: Essentially, a neural network functions as a mapping from an input vector to an output vector, like
To compute the output, the elements of the input vector are first assigned to the corresponding neurons in the input layer. Then, using the neuron output calculation formula, with the Sigmoid function as the activation function,
The values of each neuron are calculated layer by layer in a forward pass until the output layer is reached. The final values of the output layer neurons are combined to form the network’s output vector.
Matrix Representation: The computations in each layer of the neural network can be represented in matrix form. For a given layer, if the input vector is
This means performing a linear transformation (matrix multiplication) on the input vector, followed by an element-wise application of the activation function.
Training the Neural Network: The core of training lies in determining the weights of the connections (model parameters), while aspects such as the network's connection pattern, number of layers, and the number of neurons per layer are hyperparameters set manually. Training is performed using the backpropagation algorithm, which includes the following steps: Computing the outputs of each layer based on the input features; Calculating the error terms for the output and hidden layers, with the output layer error term given by:
and the hidden layer error term given by:
Updating the weights using:
where
4. Results
The dataset used in this study comprehensively records Apple Inc. (AAPL)’s stock price movements over the past 44 years, including key features such as date, opening price, daily high, daily low, closing price, adjusted closing price, and trading volume.
For the purposes of this study, the selected features were opening price, daily high, daily low, closing price, and trading volume. Data was collected for three different time spans: 1 year (May 24, 2023 – May 24, 2024), 3 years (May 24, 2021 – May 24, 2024), and 5 years (May 24, 2019 – May 24, 2024). All data were normalized using the MinMaxScaler method.
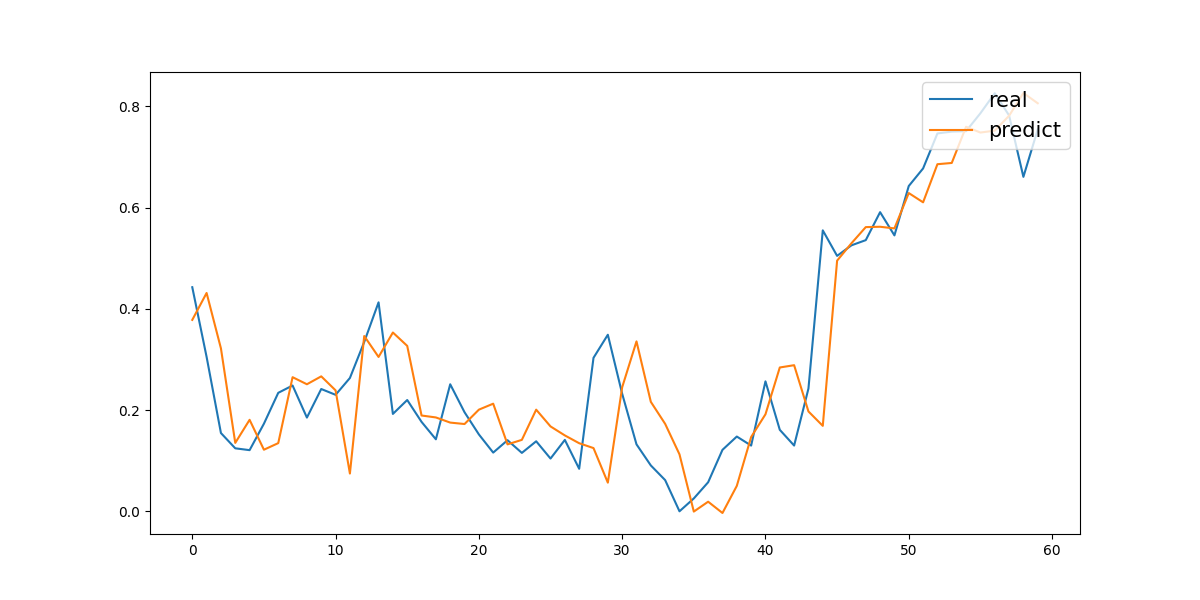
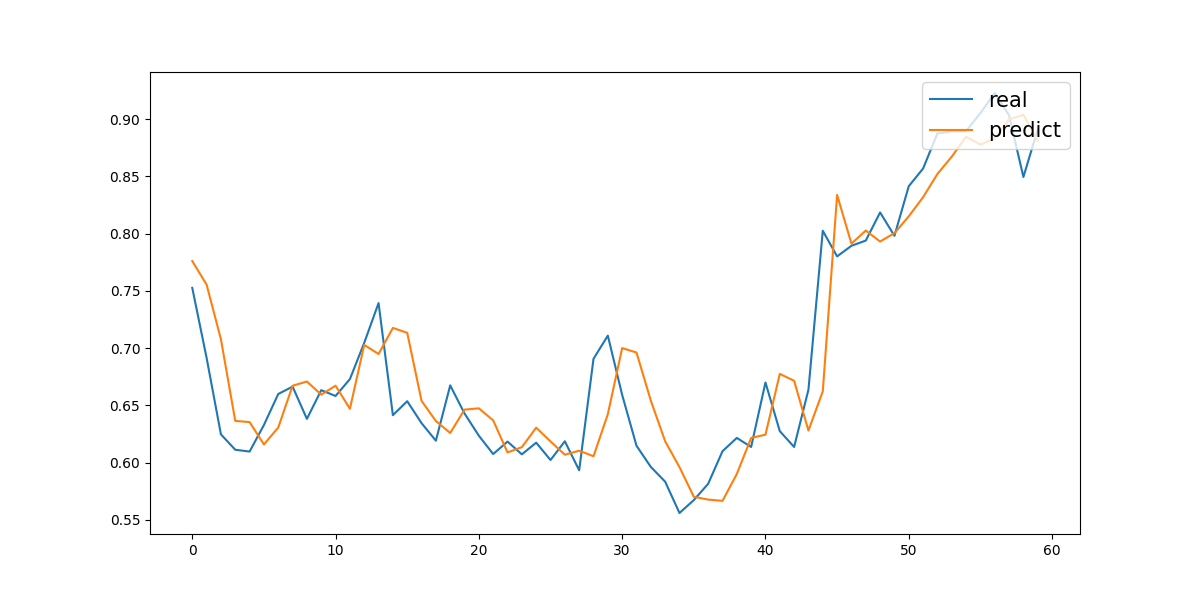
The experiment was divided into six comparative groups: predictions over 1-year, 3-year, and 5-year periods with trading volume included as a feature, and predictions over 1-year, 3-year, and 5-year periods without trading volume. All groups shared common settings of 1,000 training epochs and a learning rate of 0.2. For the first three groups (with volume), the network architecture consisted of three layers, with 5, 16, and 1 neurons in each layer, respectively. For the latter three groups (without volume), the network also had three layers, but the number of neurons per layer was set to 4, 16, and 1. In all cases, the last 60 days of the dataset were used as the test set, while the remaining data were used as the training set according to the experimental design. Specifically, the first experiment was a one-year prediction with trading volume included. On the test set, it achieved a Mean Absolute Error (MAE) of 0.07557 and a Mean Squared Error (MSE) of 0.01100. The corresponding prediction curves are shown in Figure 1.
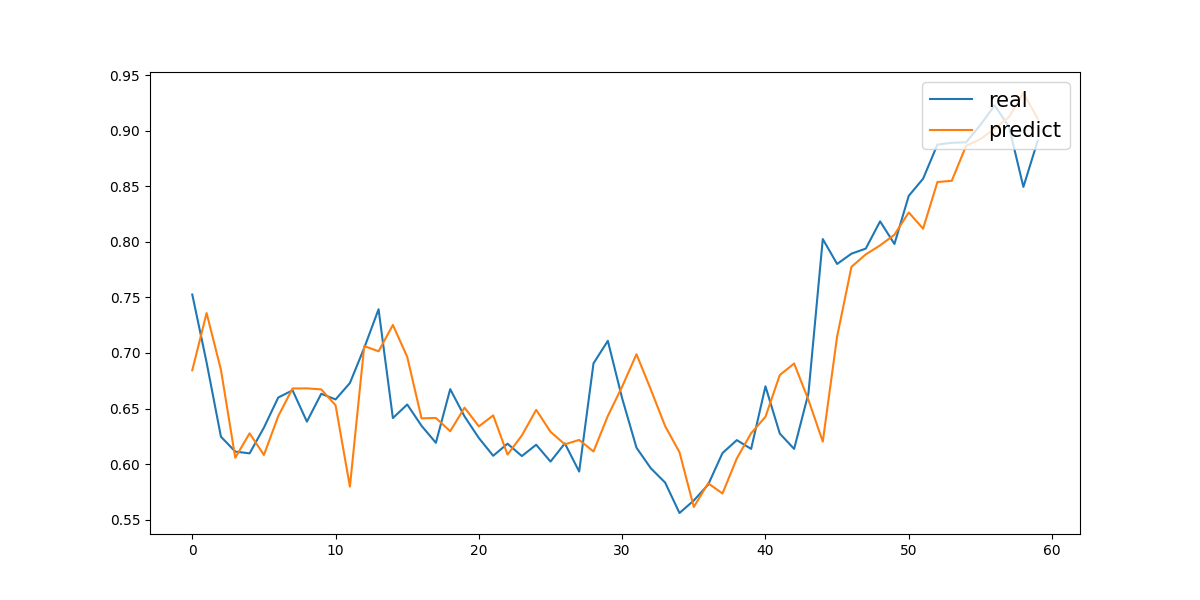
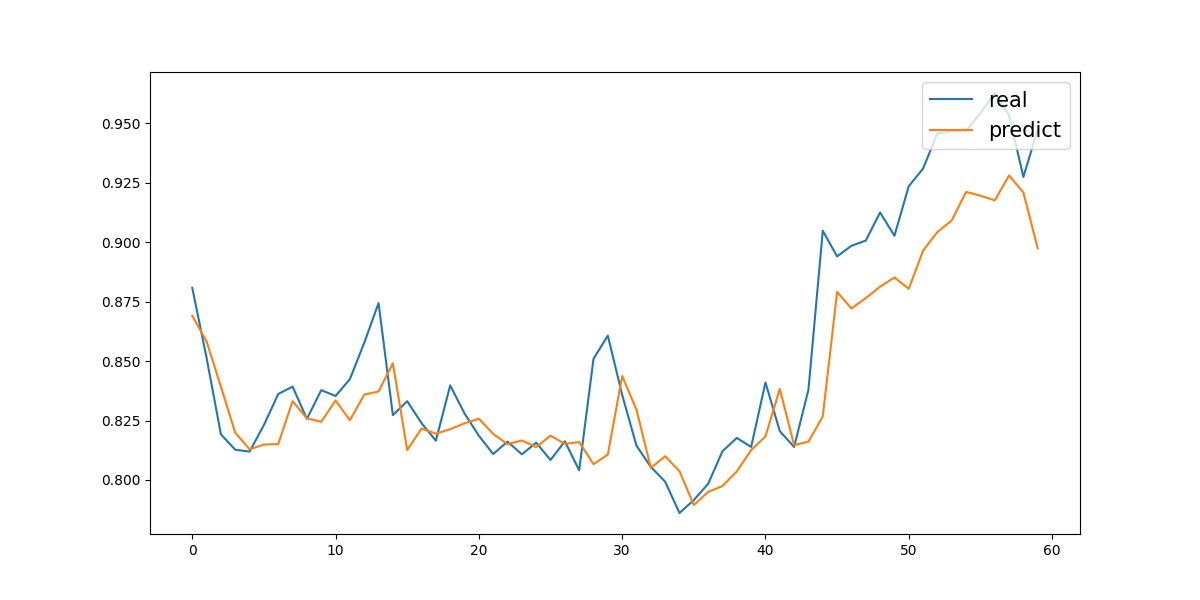
The second experiment was a three-year prediction with trading volume included. On the test set, it achieved a Mean Absolute Error (MAE) of 0.03338 and a Mean Squared Error (MSE) of 0.00215. The corresponding prediction curve is shown in Figure 2.
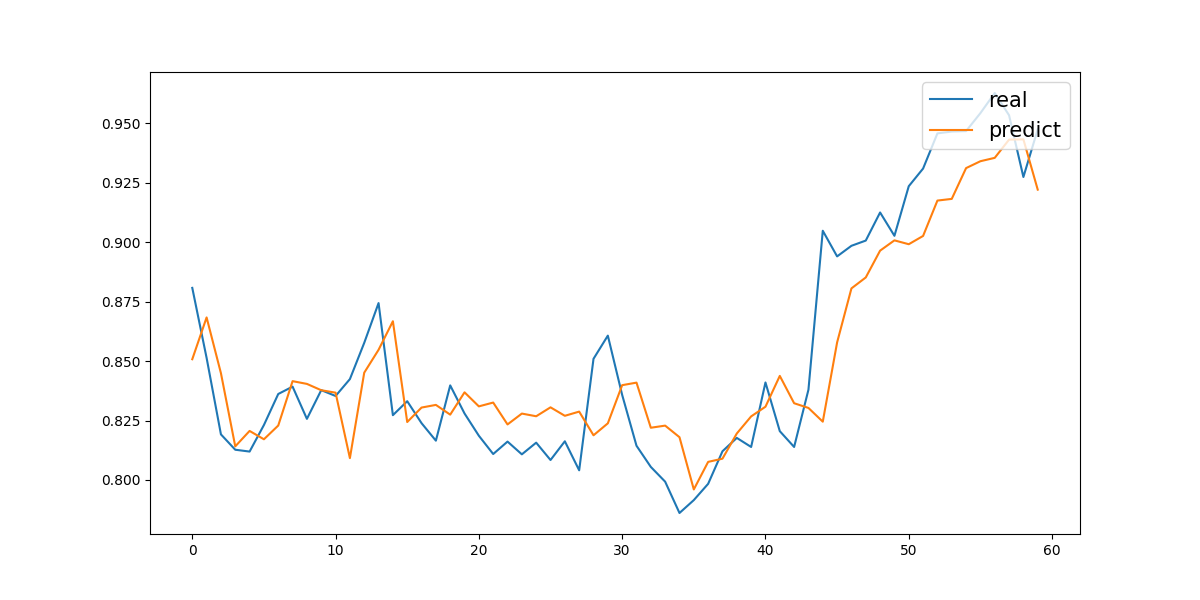
The third experiment was a five-year prediction with trading volume included. On the test set, it achieved a Mean Absolute Error (MAE) of 0.01765 and a Mean Squared Error (MSE) of 0.00048. The corresponding prediction curve is shown in Figure 3.
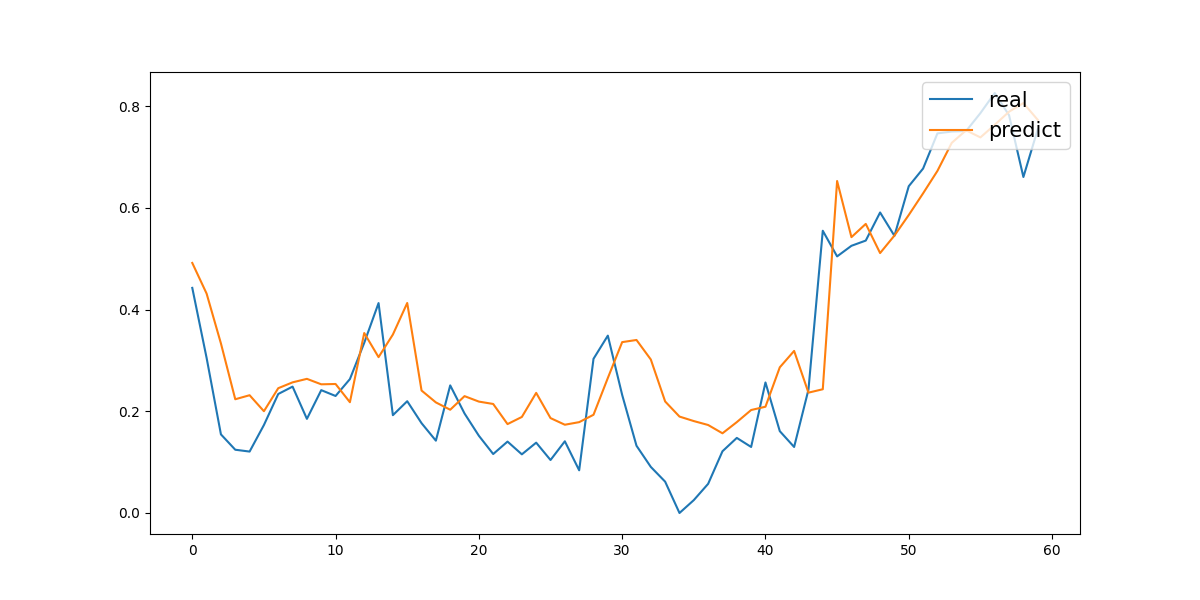
The fourth experiment was a one-year prediction without trading volume. On the test set, it achieved a Mean Absolute Error (MAE) of 0.08279 and a Mean Squared Error (MSE) of 0.01101. The corresponding prediction curve is shown in Figure 4.
The fifth experiment was a three-year prediction without trading volume. On the test set, it achieved a Mean Absolute Error (MAE) of 0.03183 and a Mean Squared Error (MSE) of 0.00171. The corresponding prediction curve is shown in Figure 5.
The sixth experiment was a five-year prediction without trading volume. On the test set, it achieved a Mean Absolute Error (MAE) of 0.01788 and a Mean Squared Error (MSE) of 0.00057. The corresponding prediction curve is shown in Figure 6.
Experimental results are summarized below:
|
One Year |
Three Year |
Five Year |
||
|
With Volume (MAE / MSE) |
MAE |
0.07557 |
0.03338 |
0.01765 |
|
MSE |
0.01100 |
0.00215 |
0.00048 |
|
|
Without Volume (MAE / MSE) |
MAE |
0.08279 |
0.03183 |
0.01788 |
|
MSE |
0.01101 |
0.00171 |
0.00057 |
5. Discussion
In summary, the results from all six experiments show that, based on the dataset used in this study, the predicted curves closely match the actual curves, indicating that the prediction errors are generally small and the overall forecasting performance is strong. Moreover, examining the evaluation metrics used in this study—MAE and MSE—shows that the MAE values range from 0.01765 to 0.08279, and the MSE values range from 0.00048 to 0.01101. This similarity in results across the six experimental groups further demonstrates that the selected dataset is balanced, consistent, and relatively stable. Looking at the experiments in detail, two important observations emerge. First, the study deliberately split the data into time spans of 1, 3, and 5 years. Under otherwise identical conditions, it was found that longer time spans produced better prediction results. This finding supports the value of using more historical data when available and confirms that the historical patterns in the dataset used here are strong and consistent. Second, the study focused on five feature dimensions: opening price, daily high, daily low, closing price, and trading volume. The comparative experiments differed only in whether trading volume was included. The results show that, for the same time span, including trading volume consistently led to better prediction performance. This demonstrates the value of trading volume as a feature, as it adds additional information not captured by the other price-based features alone.
Taken together, these findings highlight that stock price prediction is influenced by many factors, such as dataset choice, time-span length, and feature selection. Each of these can have positive or negative impacts on predictive performance. Furthermore, the study reveals that for any specific research context, there exists an optimal range of parameter settings. Achieving the best prediction results therefore requires systematic experimentation to identify the most suitable configuration.
6. Conclusion
This study focused on a popular stock in the current market and used controlled experiments to intuitively verify the feasibility of applying neural networks for stock price prediction. The results also highlighted how predictive performance varies under different experimental conditions.
However, the study has certain limitations. First, since the experiments were based on daily predictions, the total volume of usable data was limited, which constrained the overall learning capacity of the model. Second, the model's generalization ability is insufficient because it considered only a single stock. Additionally, the number of feature dimensions used in this study was relatively small. To address these limitations, future researchers could consider several directions for further work. One approach is to use finer time granularity, such as breaking data down to hourly intervals. Another is portfolio optimization, which involves combining financial investment theories to predict and optimize portfolio strategies, thereby enabling differentiated prediction strategies for different stocks. Finally, feature engineering could be expanded to include a wider range of independent feature dimensions to enhance model performance.
References
[1]. Meng, Z., & Zhu, H. (2020). Application of variable-structure temporal neural network model in stock prediction. Computer Engineering and Design, 41(6), 9.
[2]. Yan, D., & Li, B. (2022). Stock prediction based on generative adversarial neural networks. Computer Engineering and Applications, 58(13), 10.
[3]. Yuan, J., Pan, S., Xie, H., & Xu, W. (2024). Stock price prediction model S_AM_BiLSTM integrating investor sentiment. Computer Engineering and Applications, 60(7), 274–281.
[4]. Qin, Y., Zhu, H., & Li, X. (2008). Application of BP network optimized by improved particle swarm algorithm in stock prediction. Computer Engineering and Science, 30(4), 66–68.
[5]. Guo, P. (2019). Multi-day stock price prediction based on GA-BP neural network (Doctoral dissertation, Zhengzhou University).
[6]. Ai, Y. (2009). Modeling and application of particle swarm optimization neural network in stock market prediction (Doctoral dissertation, Hefei University of Technology).
[7]. Xu, M., Wang, C., Shi, H., Chen, M., & Liu, D., (2024). Stock price prediction model based on BiGRU and graph attention network with residual. Journal of Hubei University: Natural Science, 46(2), 270-281.
[8]. Liu, S., (2025). Analysis of Stock Price Prediction Methods Using LSTM Machine Learning Models. Hangzhou Dianzi University (Doctoral dissertation).
[9]. Zhang, X., & Hao, Y., (2023). Deep Learning-Based Stock Price Prediction Research, Computer Knowledge and Technology, 19(33), 8-10.
[10]. Hu, Y., (2023). Stock Price Forecasting Using Time Series Analysis and Neural Network Models, Guangdong University of Finance & Economics (Doctoral dissertation).
[11]. Luo, Y., & Zhang, G., (2025). Convolutional and Attention-Enhanced Methods for Stock Price Forecasting. Journal of Yunnan University of Nationalities(Natural Sciences Edition), 1-13.
[12]. Shi, Y., & Z, X., (2024). An Integrated Time-Varying Copula and Wavelet-SVR Framework Incorporating Investor Sentiment: Methodology and Empirical Application. Statistics & Decision. 40(16), 140-145.
[13]. Zhou, J., Liu, C., & Liu, J., (2025). Stock Price Trend Prediction Model Integrating Channel and Multi-Head Attention Mechanisms. Computer Engineering and Applications. 61(8), 324-338.
[14]. Xie, J., Jiang, F., Du, J., & Zhao, J. (2022). Stock price prediction based on improved artificial fish swarm algorithm and RBF neural network. Computer Engineering and Science, 44(11), 2080–2090.
[15]. He, F., & Chen, S. (2003). Application of neural network learning algorithm based on extended Kalman filter in stock prediction. Systems Engineering, 21(6), 5.
[16]. Cui, T., & Huang, F. (2024). Stock prediction based on sentiment analysis large model: A prediction model combining GRU and ALBERT. Dongyue Forum, (2), 113–123.
[17]. Xie, X., & Li, J. (2008). Short-term stock prediction research based on neural network LAMSTAR. Computer Engineering and Science, 30(5), 150–153.
[18]. Tao, Y. (2014). Application of decision tree and neural network algorithms in stock classification prediction (Doctoral dissertation, Hangzhou Dianzi University).
Cite this article
Yin,Y. (2025). Research on Stock Price Prediction Using the BPNN Neural Network Model. Theoretical and Natural Science,136,1-8.
Data availability
The datasets used and/or analyzed during the current study will be available from the authors upon reasonable request.
Disclaimer/Publisher's Note
The statements, opinions and data contained in all publications are solely those of the individual author(s) and contributor(s) and not of EWA Publishing and/or the editor(s). EWA Publishing and/or the editor(s) disclaim responsibility for any injury to people or property resulting from any ideas, methods, instructions or products referred to in the content.
About volume
Volume title: Proceedings of CONF-APMM 2025 Symposium: Multi-Qubit Quantum Communication for Image Transmission over Error Prone Channels
© 2024 by the author(s). Licensee EWA Publishing, Oxford, UK. This article is an open access article distributed under the terms and
conditions of the Creative Commons Attribution (CC BY) license. Authors who
publish this series agree to the following terms:
1. Authors retain copyright and grant the series right of first publication with the work simultaneously licensed under a Creative Commons
Attribution License that allows others to share the work with an acknowledgment of the work's authorship and initial publication in this
series.
2. Authors are able to enter into separate, additional contractual arrangements for the non-exclusive distribution of the series's published
version of the work (e.g., post it to an institutional repository or publish it in a book), with an acknowledgment of its initial
publication in this series.
3. Authors are permitted and encouraged to post their work online (e.g., in institutional repositories or on their website) prior to and
during the submission process, as it can lead to productive exchanges, as well as earlier and greater citation of published work (See
Open access policy for details).
References
[1]. Meng, Z., & Zhu, H. (2020). Application of variable-structure temporal neural network model in stock prediction. Computer Engineering and Design, 41(6), 9.
[2]. Yan, D., & Li, B. (2022). Stock prediction based on generative adversarial neural networks. Computer Engineering and Applications, 58(13), 10.
[3]. Yuan, J., Pan, S., Xie, H., & Xu, W. (2024). Stock price prediction model S_AM_BiLSTM integrating investor sentiment. Computer Engineering and Applications, 60(7), 274–281.
[4]. Qin, Y., Zhu, H., & Li, X. (2008). Application of BP network optimized by improved particle swarm algorithm in stock prediction. Computer Engineering and Science, 30(4), 66–68.
[5]. Guo, P. (2019). Multi-day stock price prediction based on GA-BP neural network (Doctoral dissertation, Zhengzhou University).
[6]. Ai, Y. (2009). Modeling and application of particle swarm optimization neural network in stock market prediction (Doctoral dissertation, Hefei University of Technology).
[7]. Xu, M., Wang, C., Shi, H., Chen, M., & Liu, D., (2024). Stock price prediction model based on BiGRU and graph attention network with residual. Journal of Hubei University: Natural Science, 46(2), 270-281.
[8]. Liu, S., (2025). Analysis of Stock Price Prediction Methods Using LSTM Machine Learning Models. Hangzhou Dianzi University (Doctoral dissertation).
[9]. Zhang, X., & Hao, Y., (2023). Deep Learning-Based Stock Price Prediction Research, Computer Knowledge and Technology, 19(33), 8-10.
[10]. Hu, Y., (2023). Stock Price Forecasting Using Time Series Analysis and Neural Network Models, Guangdong University of Finance & Economics (Doctoral dissertation).
[11]. Luo, Y., & Zhang, G., (2025). Convolutional and Attention-Enhanced Methods for Stock Price Forecasting. Journal of Yunnan University of Nationalities(Natural Sciences Edition), 1-13.
[12]. Shi, Y., & Z, X., (2024). An Integrated Time-Varying Copula and Wavelet-SVR Framework Incorporating Investor Sentiment: Methodology and Empirical Application. Statistics & Decision. 40(16), 140-145.
[13]. Zhou, J., Liu, C., & Liu, J., (2025). Stock Price Trend Prediction Model Integrating Channel and Multi-Head Attention Mechanisms. Computer Engineering and Applications. 61(8), 324-338.
[14]. Xie, J., Jiang, F., Du, J., & Zhao, J. (2022). Stock price prediction based on improved artificial fish swarm algorithm and RBF neural network. Computer Engineering and Science, 44(11), 2080–2090.
[15]. He, F., & Chen, S. (2003). Application of neural network learning algorithm based on extended Kalman filter in stock prediction. Systems Engineering, 21(6), 5.
[16]. Cui, T., & Huang, F. (2024). Stock prediction based on sentiment analysis large model: A prediction model combining GRU and ALBERT. Dongyue Forum, (2), 113–123.
[17]. Xie, X., & Li, J. (2008). Short-term stock prediction research based on neural network LAMSTAR. Computer Engineering and Science, 30(5), 150–153.
[18]. Tao, Y. (2014). Application of decision tree and neural network algorithms in stock classification prediction (Doctoral dissertation, Hangzhou Dianzi University).