


1. Introduction
Culex tritaeniorhynchus has garnered significant attention among mosquito species due to its considerable impact on both public health and ecological systems. This mosquito species acts as a vector for several diseases, such as Japanese encephalitis, which presents serious risks to human health [1]. Moreover, Culex tritaeniorhynchus exhibits high sensitivity to meteorological variables such as temperature and precipitation, which directly influence its survival and reproductive rates [2]. Against the backdrop of accelerating global climate change, future shifts in meteorological conditions are expected to modify the species' distribution and population density. These changes may, in turn, profoundly affect human habitats, underscoring the urgency and importance of studying its future dynamics.
In recent years, species distribution models (SDMs) have emerged as a key methodology across various fields, including pest control, by addressing diverse ecological and spatial challenges [3]. SDMs are grounded in the theoretical framework of species' spatiotemporal niches within ecosystems, capturing their interactions with the environment and other species. It enables both reconstruction of current distributions and projection of future species ranges [4]. For instance, Liu et al. used SDM to demonstrate that Culex mosquitoes are currently widespread across southern, central, and coastal regions of China, with future northward expansion anticipated [5]. However, most studies on mosquito ecology have focused primarily on distributional prediction and neglected density prediction [6]. Predicting density is essential for accurately evaluating mosquito impacts on public health and ecosystems: even with range expansion, low density may mitigate harm, whereas unchanged ranges accompanied by density increases can intensify health and ecological threats.
To address this gap, the present study employs species distribution modeling integrated with future climate scenario data to simulate monthly variations in Culex tritaeniorhynchus density for the years 2030 and 2090. Beyond filling a methodological void in density prediction, this work provides a scientific basis for refining mosquito control strategies. It supports early warning systems for mosquito-borne disease risks, helps safeguard human health and ecological security, and offers insights for addressing broader issues such as biological invasions and ecological resilience under climate change.
2. Data and methods
2.1. Data sources
Data on Culex tritaeniorhynchus density in China were obtained from the study of Wang et al [7], which integrated mosquito surveillance data from the literature available up to August 2024. To enhance data volume, this dataset will be updated to July 2025 by following the same literature search, data collection, and quality control procedures as described in that study. Mosquito density values were uniformly converted to units of individuals/(lamp·hour). A total of 9 publications were included, contributing 145 data entries.
The variables of the influence factor are shown in Table 1. Historical month-by-month meteorological data were obtained from the National Oceanic and Atmospheric Administration (NOAA, https://www.noaa.gov/). Temperature, humidity, precipitation, atmospheric pressure, and wind speed were used as the main meteorological variables potentially influencing mosquito density. In order to avoid meteorological averages that reduce the impact of climatic extremes, this study included as many secondary variables as possible to characterize the strength of each meteorological factor, as shown in Table 1. Considering the potential lag effect between meteorology and mosquito density, based on previous studies, in addition to the meteorological conditions of the current month, this study coupled the meteorological conditions of the previous month and the previous two months with the mosquito density of the current month [8,9]. Where L0, L1, and L2 correspond to the current month, the previous month, and the previous two months, respectively. The density data of a particular mosquito species were used as the dependent variable, and a total of 39 meteorological secondary variables were used as independent variables. The future meteorological data were obtained from the BCC-CSM2-MR model from the National Climate Center (https://aims2.llnl.gov/search/cmip6/) for the years 2030 and 2090 [10]. Four Shared Socioeconomic Pathway (SSP) scenarios from the CMIP6 framework were selected to project a range of plausible future climates: SSP126, SSP245, SSP370, and SSP585. These scenarios correspond to low, medium, high, and very high greenhouse gas (GHG) emission trajectories, respectively [11]. The units of future and historical meteorological data were kept consistent. Considering the spatial heterogeneity of mosquito distribution, the latitude and longitude of the monitoring data of raw mosquito density were included in this study. Geographic coordinates data were collected from Amap (https://www.amap.com/), which were consistent with the study by Wang et al [7] .
|
Primary variables |
Secondary variables |
Abbreviation |
Unit |
|
Temperature |
Average air temperature |
Tavg |
℃ |
|
Average maximum temperature |
Tmax |
℃ |
|
|
Average minimum temperature |
Tmin |
℃ |
|
|
Maximum temperature extreme |
TmaxE |
℃ |
|
|
Minimum temperature extreme |
TminE |
℃ |
|
|
Humidity |
Relative humidity |
RH |
% |
|
Precipitation |
Cumulative precipitation |
P |
mm |
|
Maximum precipitation on a single day |
Pmax |
mm |
|
|
Number of days with precipitation |
Pn |
day |
|
|
Barometric Pressure |
Sea level pressure |
SLP |
hPa |
|
Wind Speed |
Average wind speed |
Wavg |
m/s |
|
Average maximum sustained wind speed |
Wsus |
m/s |
|
|
Maximum average wind speed on a single day |
Wmax |
m/s |
|
|
Geographic coordinates |
Longitude |
Lon |
° |
|
Latitude |
Lat |
° |
2.2. Random forest
This study employs the Random Forest model, an ensemble learning method capable of performing both classification and regression tasks [12]. By constructing multiple decision trees and aggregating their predictions, Random Forest enhances predictive accuracy [13] and effectively mitigates the risk of overfitting [14]. The model can handle a large number of input variables and incorporates randomness in both feature and sample selection, enabling it to capture complex nonlinear relationships and high-dimensional data structures [15].
A challenge in this study is the presence of missing values, as mosquito density monitoring is primarily concentrated in summer and autumn, leaving gaps for other months in future meteorological datasets. To address this, we innovatively leveraged the dual functionalities of the Random Forest algorithm. First, its classification capability was employed to handle missing data by determining the presence or absence of mosquito distribution based on all influencing factors. Subsequently, regression analysis was conducted between the density of Culex tritaeniorhynchus and the explanatory variables to establish density predictions in areas where the species is present.
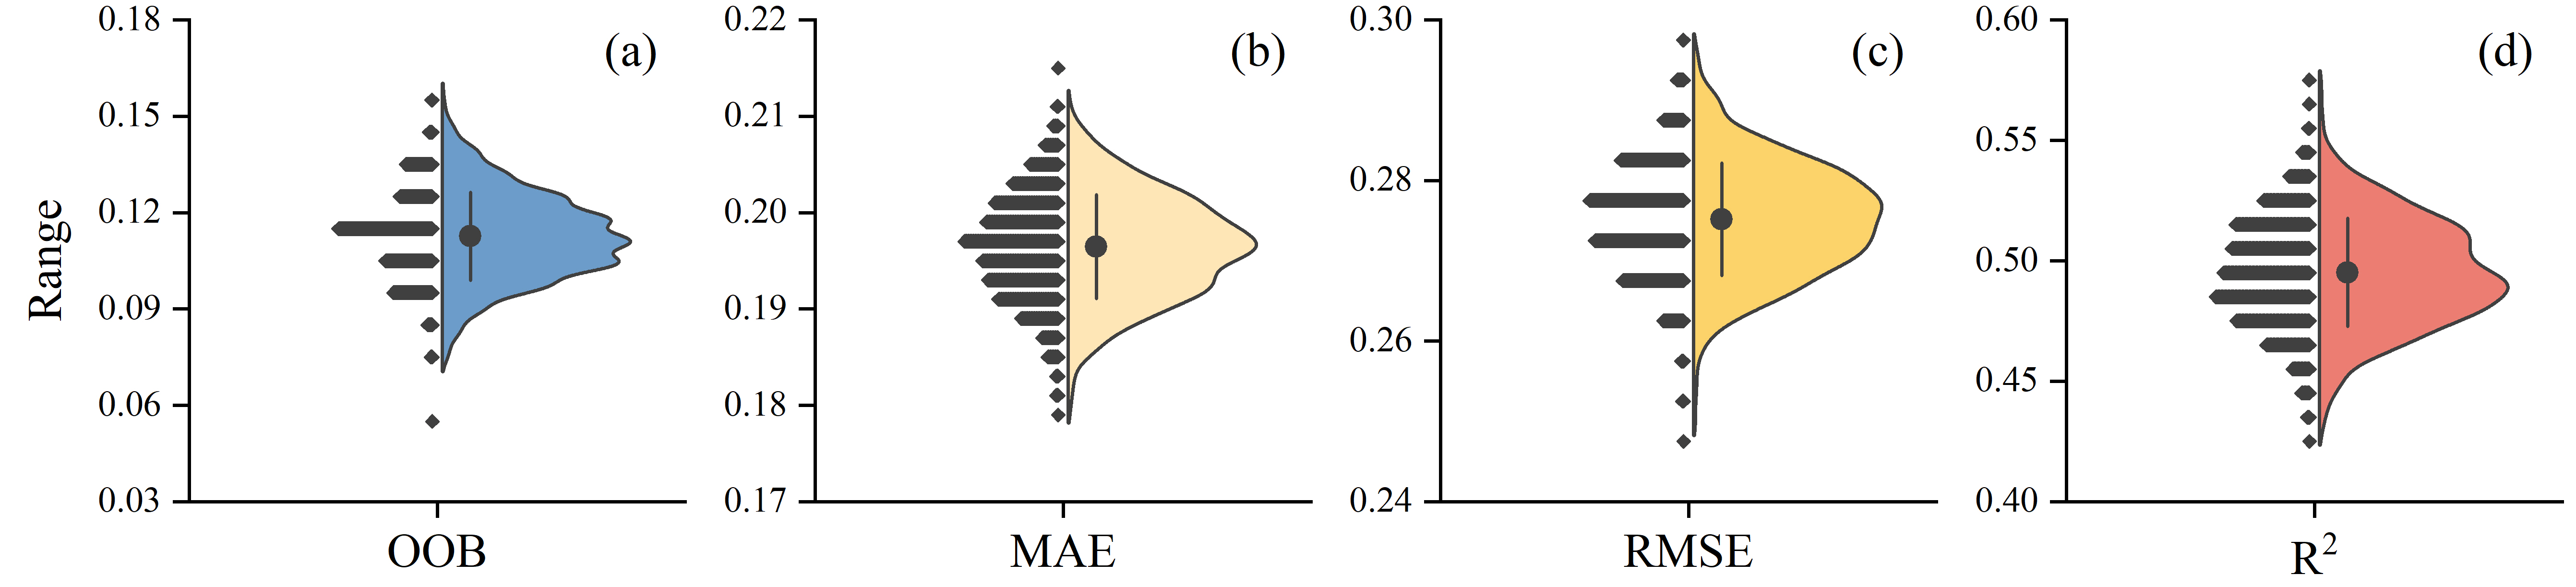
To thoroughly evaluate the model’s robustness and stability and to minimize fluctuations due to randomness in a single simulation, the experimental procedure was repeated 1000 times [16]. All model performance metrics, including Out-of-Bag (OOB) error, Mean Absolute Error (MAE), Root Mean Square Error (RMSE), and R2, were averaged and reported to reflect the generalization ability of the model.
3. Results
3.1. Modeling performance
As shown in Figure 1, the random forest model achieved an average Out-of-Bag (OOB) error of 0.86 ± 0.01, indicating high accuracy in the classification task. For the regression component, the mean absolute error (MAE) and root mean square error (RMSE) were 0.19 ± 0.01 and 0.28 ± 0.01, respectively, both of which are relatively low and suggest a close agreement between predicted and actual values. Additionally, the model yielded an average R² value of 0.49 ± 0.02, reflecting a moderate degree of fit to the data.
In order to explore the key environmental factors affecting mosquito density, a range of climatic and environmental variables were statistically analyzed in this study. Table 2 demonstrates the top ten factors with the most significant impact on mosquito density, including the mean and standard error. By analyzing the means and standard errors of these factors, the results show that the meteorological factors of the current month have a significantly higher effect on mosquito density than those of the lagging month. Temperature, barometric pressure and relative humidity were the most critical environmental factors affecting mosquito density. The analysis of temperature revealed that the mean minimum air temperature of the month had a higher effect on mosquito density than the mean air temperature of the month. This suggests that the minimum temperature is more critical than the mean temperature in constraining or facilitating mosquito population dynamics in the study area and time period.
|
Variables |
Mean |
Standard error |
|
L0_Tmin |
5.05 |
0.02 |
|
L0_Tavg |
5.02 |
0.02 |
|
L0_Tmax |
4.25 |
0.02 |
|
L0_TminE |
3.75 |
0.02 |
|
L0_SLP |
3.42 |
0.02 |
|
L1_SLP |
3.40 |
0.02 |
|
L0_RH |
2.80 |
0.03 |
|
L0_TmaxE |
2.10 |
0.02 |
|
L0_P |
1.77 |
0.03 |
3.2. Trends in the density of culex pipiens in three bands in 2030 and 2090
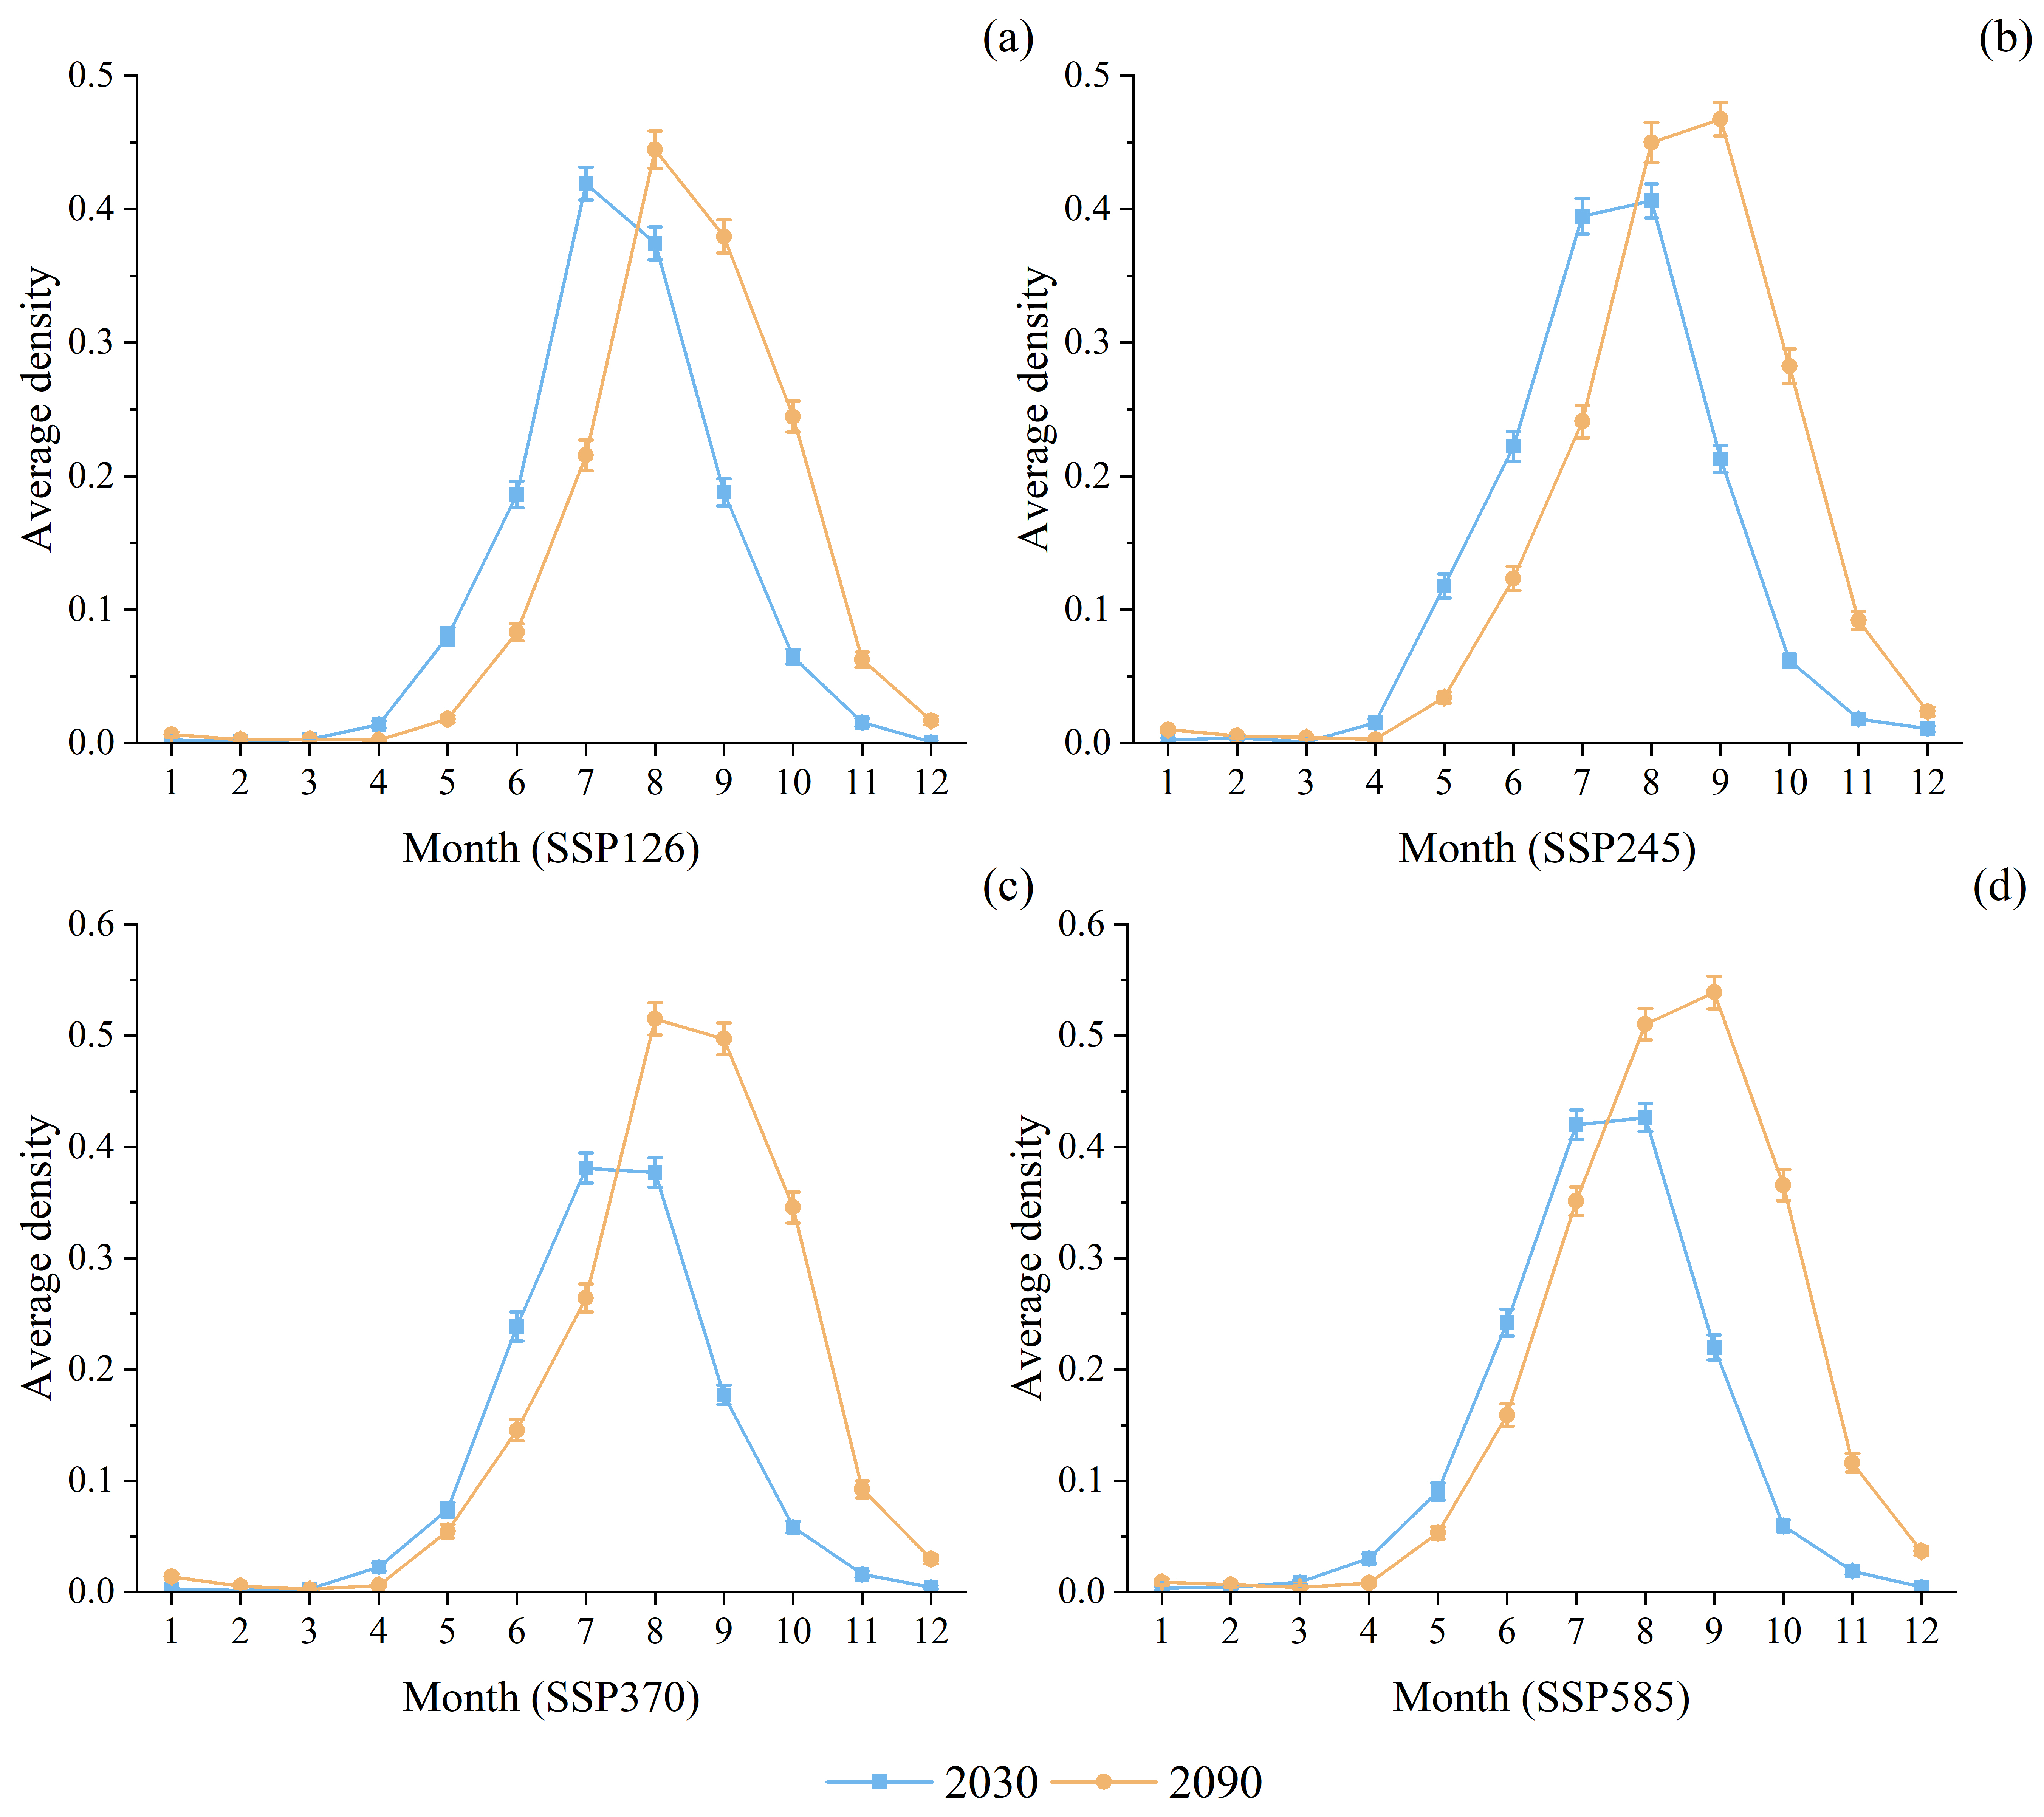
This study analyzes the month-by-month trends under four future climate scenarios. As shown in Figure 2, under climate scenario SSP126, in 2030, the density gradually increases from 0 individuals/(lamp·hour) in January to a maximum value of 0.42 individuals/(lamp·hour) in July, and then gradually decreases. In 2090, the trend of density was different, increasing from 0 individuals/(lamp·hour) in January to 0.44 individuals/(lamp·hour) in August and then decreasing. Comparison of the 2030 and 2090 data shows that there is some difference in densities around the turn of the century, with overall higher densities in some months in 2090, which may be related to factors such as climate change. The month-by-month trends under the other climate scenarios show a similar pattern of change, but with differences in specific values and peak months. For example, under climate scenario SSP245, the peak density in 2030 occurs in July, while in 2090 it occurs in August, and the peak density in 2090 is significantly higher than that in 2030. Under climate scenarios SSP370 and SSP585, the peak density in 2090 is also higher than in 2030, and the month of peak occurrence is delayed. By analyzing the month-by-month densities under the four climate scenarios, we can better understand the trends of density changes under different time and climate conditions, and provide references for related research and applications. These results suggest that the density and distribution of Culex tritaeniorhynchus will change significantly with the intensification of climate change, especially in 2090, with a significant increase in density in some months, which may trigger more serious health and ecological problems.
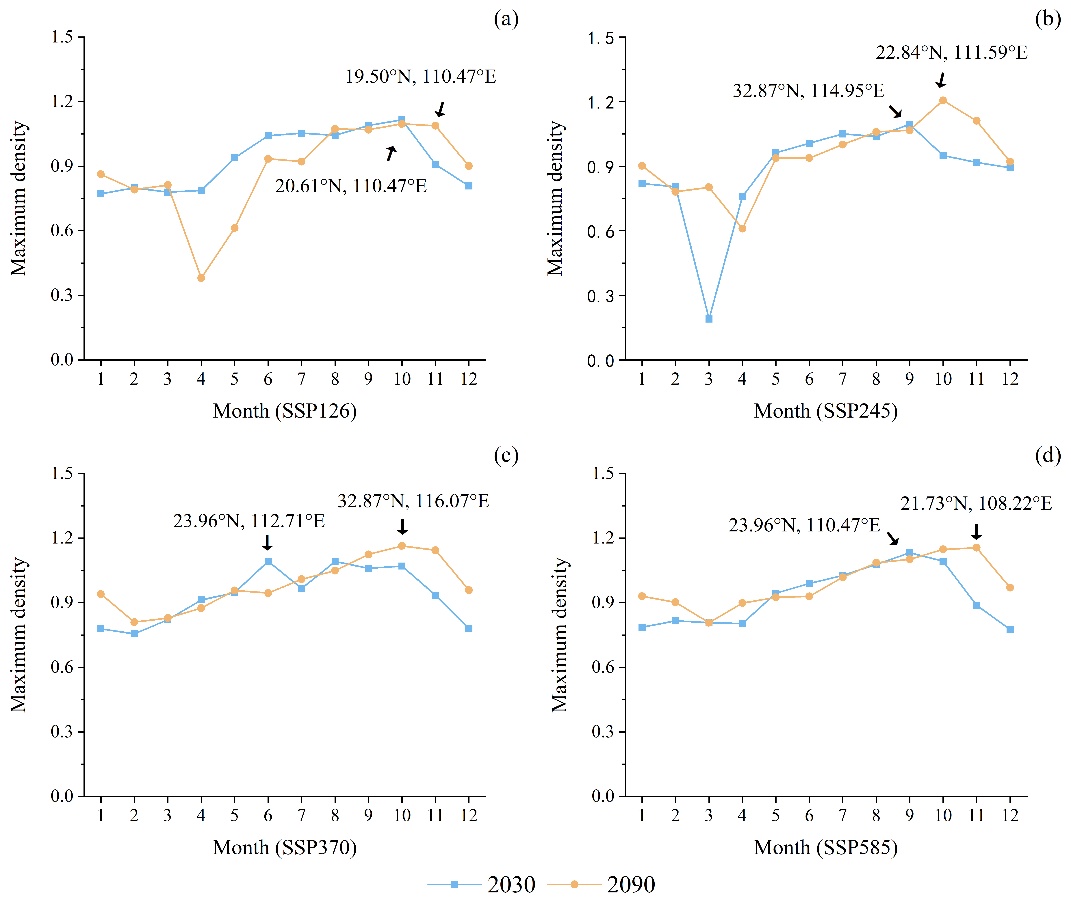
In analyzing the impact of climate change on the distribution of Culex tritaeniorhynchus, we paid special attention to the shift of the center of distribution of maximum density between 2030 and 2090 under the four climate scenarios. As shown in Figure 3, by comparing the maximum density distribution maps under different years and scenarios, this study found that under the SSP126 scenario, the distribution area of Culex tritaeniorhynchus was relatively stable without significant east-west and north-south shifts. Secondly, under the SSP245 scenario, the center of maximum density distribution shifted from 22.84° N, 111.95° E in 2030 to 32.87° N, 111.95° E in 2090, showing a significant shift towards the north. This northward shift may imply that the distribution area of Culex tritaeniorhynchus extends northward under the SSP245 scenario, which may lead to an increase in the range of people affected by Culex tritaeniorhynchus and the diseases it carries in the northern region. In SSP370 scenario, the center of distribution of maximum density shifted from 23.96° N, 112.71° E in 2030 to 32.87° N, 116.07° E in 2090, showing a shift towards north and east. This offset may indicate that under the SSP370 scenario, the distribution area of the three-banded beaked Culex mosquito not only expands to the north, but also migrates to the east, further expanding the affected geographic range. Finally, under the SSP585 scenario, the center of maximum density distribution shifted from 23.96° N, 110.47° E in 2030 to 21.73° N, 108.22° E in 2090, showing a southward and westward shift. This shift may imply that the distribution area of Culex tritaeniorhynchus migrates southward and westward under the SSP585 scenario, which may lead to an increase in the range of populations affected by Culex tritaeniorhynchus and the diseases it carries in the southern and western regions. In summary, the shifts in the center of maximum density distribution of Culex tritaeniorhynchus under different scenarios suggest that the distribution area of Culex tritaeniorhynchus may undergo significant east-west and north-south shifts with climate change, which will lead to an increase in the geographic range of the affected area, and thus an increase in the range of populations affected by Culex tritaeniorhynchus and its carrier diseases throughout China. This finding is important for the development of targeted prevention and control strategies of public health
4. Discussion
The findings of this study are highly consistent with those of other studies on the impact of climate change on the distribution of vector organisms. For example, the study by Barker et al [17] states that mosquito vector distribution models (SDM) need to consider the effects of climate change on species distribution when predicting changes in mosquito distribution. They emphasized that despite the important role of SDM in predicting mosquito distributions, its quality still needs to be improved, especially in terms of predictor variables and model evaluation. This is similar to the prediction results in this study on Culex tritaeniorhynchus, which showed significant changes in distribution range and density with climate warming. In addition, the study by Liu et al [1] also found that climate warming may increase the breeding rate and survival of mosquitoes, thus increasing the risk of disease transmission. They simulated the current and future distribution of Aedes aegypti and Aedes albopictus in mainland China using the Maxent ecological niche model, and the predicted results showed that the suitable habitats of both mosquitoes would be significantly expanded under future climate scenarios. This further supports the hypothesis of this study that climate change will have a significant impact on the distribution of Culex tritaeniorhynchus.
The present study further found that there were significant differences in the density changes of Culex tritaeniorhynchus under different climate scenarios. For example, under climate scenario SSP585, the highest peak density was observed in 2090, which may be related to the higher temperature degrees and more precipitation predicted under this scenario [11]. These conditions favor mosquito breeding and survival, leading to a significant increase in their density. This finding suggests that climate change will not only alter the distribution range of vector organisms, but will also significantly affect their population densities, thereby increasing the risk of disease transmission. In addition, it was also noted in this study that although changes in the distribution and density of Culex tritaeniorhynchus varied among different climate scenarios, the overall trend was an increase in both its range and density. This suggests that the ecological niche of Culex tritaeniorhynchus may expand further with increasing climate change, thus posing a greater threat to public health. Therefore, it is particularly important to develop effective mosquito control strategies, especially in the predicted high-risk areas.
The predicted results of this study provide new directions for future research. For example, the specific mechanisms by which different climatic elements affect the density of Culex tritaeniorhynchus could be further explored, and how species distribution models could be more effectively utilized to predict and respond to the impacts of climate change on the distribution of vector organisms. In addition, future research could also focus on the following aspects: first, microclimatic conditions (e.g., local temperature, humidity, and precipitation) have a significant impact on the survival and reproduction of vector organisms. An in-depth study on how microclimate affects the distribution and density of Culex tritaeniorhynchus can provide a strong basis for the development of more precise prevention and control strategies. Secondly, with climate change, the population dynamics and ecological niche of vector organisms may undergo significant changes. Studying these changes will help us better understand the response mechanism of vector organisms to climate change, and thus more effectively predict their future distribution trends and potential risks. Finally, a more comprehensive assessment of the impacts of climate change on the distribution of vector organisms and disease transmission requires a combination of multidisciplinary research approaches in ecology, meteorology, epidemiology and public health. This interdisciplinary research model can integrate data and theories from multiple sources to provide more scientific and systematic support for public health decision-making.
5. Conclusion
In this study, changes in the density of the three-banded beaked Culex mosquito were simulated and predicted by species distribution modeling combined with data from future climate scenarios. The results suggest that the density and distribution of Culex tritaeniorhynchus will change significantly with the intensification of climate change, especially in 2090, with a significant increase in the density in some months, which may cause more serious health and ecological problems. This finding is highly consistent with the results of other studies on the impact of climate change on the distribution of vector organisms. Therefore, it is particularly important to develop effective mosquito control strategies, especially in the predicted high-risk areas. In addition, this study provides new directions for future research, such as further exploring the specific influence mechanisms of different climatic elements on the density of Culex tritaeniorhynchus, investigating microclimate, population dynamics, and ecological niche changes, as well as carrying out interdisciplinary studies to more comprehensively assess the impacts of climate change on the distribution of vectorial organisms and the spread of diseases.
References
[1]. Liu B., Gao X., Ma J. et al., Modeling the present and future distribution of arbovirus vectors Aedes aegypti and Aedes albopictus under climate change scenarios in Mainland China, Science of The Total Environment 664 (2019) 203-214.
[2]. Liu H., Huang X., Guo X. et al., Climate change and Aedes albopictus risks in China: current impact and future projection, Infectious Diseases of Poverty 12(1) (2023) 26.
[3]. Adeleke M.A., Babalola A.S., Busari L.O. et al., Modelling species distribution of Anopheles gambiae s.l. in Osun state using random forest modeling approach, Scientific Reports 15(1) (2025) 16524.
[4]. Lippi C.A., Mundis S.J., Sippy R. et al., Trends in mosquito species distribution modeling: insights for vector surveillance and disease control, Parasites & Vectors 16(1) (2023) 302.
[5]. Liu B., Li L., Zhang Z. et al., Modeling the Potential Distribution and Future Dynamics of Important Vector Culex tritaeniorhynchus Under Climate Change Scenarios in China, Insects 16(4) (2025).
[6]. Wang G., Zhang D., Khan J. et al., Predicting the Impact of Climate Change on the Distribution of a Neglected Arboviruses Vector (Armigeres subalbatus) in China, 7(12) (2022) 431.
[7]. Wang Z., Jia X., Wang Y. et al., Spatial variation of population, density, and composition of mosquitoes in mainland China, Scientific Data 12(1) (2025) 20.
[8]. Li R., Xu L., Bjørnstad O.N. et al., Climate-driven variation in mosquito density predicts the spatiotemporal dynamics of dengue, 116(9) (2019) 3624-3629.
[9]. Ferraccioli F., Riccetti N., Fasano A. et al., Effects of climatic and environmental factors on mosquito population inferred from West Nile virus surveillance in Greece, Scientific Reports 13(1) (2023) 18803.
[10]. FAN X., MIAO C., GOU J. et al. Coupled Model Intercomparison Project and its research progress in simulation performance [J]. Progress in Geography, 2023, 42(6): 1204-1215
[11]. Contribution of Working Groups I, II and III to the Sixth Assessment Report of the Intergovernmental Panel on Climate Change [Core Writing Team, H. Lee and J. Romero (eds.)], IPCC, 2023: Climate Change 2023: Synthesis Report, IPCC, Geneva, Switzerland, pp, pp. 35-115.
[12]. Sabbaghi H., Fathianpour N., Hybrid Harris hawks-optimized random forest model for detecting multi-element geochemical anomalies related to mineralization, Scientific Reports 15(1) (2025) 23662.
[13]. Pascolini-Campbell M., Fisher J.B., Cawse-Nicholson K. et al., Assessment of spatial autocorrelation and scalability in fine-scale wildfire random forest prediction models, Scientific Reports 15(1) (2025) 21504.
[14]. Chen H., Chu N., Kang A. et al., Simulation and analysis of evapotranspiration from desert grasslands based on a random forest regression model, Scientific Reports 15(1) (2025) 25760.
[15]. Lee C., Choi E.H., Han Y. et al., Year-round daily wildfire prediction and key factor analysis using machine learning: a case study of Gangwon State, South Korea, Scientific Reports 15(1) (2025) 29910.
[16]. Tan X., Luo S., Li H. et al., A soil temperature dataset based on random forest in the Three River Source Region, Scientific Data 12(1) (2025) 882.
[17]. Barker J.R., MacIsaac H.J., Species distribution models applied to mosquitoes: Use, quality assessment, and recommendations for best practice, Ecological Modelling 472 (2022) 110073.
Cite this article
Xu,Q. (2025). Predicting the Effects of Climate Change on Culex Tritaeniorhynchus Density: A Random Forest Modeling Analysis. Theoretical and Natural Science,138,49-57.
Data availability
The datasets used and/or analyzed during the current study will be available from the authors upon reasonable request.
Disclaimer/Publisher's Note
The statements, opinions and data contained in all publications are solely those of the individual author(s) and contributor(s) and not of EWA Publishing and/or the editor(s). EWA Publishing and/or the editor(s) disclaim responsibility for any injury to people or property resulting from any ideas, methods, instructions or products referred to in the content.
About volume
Volume title: Proceedings of ICBioMed 2025 Symposium: Computational Modelling and Simulation for Biology and Medicine
© 2024 by the author(s). Licensee EWA Publishing, Oxford, UK. This article is an open access article distributed under the terms and
conditions of the Creative Commons Attribution (CC BY) license. Authors who
publish this series agree to the following terms:
1. Authors retain copyright and grant the series right of first publication with the work simultaneously licensed under a Creative Commons
Attribution License that allows others to share the work with an acknowledgment of the work's authorship and initial publication in this
series.
2. Authors are able to enter into separate, additional contractual arrangements for the non-exclusive distribution of the series's published
version of the work (e.g., post it to an institutional repository or publish it in a book), with an acknowledgment of its initial
publication in this series.
3. Authors are permitted and encouraged to post their work online (e.g., in institutional repositories or on their website) prior to and
during the submission process, as it can lead to productive exchanges, as well as earlier and greater citation of published work (See
Open access policy for details).
References
[1]. Liu B., Gao X., Ma J. et al., Modeling the present and future distribution of arbovirus vectors Aedes aegypti and Aedes albopictus under climate change scenarios in Mainland China, Science of The Total Environment 664 (2019) 203-214.
[2]. Liu H., Huang X., Guo X. et al., Climate change and Aedes albopictus risks in China: current impact and future projection, Infectious Diseases of Poverty 12(1) (2023) 26.
[3]. Adeleke M.A., Babalola A.S., Busari L.O. et al., Modelling species distribution of Anopheles gambiae s.l. in Osun state using random forest modeling approach, Scientific Reports 15(1) (2025) 16524.
[4]. Lippi C.A., Mundis S.J., Sippy R. et al., Trends in mosquito species distribution modeling: insights for vector surveillance and disease control, Parasites & Vectors 16(1) (2023) 302.
[5]. Liu B., Li L., Zhang Z. et al., Modeling the Potential Distribution and Future Dynamics of Important Vector Culex tritaeniorhynchus Under Climate Change Scenarios in China, Insects 16(4) (2025).
[6]. Wang G., Zhang D., Khan J. et al., Predicting the Impact of Climate Change on the Distribution of a Neglected Arboviruses Vector (Armigeres subalbatus) in China, 7(12) (2022) 431.
[7]. Wang Z., Jia X., Wang Y. et al., Spatial variation of population, density, and composition of mosquitoes in mainland China, Scientific Data 12(1) (2025) 20.
[8]. Li R., Xu L., Bjørnstad O.N. et al., Climate-driven variation in mosquito density predicts the spatiotemporal dynamics of dengue, 116(9) (2019) 3624-3629.
[9]. Ferraccioli F., Riccetti N., Fasano A. et al., Effects of climatic and environmental factors on mosquito population inferred from West Nile virus surveillance in Greece, Scientific Reports 13(1) (2023) 18803.
[10]. FAN X., MIAO C., GOU J. et al. Coupled Model Intercomparison Project and its research progress in simulation performance [J]. Progress in Geography, 2023, 42(6): 1204-1215
[11]. Contribution of Working Groups I, II and III to the Sixth Assessment Report of the Intergovernmental Panel on Climate Change [Core Writing Team, H. Lee and J. Romero (eds.)], IPCC, 2023: Climate Change 2023: Synthesis Report, IPCC, Geneva, Switzerland, pp, pp. 35-115.
[12]. Sabbaghi H., Fathianpour N., Hybrid Harris hawks-optimized random forest model for detecting multi-element geochemical anomalies related to mineralization, Scientific Reports 15(1) (2025) 23662.
[13]. Pascolini-Campbell M., Fisher J.B., Cawse-Nicholson K. et al., Assessment of spatial autocorrelation and scalability in fine-scale wildfire random forest prediction models, Scientific Reports 15(1) (2025) 21504.
[14]. Chen H., Chu N., Kang A. et al., Simulation and analysis of evapotranspiration from desert grasslands based on a random forest regression model, Scientific Reports 15(1) (2025) 25760.
[15]. Lee C., Choi E.H., Han Y. et al., Year-round daily wildfire prediction and key factor analysis using machine learning: a case study of Gangwon State, South Korea, Scientific Reports 15(1) (2025) 29910.
[16]. Tan X., Luo S., Li H. et al., A soil temperature dataset based on random forest in the Three River Source Region, Scientific Data 12(1) (2025) 882.
[17]. Barker J.R., MacIsaac H.J., Species distribution models applied to mosquitoes: Use, quality assessment, and recommendations for best practice, Ecological Modelling 472 (2022) 110073.