


1. Introduction
The human brain undergoes profound changes during adolescence, characterized by complex structural and functional development patterns. These neurodevelopmental processes are crucial for developing and refining cognitive abilities [1,2]. However, understanding what constitutes “typical” brain development and identifying meaningful deviations from developmental norms remains a significant challenge in neuroscience.
Traditional approaches to studying brain development often rely on group-level analyses or case-control comparisons, which may not capture the full spectrum of individual variation in neurodevelopment. Recent advances in neuroimaging and computational methods have enabled more sophisticated approaches to characterizing brain development. Among these, normative modeling has emerged as a promising framework for quantifying individual differences in brain structure and function relative to population norms, analogous to growth charts used in pediatrics [3,4].
Multiple neuroimaging modalities provide complementary insights into brain development. Structural MRI reveals changes in brain volume and morphology, diffusion MRI captures white matter microstructure development, and functional MRI illuminates the coordination of brain networks. Each measure may develop along distinct trajectories and contribute differently to cognitive abilities. Understanding how deviations from typical developmental trajectories across these different brain measures relate to cognitive functioning could provide crucial insights into neurodevelopmental processes and their behavioral outcomes [5].
In this study, I applied normative modeling to a large dataset of adolescent brain imaging, the Adolescent Brain Cognitive Development (ABCD) study [6,7], to address three key questions: (1) What are the typical developmental trajectories of different brain measures during adolescence? (2) How do individual deviations from these trajectories relate to cognitive abilities, especially intelligence and learning capacity? (3) Which aspects of brain development are most predictive of cognitive functioning? I employed multiple neuroimaging modalities to comprehensively characterize brain development and used machine learning approaches to link developmental deviations to cognitive outcomes.
2. Materials
1. Jupyter Notebook
2. Publicly available data from the ABCD Study, including MRI and phenotypic data [1]. Further details on the dataset can be found in the Method section.
3. Python packages: os, pandas, PCNtoolkit, numpy, pickle, matplotlib (pyplot)
3. Method
3.1. Subjects and materials
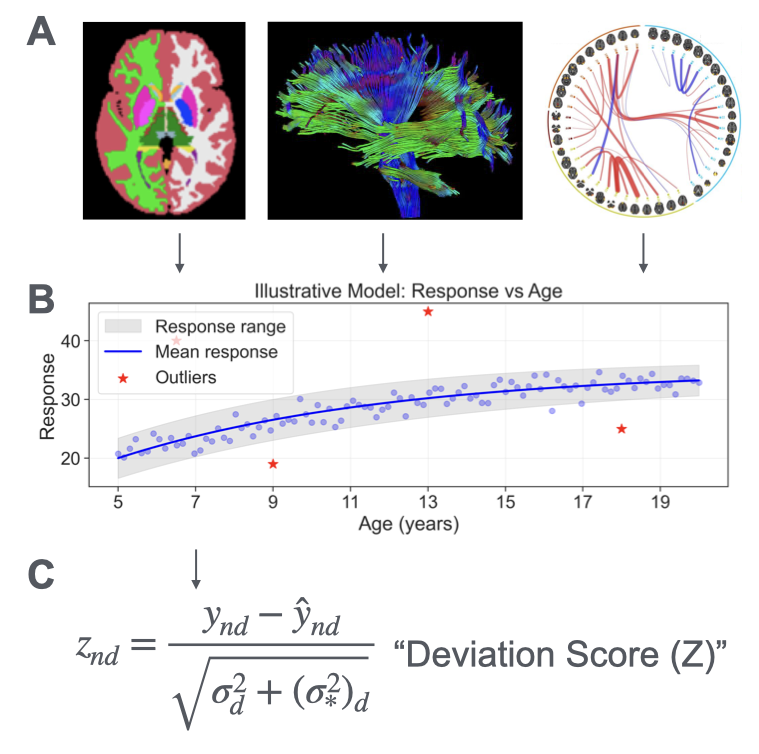
I analyzed data from the Adolescent Brain Cognitive Development (ABCD) dataset, Release 5.0 [1], to investigate atypical brain development. The dataset comprises MRI scans of 10,657 unique participants aged 9-15 years (107 to 188 months) and diverse phenotypic scores. To characterize brain development comprehensively, I used various measures of brain structure and function from three MRI modalities: surface area, surface depth, and subcortical volume from T1-weighted MRI; white matter microstructure (mean-diffusivity and fractional anisotropy) from diffusion MRI; functional connectivity patterns from resting-state fMRI. This included 605 brain measures in total, which were subsequently fed into the normative modeling framework (Figure 1A). To validate the model’s clinical relevance, I examined its relationship with two cognitive measurements: fluid intelligence, assessed using the WISC-V Matrix Reasoning Test [8,9], and learning ability, assessed by the Pearson Rey Auditory Verbal Learning Test [10,11].
3.2. Normative modeling and deviation scores
The normative model can be formally described as:
where
I used a Hierarchical Bayesian Regression framework to model the nonlinear trajectories of brain development for each neuroimaging measure. This approach allows me to model both population-level trends and individual variability while accounting for the hierarchical structure of the data and parameter uncertainty. After fitting the normative models, I calculated deviation Z-scores for each individual per measure (Figure 1C). These Z-scores quantify how much each individual’s brain measures deviate from age-matched population norms. By convention, Z-scores beyond±2 were considered significant departures from typical development. The analysis was conducted using the Predictive Clinical Neuroscience Toolkit [12]. The data were split into three folds, with the model trained on two-thirds of the data and tested on the remaining third, rotating through all possible combinations. This cross-validation approach helps validate the generalizability of my normative models and prevents overfitting.
3.3. Validation of deviation scores
To further link the brain measures to cognitive phenotypes and validate the clinical relevance of their deviation scores, I assessed the predictive power of these deviation scores in predicting cognitive measures, specifically fluid intelligence and learning ability. I used ElasticNet [13], a technique that combines L1 and L2 penalties. ElasticNet is particularly suitable for this analysis because it: 1) handles correlated predictors effectively, which is common in neuroimaging data where different brain measures may be correlated; 2) helps prevent overfitting through regularization. Specifically, by letting
The hyperparameters
3.4. Specific processes
Normative modeling: Because the ABCD procedure calls for annual or biannual assessments, many subjects were the same individual at different ages. Before the Bayesian Regression, I split the data into training and testing data so that the repeated IDs were guaranteed to be in either the training or testing data to prevent misrepresented errors.
4. Results
4.1. Normative curves of brain measures
My normative modeling approach revealed distinct developmental trajectories across different brain measures. The model captured both linear and non-linear age-related patterns while accounting for population variability.
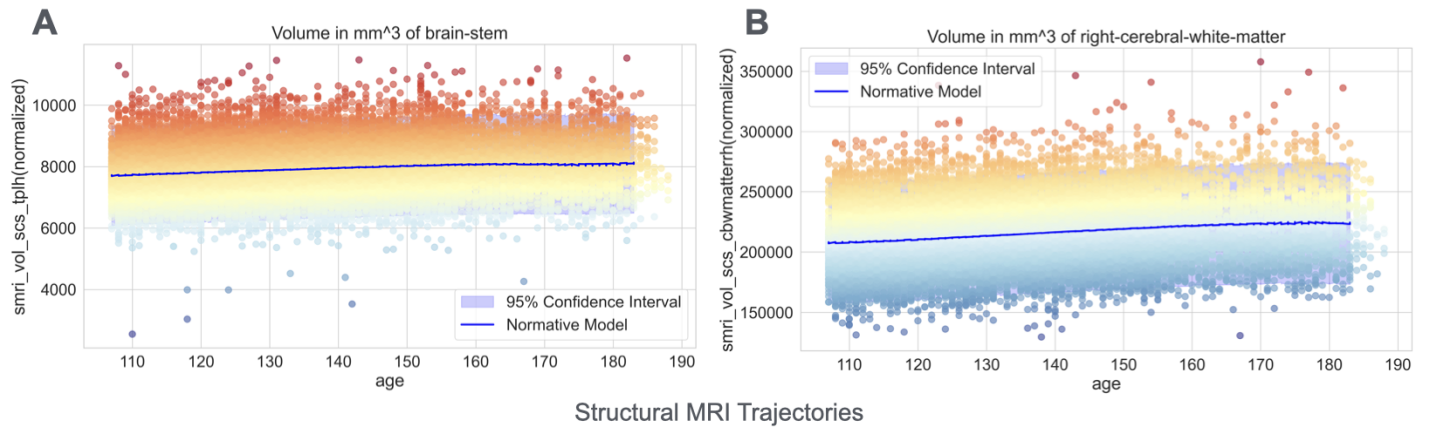
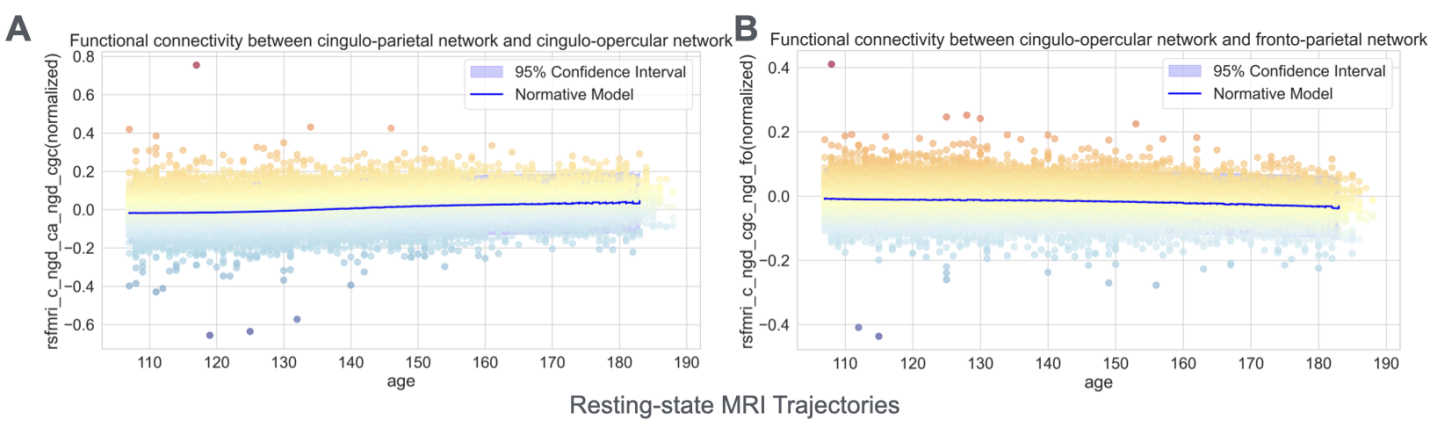
Most brain volume measures overall showed steady increases throughout early adolescence (Figures 2A and 2B), reflecting ongoing structural maturation. More complex developmental patterns emerged in functional connectivity measures derived from resting-state fMRI. Specifically, functional connectivity measures quantify the temporal synchronization of activity between different brain networks, providing insights into how brain networks communicate. These measures exhibited asynchronous developmental trajectories through the brain. For example, the functional connectivity between the cingulo-opercular network and the fronto-parietal network – systems critical for cognitive control and attention – increased with age, suggesting enhanced integration of executive function networks (Figure 3A). In contrast, connectivity between cingulo-opercular and cingulo-parietal networks weakened, potentially reflecting network segregation and specialization (Figure 3B). These divergent patterns align with modern theories of brain development that propose simultaneous integration within cognitive networks and segregation between different functional systems during adolescence [14,15,16]..
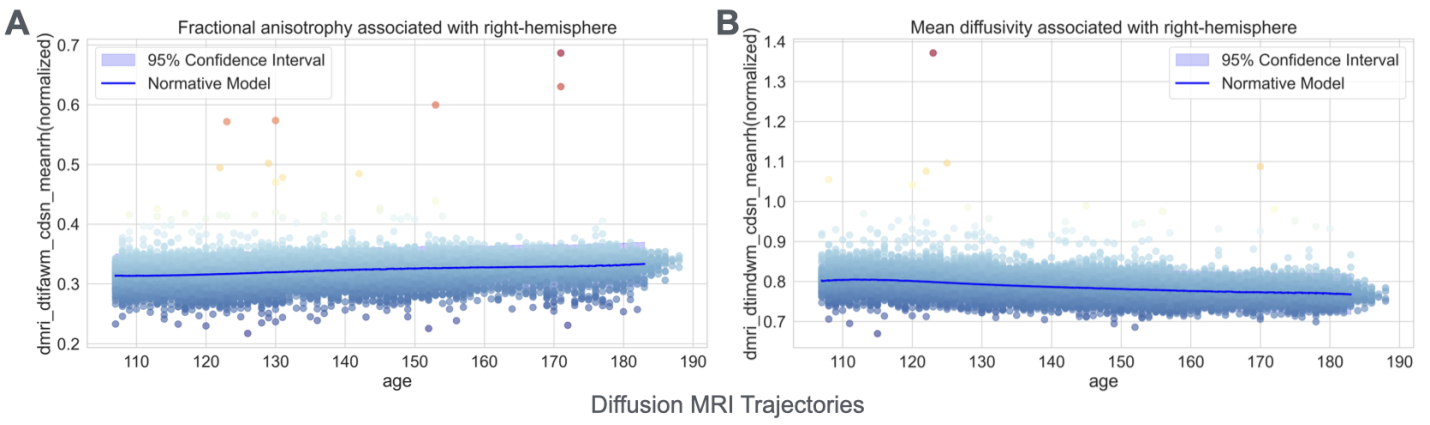
White matter microstructure, assessed through diffusion MRI, also revealed systematic developmental changes that suggest ongoing myelination and axonal organization. Specifically, fractional anisotropy – a measure of the directional dependence of water diffusion that increases with fiber organization and myelination – showed age-related increases (Figure 4A). In contrast, mean diffusivity, which quantifies the overall magnitude of water diffusion and typically decreases with cellular density and myelination, showed systematic decreases across white matter tracts (Figure 4B). These complementary patterns are consistent with continued white matter maturation during adolescence, likely reflecting increased myelin content and more organized axonal packing [17].
4.2. Prediction of intelligence and learning abilities from brain development deviations
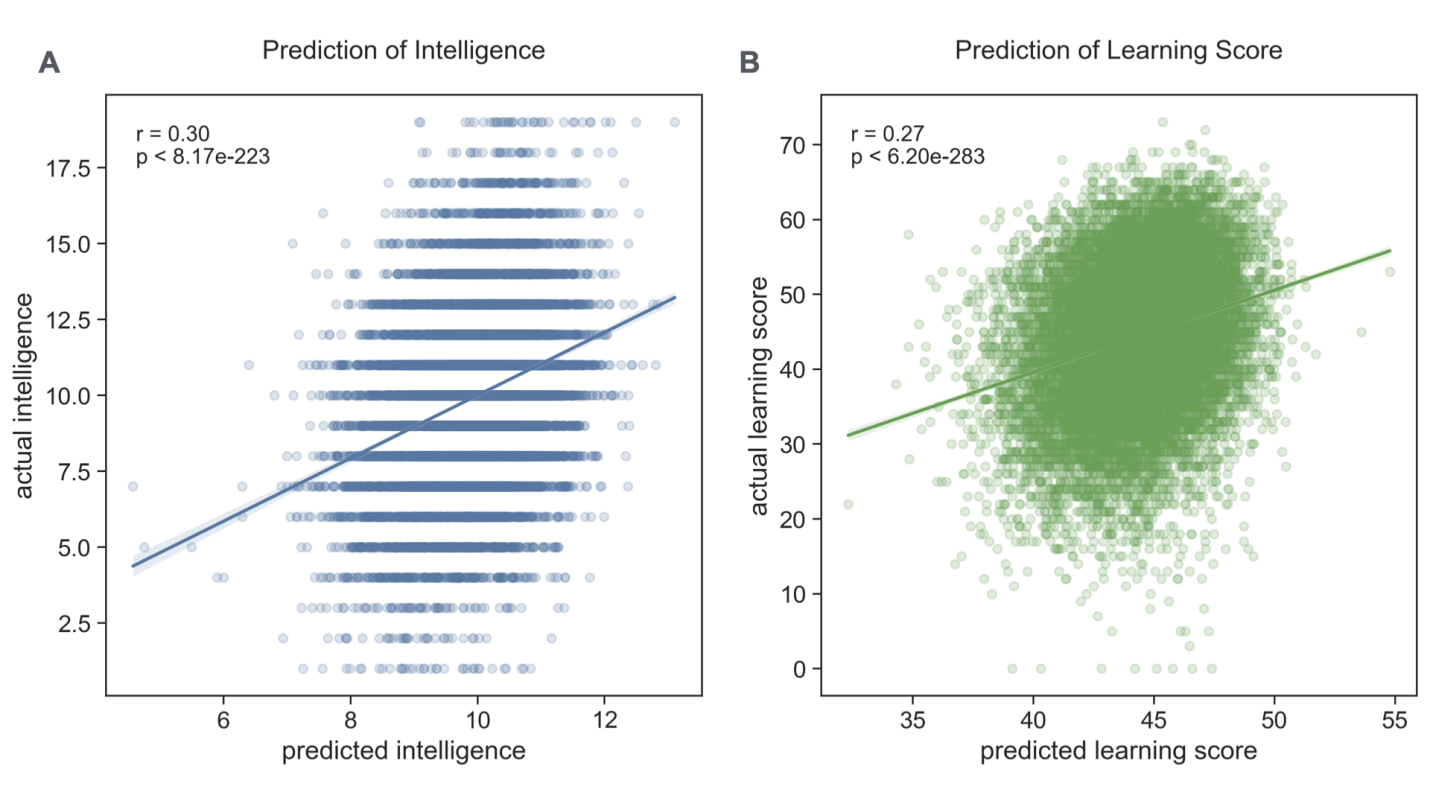
To investigate the relationship between atypical brain development and cognitive functioning, I used the deviation scores from my normative models to predict individual differences in intelligence and learning ability. Using an advanced machine learning technique, ElasticNet, which optimally combines features while handling multicollinearity inherent in neuroimaging data, I achieved significant predictive accuracy for both cognitive measures (Figure 5). The model predicted intelligence scores with a correlation of r=0.30 (p<0.0001) between predicted and actual scores, and learning ability with a correlation of r = 0.27 (p < 0.0001). These correlations, while moderate in magnitude, are highly significant given the large sample size and are consistent with the expected multifactorial nature of cognitive abilities.
The predictive accuracy suggests that deviations from typical brain development explain approximately 9% of the variance in intelligence scores and 7% of the variance in learning ability. These effect sizes are meaningful in the context of cognitive neuroscience, where brain-behavior relationships are typically complex and influenced by multiple factors, including genetics, environment, and measurement noise. Moreover, the similar magnitude of prediction accuracy for both cognitive measures suggests that deviations from normative brain development may have broadly comparable impacts across different cognitive domains.
Importantly, these predictions were achieved using cross-validation, demonstrating the generalizability of my findings to unseen data and suggesting robust relationships between brain development patterns and cognitive functioning. The successful prediction of cognitive abilities from deviation scores corroborates the utility of normative modeling in capturing neurodevelopmentally relevant individual differences.
4.3. Deviation scores outperformed the original brain measures in predicting intelligence and learning ability
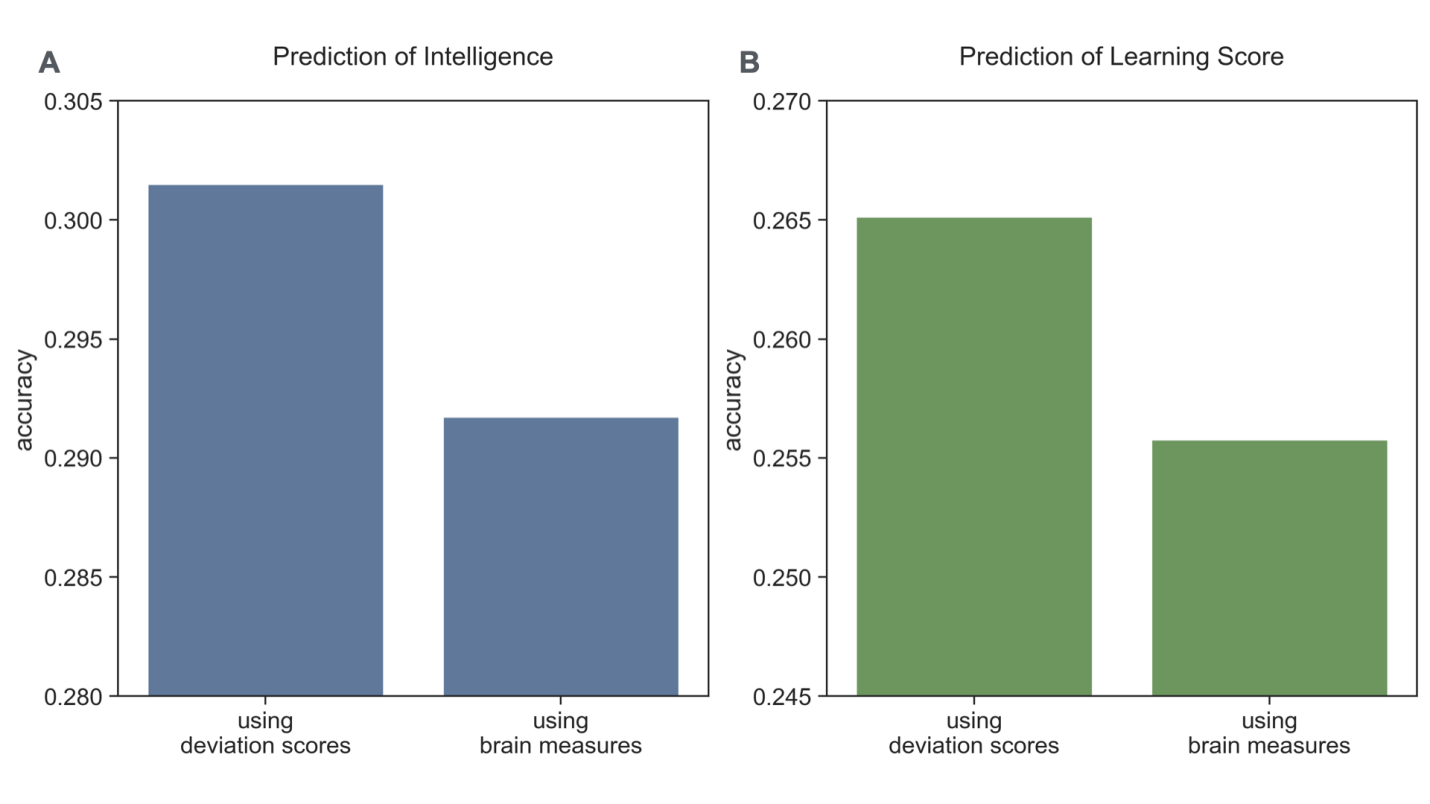
To further evaluate the utility of the normative modeling approach, I compared the predictive power of deviation scores against that of the original brain measures. Using the same ElasticNet technique and cross-validation procedures, deviation scores achieved higher prediction accuracy than the original brain measures (Figure 6). This enhanced predictive power suggests that quantifying how an individual deviates from age-expected norms provides more informative features for predicting cognitive abilities than raw brain measures alone.
The superior performance of deviation scores can be attributed to several factors. First, deviation scores inherently account for age-related variations in brain structure and function, effectively normalizing developmental differences across the adolescent sample. Second, these scores capture not just the absolute values of brain measures but their relationship to age-appropriate expectations, providing a more nuanced characterization of brain development. Third, by expressing brain measures in terms of their deviation from population norms, I may better capture individually meaningful variations that are most relevant to cognitive functioning.
4.4. Regional contributions to cognitive prediction
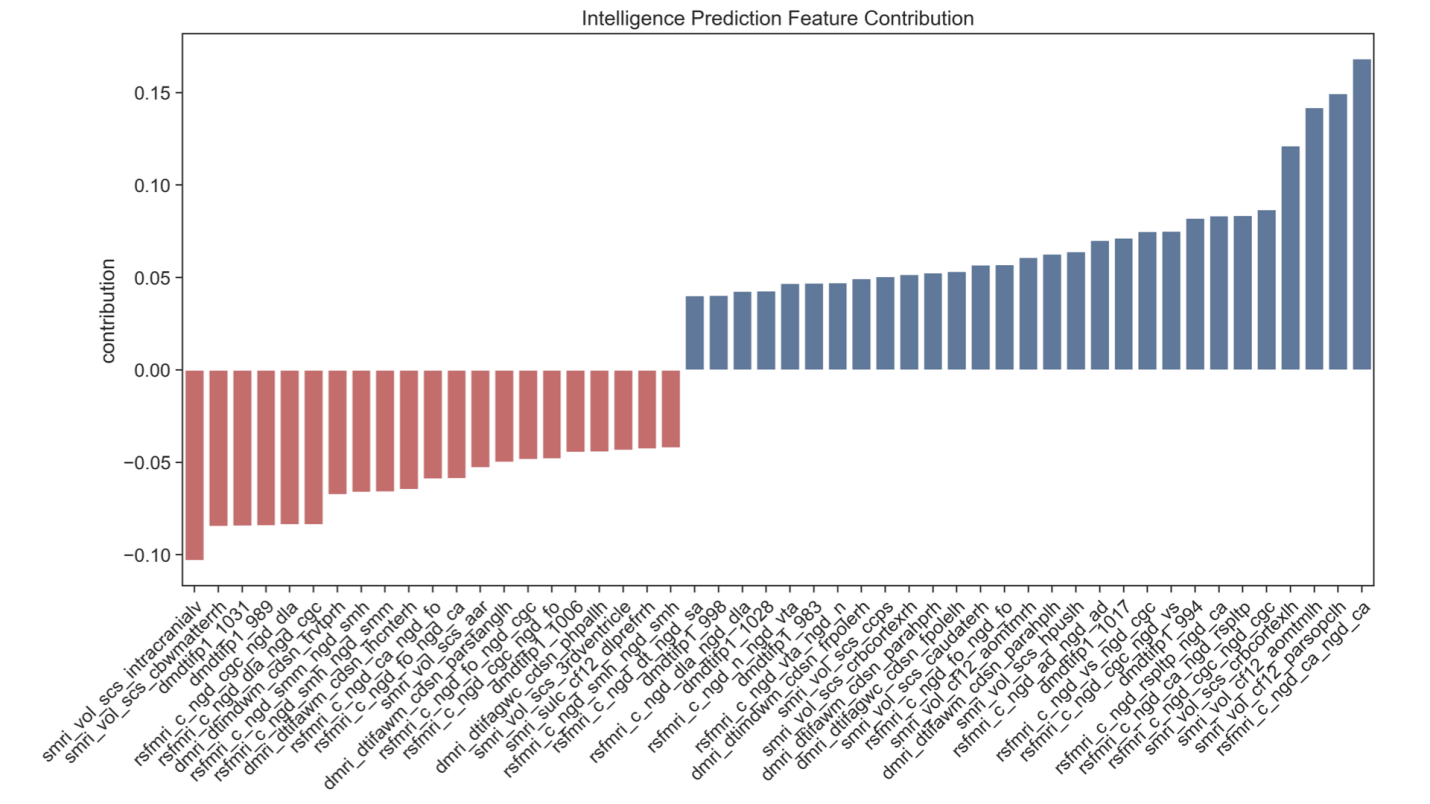
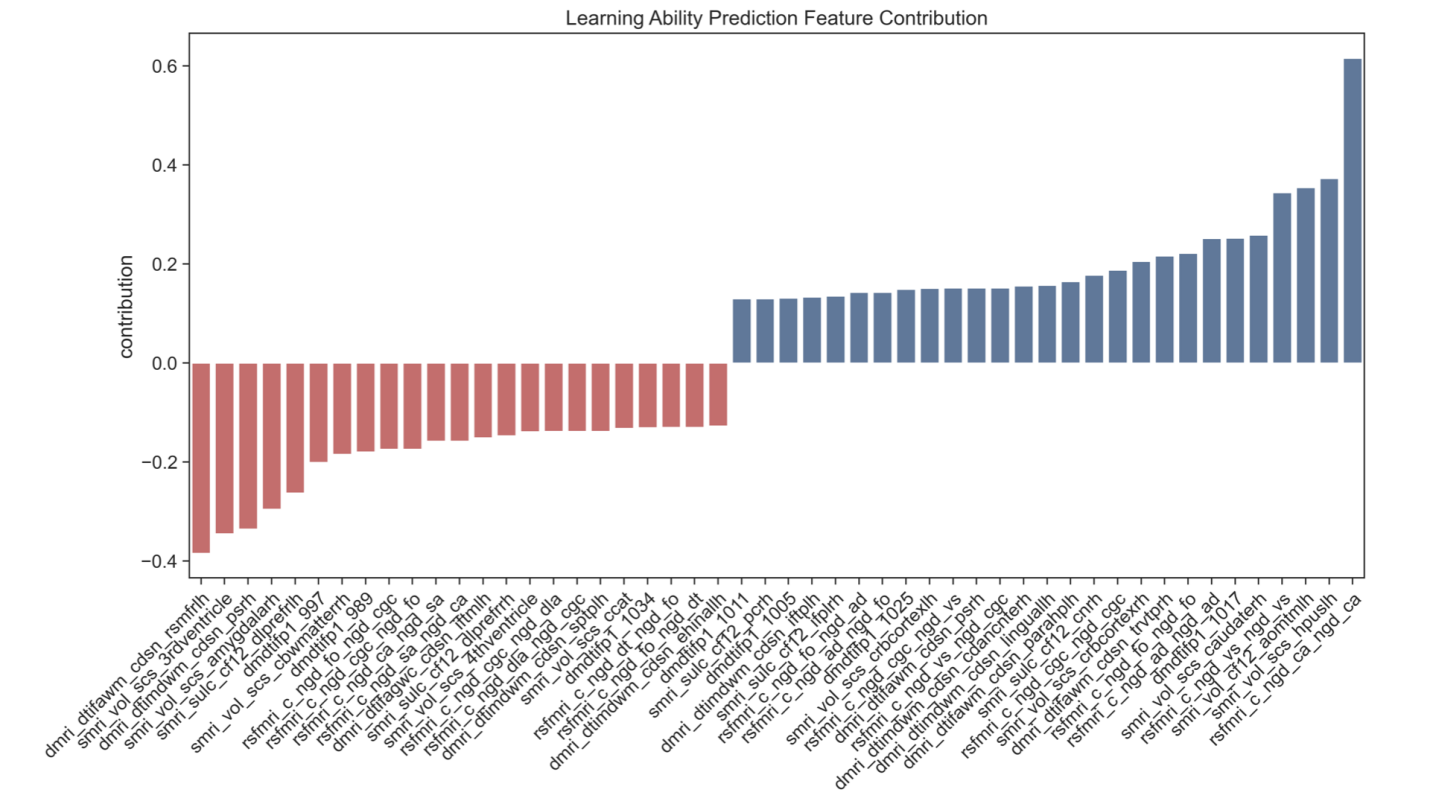
Analysis of ElasticNet coefficients revealed that multiple brain features contributed to cognitive prediction, with substantial overlap between predictors of intelligence and learning ability. Brain volume deviations, particularly in regions crucial for memory and higher-order cognition, such as the anteromedial temporal lobe and hippocampus, emerged as important predictors. These findings align with established literature linking hippocampal structure to both learning and intelligence, given its fundamental role in memory consolidation and information processing.
Functional connectivity deviations also provided strong predictive power, especially the connections between the cingulo-parietal network and retrosplenial temporal network, as well as between visual and cingulo-opercular networks. The involvement of these networks suggests that both cognitive abilities rely on the integration of multiple brain systems: the cingulo-parietal network for attention and cognitive control, the retrosplenial temporal network for memory and spatial cognition, and the cingulo-opercular network for sustained task control and learning.
White matter microstructure, particularly fractional anisotropy in sub-adjacent white matter associated with parahippocampal regions, also contributed significantly to prediction. This highlights the importance of structural connectivity in supporting cognitive function, potentially by facilitating efficient communication between key brain regions.
The overlap in predictive features between intelligence and learning ability suggests these cognitive functions may rely on shared neural substrates. This finding supports theories proposing that learning ability and intelligence share common biological underpinnings, particularly in brain circuits involved in memory, attention, and information processing [18,19].
5. Discussion
In this study, I employed normative modeling to characterize typical brain development patterns and their relationship to cognitive abilities in a large adolescent sample. My analysis revealed several key findings. First, I observed distinct developmental trajectories across different brain measures: while brain volumes showed steady increases, functional connectivity displayed more complex, network-specific patterns of integration and segregation. White matter microstructure exhibited systematic changes consistent with ongoing myelination, with increasing fractional anisotropy and decreasing mean diffusivity across development.
Second, I demonstrated that deviations from these normative trajectories significantly predicted individual differences in both intelligence and learning ability. The moderate but highly significant prediction accuracies are particularly noteworthy given the complex, multifactorial nature of cognitive abilities. Importantly, these deviation-based predictions outperformed predictions based on raw brain measures, highlighting the value of normative modeling in capturing developmentally relevant individual differences.
Third, my analysis revealed that multiple brain features contributed to cognitive prediction, including volumetric measures of memory-related structures, functional connectivity between attention and cognitive control networks, and white matter microstructure in temporal regions. The overlap in predictive features between intelligence and learning ability suggests these cognitive functions may rely on shared neural substrates, particularly in circuits supporting memory, attention, and information processing.
These findings have several important implications. From a methodological perspective, my results validate normative modeling as a powerful approach for studying individual differences in brain development. The superior performance of deviation scores over raw brain measures suggests that accounting for age-appropriate expectations is crucial to investigating brain-behavior relationships in developmental populations. From a theoretical perspective, my findings support models of adolescent brain development that emphasize the importance of both structural maturation and functional network reorganization in supporting cognitive development.
The observation that deviations across multiple brain systems contribute to cognitive abilities highlights the distributed nature of neural substrates that support intelligence and learning. The involvement of memory-related structures and their connections aligns with theories proposing that efficient information processing and integration across brain networks underlie general cognitive ability.
Several limitations exist in the current study. First, although significant, the predictive accuracies for intelligence and learning ability are moderate. These accuracies need improvement before such models can be considered for clinical applications or individual-level prediction. Future work could enhance predictive power through several approaches: (1) incorporating additional brain measures, such as more detailed connectivity metrics or dynamic functional connectivity patterns; (2) including genetic information and environmental factors, which likely interact with brain development to influence cognitive outcomes.
A second important limitation is that my current normative modeling approach treats each brain measure independently, potentially missing meaningful interactions between different modalities. Brain development involves coordinated changes across structural, functional, and microstructural properties, and these relationships are informative for understanding cognitive development. Future studies should develop multivariate normative models that can capture cross-modal relationships and their developmental trajectories. Such approaches may reveal how deviations in one aspect of brain development relate to or potentially compensate for deviations in others, providing a more comprehensive understanding of brain-behavior relationships.
6. Conclusion
Brain development in adolescents is the transition period between the brain of a child and that of an adult, when fine-tuning occurs. With evolving algorithmic techniques and expanding databases, neuroscience research can become increasingly individualized and representative of brain growth. In this paper, I applied normative modeling to evaluate the development of adolescent brains. This study provides doctors and researchers with a method to assess the development of children’s brains, with the potential capability of detecting abnormal growth. Furthermore, by linking brain measures with cognitive scores, MRI scans may provide a more reliable metric for quantifying intelligence that disregards environmental disruptions (e.g., hours of sleep or noise of testing environment). Overall, my results emphasize the value of the methodology as a tool for neuroscience research.
References
[1]. Casey, B. J., Tottenham, N., Liston, C., & Durston, S. (2005). Imaging the developing brain: what have I learned about cognitive development? Trends in Cognitive Sciences, 9(3), 104–110. https: //doi.org/10.1016/j.tics.2005.01.011ABCD Study. (n.d.). ABCD Study. https: //abcdstudy.org/
[2]. Blakemore, S.-J., & Choudhury, S. (2006). Development of the adolescent brain: Implications for executive function and social cognition. Journal of Child Psychology and Psychiatry, 47(3-4), 296–312. https: //doi.org/10.1111/j.1469-7610.2006.01611.x
[3]. Marquand, A. F., Rezek, I., Buitelaar, J., & Beckmann, C. F. (2016). Understanding Heterogeneity in Clinical Cohorts Using Normative Models: Beyond Case-Control Studies. Biological Psychiatry, 80(7), 552–561. https: //doi.org/10.1016/j.biopsych.2015.12.023
[4]. Rutherford, S., Barkema, P., Tso, I. F., Sripada, C., Beckmann, C. F., Ruhe, H. G., & Marquand, A. F. (2023). Evidence for embracing normative modeling. ELife, 12. https: //doi.org/10.7554/elife.85082
[5]. Shaw, P., Greenstein, D., Lerch, J., Clasen, L., Lenroot, R., Gogtay, N., Evans, A., Rapoport, J., & Giedd, J. (2006). Intellectual ability and cortical development in children and adolescents. Nature, 440(7084), 676–679. https: //doi.org/10.1038/nature04513
[6]. Casey, B. J., Cannonier, T., Conley, M. I., Cohen, A. O., Barch, D. M., Heitzeg, M. M., Soules, M. E., Teslovich, T., Dellarco, D. V., Garavan, H., Orr, C. A., Wager, T. D., Banich, M. T., Speer, N. K., Sutherland, M. T., Riedel, M. C., Dick, A. S., Bjork, J. M., Thomas, K. M., & Chaarani, B. (2018). The Adolescent Brain Cognitive Development (ABCD) study: Imaging acquisition across 21 sites. Developmental Cognitive Neuroscience, 32, 43–54. https: //doi.org/10.1016/j.dcn.2018.03.001
[7]. Hagler, D. J., Hatton, SeanN., Cornejo, M. D., Makowski, C., Fair, D. A., Dick, A. S., Sutherland, M. T., Casey, B. J., Barch, D. M., Harms, M. P., Watts, R., Bjork, J. M., Garavan, H. P., Hilmer, L., Pung, C. J., Sicat, C. S., Kuperman, J., Bartsch, H., Xue, F., & Heitzeg, M. M. (2019). Image processing and analysis methods for the Adolescent Brain Cognitive Development Study. NeuroImage, 202, 116091. https: //doi.org/10.1016/j.neuroimage.2019.116091
[8]. Wechsler, D. (2014). Wechsler Intelligence Scale for Children - Fifth Edition Manual. San Antonio, TX, Pearson.
[9]. Daniel, M.H., Wahlstrom, D. & Zhang, O. (2014) Equivalence of Q-interactive® and Paper Administrations of Cognitive Tasks: WISC®–V: Q-Interactive Technical Report
[10]. Strauss, E., Sherman, E.M.S., & Spreen, O. (2006) A compendium of neuropsychological tests. Oxford University Press. New York, New York. Third Edition.
[11]. Lezak, M.D., Howieson, D.B., Bigler, E.D., & Tranel, D. (2012) Neuropsychological assessment. 5th Edition. Oxford University Press. New York, NY.
[12]. Marquand, A. F. (2020). Predictive Clinical Neuroscience toolkit — Predictive Clinical Neuroscience Toolkit 0.20 documentation. Readthedocs.io. https: //pcntoolkit.readthedocs.io/
[13]. Doss, H., Witten, D., & Yao, Q. (2024, November 31). Journal of the Royal Statistical Society Series B: Statistical Methodology. OUP Academic. https: //academic.oup.com/jrsssb
[14]. Fair, D. A., Dosenbach, N. U. F., Church, J. A., Cohen, A. L., Brahmbhatt, S., Miezin, F. M., Barch, D. M., Raichle, M. E., Petersen, S. E., & Schlaggar, B. L. (2007). Development of distinct control networks through segregation and integration. Proceedings of the National Academy of Sciences, 104(33), 13507–13512. https: //doi.org/10.1073/pnas.0705843104
[15]. Grayson, D. S., & Fair, D. A. (2017). Development of large-scale functional networks from birth to adulthood: A guide to the neuroimaging literature. NeuroImage, 160, 15–31. https: //doi.org/10.1016/j.neuroimage.2017.01.079
[16]. Baum, G. L., Cui, Z., Roalf, D. R., Ciric, R., Betzel, R. F., Larsen, B., Cieslak, M., Cook, P. A., Xia, C. H., Moore, T. M., Ruparel, K., Oathes, D. J., Alexander-Bloch, A. F., Shinohara, R. T., Raznahan, A., Gur, R. E., Gur, R. C., Bassett, D. S., & Satterthwaite, T. D. (2020). Development of structure–function coupling in human brain networks during youth. Proceedings of the National Academy of Sciences, 117(1), 771–778. https: //doi.org/10.1073/pnas.1912034117
[17]. Lebel, C., Walker, L., Leemans, A., Phillips, L., & Beaulieu, C. (2008). Microstructural maturation of the human brain from childhood to adulthood. NeuroImage, 40(3), 1044–1055. https: //doi.org/10.1016/j.neuroimage.2007.12.053
[18]. Colom, R., Karama, S., Jung, R., & Haier, R. (2010). Human intelligence and brain networks. Neurocircuitry of Cognition, Emotion, and Behavior, 12(4), 489–501. https: //doi.org/10.31887/dcns.2010.12.4/rcolom
[19]. Barbey, A. K., Colom, R., Solomon, J., Krueger, F., Forbes, C., & Grafman, J. (2012). An integrative architecture for general intelligence and executive function revealed by lesion mapping. Brain, 135(4), 1154–1164. https: //doi.org/10.1093/brain/aws021
Cite this article
Zhang,E. (2025). Predicting Adolescent Intelligence Using Hierarchical Bayesian Regression. Theoretical and Natural Science,139,96-106.
Data availability
The datasets used and/or analyzed during the current study will be available from the authors upon reasonable request.
Disclaimer/Publisher's Note
The statements, opinions and data contained in all publications are solely those of the individual author(s) and contributor(s) and not of EWA Publishing and/or the editor(s). EWA Publishing and/or the editor(s) disclaim responsibility for any injury to people or property resulting from any ideas, methods, instructions or products referred to in the content.
About volume
Volume title: Proceedings of ICBioMed 2025 Symposium: AI for Healthcare: Advanced Medical Data Analytics and Smart Rehabilitation
© 2024 by the author(s). Licensee EWA Publishing, Oxford, UK. This article is an open access article distributed under the terms and
conditions of the Creative Commons Attribution (CC BY) license. Authors who
publish this series agree to the following terms:
1. Authors retain copyright and grant the series right of first publication with the work simultaneously licensed under a Creative Commons
Attribution License that allows others to share the work with an acknowledgment of the work's authorship and initial publication in this
series.
2. Authors are able to enter into separate, additional contractual arrangements for the non-exclusive distribution of the series's published
version of the work (e.g., post it to an institutional repository or publish it in a book), with an acknowledgment of its initial
publication in this series.
3. Authors are permitted and encouraged to post their work online (e.g., in institutional repositories or on their website) prior to and
during the submission process, as it can lead to productive exchanges, as well as earlier and greater citation of published work (See
Open access policy for details).
References
[1]. Casey, B. J., Tottenham, N., Liston, C., & Durston, S. (2005). Imaging the developing brain: what have I learned about cognitive development? Trends in Cognitive Sciences, 9(3), 104–110. https: //doi.org/10.1016/j.tics.2005.01.011ABCD Study. (n.d.). ABCD Study. https: //abcdstudy.org/
[2]. Blakemore, S.-J., & Choudhury, S. (2006). Development of the adolescent brain: Implications for executive function and social cognition. Journal of Child Psychology and Psychiatry, 47(3-4), 296–312. https: //doi.org/10.1111/j.1469-7610.2006.01611.x
[3]. Marquand, A. F., Rezek, I., Buitelaar, J., & Beckmann, C. F. (2016). Understanding Heterogeneity in Clinical Cohorts Using Normative Models: Beyond Case-Control Studies. Biological Psychiatry, 80(7), 552–561. https: //doi.org/10.1016/j.biopsych.2015.12.023
[4]. Rutherford, S., Barkema, P., Tso, I. F., Sripada, C., Beckmann, C. F., Ruhe, H. G., & Marquand, A. F. (2023). Evidence for embracing normative modeling. ELife, 12. https: //doi.org/10.7554/elife.85082
[5]. Shaw, P., Greenstein, D., Lerch, J., Clasen, L., Lenroot, R., Gogtay, N., Evans, A., Rapoport, J., & Giedd, J. (2006). Intellectual ability and cortical development in children and adolescents. Nature, 440(7084), 676–679. https: //doi.org/10.1038/nature04513
[6]. Casey, B. J., Cannonier, T., Conley, M. I., Cohen, A. O., Barch, D. M., Heitzeg, M. M., Soules, M. E., Teslovich, T., Dellarco, D. V., Garavan, H., Orr, C. A., Wager, T. D., Banich, M. T., Speer, N. K., Sutherland, M. T., Riedel, M. C., Dick, A. S., Bjork, J. M., Thomas, K. M., & Chaarani, B. (2018). The Adolescent Brain Cognitive Development (ABCD) study: Imaging acquisition across 21 sites. Developmental Cognitive Neuroscience, 32, 43–54. https: //doi.org/10.1016/j.dcn.2018.03.001
[7]. Hagler, D. J., Hatton, SeanN., Cornejo, M. D., Makowski, C., Fair, D. A., Dick, A. S., Sutherland, M. T., Casey, B. J., Barch, D. M., Harms, M. P., Watts, R., Bjork, J. M., Garavan, H. P., Hilmer, L., Pung, C. J., Sicat, C. S., Kuperman, J., Bartsch, H., Xue, F., & Heitzeg, M. M. (2019). Image processing and analysis methods for the Adolescent Brain Cognitive Development Study. NeuroImage, 202, 116091. https: //doi.org/10.1016/j.neuroimage.2019.116091
[8]. Wechsler, D. (2014). Wechsler Intelligence Scale for Children - Fifth Edition Manual. San Antonio, TX, Pearson.
[9]. Daniel, M.H., Wahlstrom, D. & Zhang, O. (2014) Equivalence of Q-interactive® and Paper Administrations of Cognitive Tasks: WISC®–V: Q-Interactive Technical Report
[10]. Strauss, E., Sherman, E.M.S., & Spreen, O. (2006) A compendium of neuropsychological tests. Oxford University Press. New York, New York. Third Edition.
[11]. Lezak, M.D., Howieson, D.B., Bigler, E.D., & Tranel, D. (2012) Neuropsychological assessment. 5th Edition. Oxford University Press. New York, NY.
[12]. Marquand, A. F. (2020). Predictive Clinical Neuroscience toolkit — Predictive Clinical Neuroscience Toolkit 0.20 documentation. Readthedocs.io. https: //pcntoolkit.readthedocs.io/
[13]. Doss, H., Witten, D., & Yao, Q. (2024, November 31). Journal of the Royal Statistical Society Series B: Statistical Methodology. OUP Academic. https: //academic.oup.com/jrsssb
[14]. Fair, D. A., Dosenbach, N. U. F., Church, J. A., Cohen, A. L., Brahmbhatt, S., Miezin, F. M., Barch, D. M., Raichle, M. E., Petersen, S. E., & Schlaggar, B. L. (2007). Development of distinct control networks through segregation and integration. Proceedings of the National Academy of Sciences, 104(33), 13507–13512. https: //doi.org/10.1073/pnas.0705843104
[15]. Grayson, D. S., & Fair, D. A. (2017). Development of large-scale functional networks from birth to adulthood: A guide to the neuroimaging literature. NeuroImage, 160, 15–31. https: //doi.org/10.1016/j.neuroimage.2017.01.079
[16]. Baum, G. L., Cui, Z., Roalf, D. R., Ciric, R., Betzel, R. F., Larsen, B., Cieslak, M., Cook, P. A., Xia, C. H., Moore, T. M., Ruparel, K., Oathes, D. J., Alexander-Bloch, A. F., Shinohara, R. T., Raznahan, A., Gur, R. E., Gur, R. C., Bassett, D. S., & Satterthwaite, T. D. (2020). Development of structure–function coupling in human brain networks during youth. Proceedings of the National Academy of Sciences, 117(1), 771–778. https: //doi.org/10.1073/pnas.1912034117
[17]. Lebel, C., Walker, L., Leemans, A., Phillips, L., & Beaulieu, C. (2008). Microstructural maturation of the human brain from childhood to adulthood. NeuroImage, 40(3), 1044–1055. https: //doi.org/10.1016/j.neuroimage.2007.12.053
[18]. Colom, R., Karama, S., Jung, R., & Haier, R. (2010). Human intelligence and brain networks. Neurocircuitry of Cognition, Emotion, and Behavior, 12(4), 489–501. https: //doi.org/10.31887/dcns.2010.12.4/rcolom
[19]. Barbey, A. K., Colom, R., Solomon, J., Krueger, F., Forbes, C., & Grafman, J. (2012). An integrative architecture for general intelligence and executive function revealed by lesion mapping. Brain, 135(4), 1154–1164. https: //doi.org/10.1093/brain/aws021