


1. Introduction
Forensic DNA analysis plays a pivotal role in crime scene investigations, with Short Tandem Repeat (STR) analysis at its core [1]. STRs are referred to as the Deoxyribonucleic acid(DNA) fingerprint of cells due to the individual polymorphism in the number of repeats within their core sequence. Within STR profiles, allele size and peak height respectively reflect DNA fragment length and abundance. Each diploid individual carries two alleles at autosomal loci, conferring individual specificity to genotypes [2].
When multiple individuals' DNA is present in biological evidence, mixed STR profiles exhibit complex allele superposition patterns accompanied by interference such as random losses, random gains, and peak height imbalances [3]. Traditional probabilistic models face challenges of insufficient resolvability and error accumulation when handling these complex scenarios, necessitating the development of new computational methods to enhance the analytical capability of mixed STR profiles. Recent studies have explored machine learning approaches to improve mixture interpretation, yet challenges remain in handling high-order mixtures and low-template samples [4]. Deep learning frameworks, particularly those incorporating biological constraints, show promising potential for robust forensic DNA profile analysis [5].
This study proposes a deep learning model that integrates biological prior knowledge to tackle the above problem. The main contributions of this study are: 1) Integrating biological prior knowledge with deep learning techniques to design an attention mechanism tailored to STR profile characteristics; 2) Proposing effective multimodal fusion and ensemble learning strategies to enhance model performance in complex scenarios; 3) Providing novel technical approaches and solutions for forensic DNA mixture analysis.
2. Materials and methods
2.1. Data sources and preprocessing
This study utilized mixed STR profile data measured in forensic laboratories, encompassing detection results for 16 autosomal STR loci (D3S1358, D13S317, D21S11, vWA, etc.). Sample types encompassed DNA mixtures from 2 to 5 individuals. Raw data for each sample included key characteristics such as fragment size (Size, unit: bp) and peak height (Height, unit: RFU) for each allele.
Data preprocessing includes the following steps:
a. Dynamic threshold filtering and valid peak identification: Employing dynamic threshold analysis
Distinguish between genuine allele signals and background noise.
Only peaks exceeding the specified height are considered “valid peaks.” Participate in subsequent analysis and feature calculation.
b. Normalization: To eliminate variations in amplification efficiency and detection sensitivity across different loci, all sequence features (Size, Height) and numerical auxiliary features undergo minimum-maximum scaling, independently normalized to the range [0, 1].
c.Sequence Padding and Mask Construction: Since the number of effective alleles detected
At the same locus varies across samples, each sample's (Size, Height) pairs are padded to a uniform maximum length using zero vectors. Concurrently, a Boolean mask sequence is generated to explicitly distinguish between effective data and padding positions within the sequence.
2.2. Model architecture
2.2.1. Distance-Weighted Self-Attention mechanism (DWSA)
Self-attention mechanisms can capture global dependencies within sequences, but their standard form does not account for biological prior knowledge—namely, that the strength of associations between alleles in STR maps is closely correlated with their physical distance. To address this, this paper proposes the Distance-Weighted Self-Attention Mechanism (DWSA).
First, the input height features are projected onto the query, key, and value spaces via a linear transformation:
Here,
Subsequently, a distance penalty term based on normalized size is introduced during attention weight computation:
Where
Finally, the attention weights
The biological significance of this mechanism lies in the fact that alleles in close physical proximity (such as the main peak and its stutter peak) are more likely to originate from the same biological process. DWSA explicitly reinforces this local association through its penalty term, thereby reducing interference from unrelated distant peaks and enabling the model to identify key patterns with greater precision.
2.2.2. Multimodal dual-branch model architecture
For contributor inference, the model employs a dual-branch architecture to fuse multimodal information:
Sequence Branch: Processes normalized and padded (Size, Height) sequence data
Auxiliary Branch: Processes normalized macro-statistical feature vectors
Fusion Strategy: Features from both branches undergo independent high-level feature extraction via multi-layer perceptrons (MLPs). The extracted feature vectors are concatenated, and a fully connected layer outputs the prediction (theoretical effective allele number).
For contributor proportion estimation, the model input is expanded into four modalities: normalized peak height sequence, raw Size sequence (retaining absolute scale), validity mask, and the number of contributors N provided by Problem 1 (injected as a conditional input). The core mechanism employs an improved nonlinear distance-decaying self-attention mechanism (using the exponential decay function
2.3. Model training and evaluation
2.3.1. Training details
Contributor Number Inference: The learning objective is to predict the theoretical number of alleles 2×
The optimizer uses Adam with an early stopping strategy to prevent overfitting.
Contributor Proportion Estimation: The learning objective is to predict the proportion distribution of contributors. The loss function employs Jensen-Shannon Divergence (JSD) to stably measure differences between probability distributions:
The loss function implementation includes steps such as dynamically resolving the true population size N, computing only the first N valid proportions, and ensuring numerical stability.
The model trains a separate submodel for each locus to fully leverage locus-specific information.
2.3.2. Evaluation metrics
Contributor Number Inference: Primarily assesses the accuracy of the final number prediction. Additionally, records the Mean Absolute Error (MAE) and Root Mean Square Error (RMSE) of each submodel's predicted allele counts to analyze performance variations across loci.
Contributor Proportion Estimation: Primarily evaluates the Mean Absolute Error (MAE) between predicted and actual proportions. Simultaneously analyzes MAE variations across different contributor counts and compares ensemble model performance against independent models.
2.3.3. Ensemble strategy
Estimating the number of contributors: The final predicted allele count
Contributor proportion estimation: For test samples, the ensemble Logits vector
3. Results
3.1. Contributor count prediction results
The model achieved perfect performance on the test set (50 samples). As shown in Table 1, all mixed samples of 2, 3, 4, and 5 contributors were correctly classified, achieving an overall accuracy of 100%.
|
Actual |
Prediction Category |
|||
|
2 |
3 |
4 |
5 |
|
|
2 |
15 |
0 |
0 |
0 |
|
3 |
0 |
16 |
0 |
0 |
|
4 |
0 |
0 |
11 |
0 |
|
5 |
0 |
0 |
0 |
9 |
The performance of individual locus submodels showed significant variation (Table 2). Highly polymorphic loci such as D13S317, D3S1358, and D21S11 demonstrated high prediction accuracy (100%, 98.04%, 98.04%) and low MAE (~0.13–0.16). In contrast, low-polymorphism or highly complex loci like TPOX, D7S820, and D5S818 exhibited relatively lower prediction accuracy (54.9%, 54.9%, 58.8%) and higher MAE (~0.46–0.53). This confirms that different loci contribute varying degrees of information to population size estimation and underscores the necessity of an ensemble strategy.
|
Marker |
MAE |
RMSE |
Accuracy |
|
D13S317 |
0.1613 |
0.2028 |
1.0000 |
|
D3S1358 |
0.1265 |
0.1792 |
0.9804 |
|
D21S11 |
0.1388 |
0.1833 |
0.9804 |
|
vWA |
0.1290 |
0.1964 |
0.9608 |
|
TH01 |
0.1810 |
0.2417 |
0.9216 |
|
AMEL |
0.2448 |
0.2978 |
0.9020 |
|
D8S1179 |
0.2886 |
0.3437 |
0.8824 |
|
FGA |
0.2526 |
0.3207 |
0.8824 |
|
D18S51 |
0.2203 |
0.2964 |
0.8627 |
|
D16S539 |
0.2409 |
0.3241 |
0.8431 |
|
D19S433 |
0.3272 |
0.3648 |
0.8235 |
|
CSF1PO |
0.3530 |
0.4194 |
0.7843 |
|
D2S1338 |
0.3883 |
0.4450 |
0.6863 |
|
D5S818 |
0.5032 |
0.5721 |
0.5882 |
|
D7S820 |
0.4633 |
0.5318 |
0.5490 |
|
TPOX |
0.5346 |
0.6190 |
0.5490 |
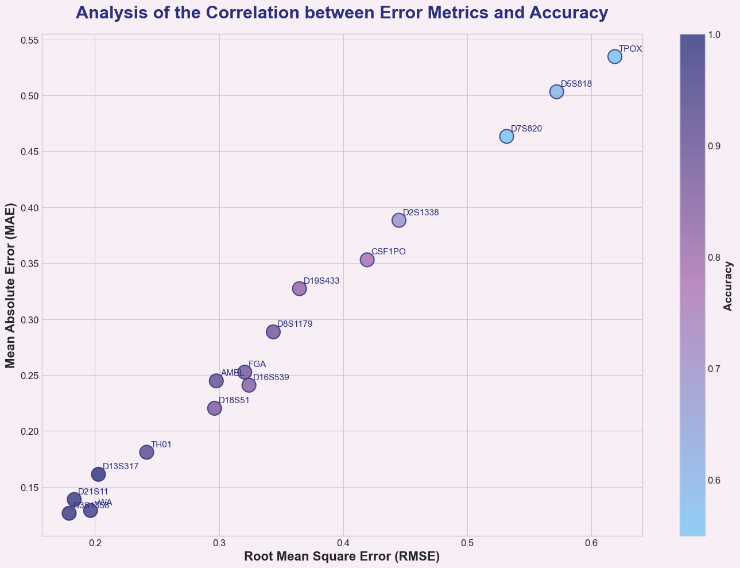
The weighted ensemble strategy effectively leverages reliable information from high-performance loci while suppressing noise from low-performance loci, ultimately achieving 100% accuracy. Case studies demonstrate that even for highly challenging samples involving five individuals, the model accurately predicts a theoretical allele count of 10 by integrating predictions from multiple loci, thereby correctly inferring the number of individuals as five, as shown in Figure 1.
3.2. Contributor proportion prediction results
The proportion prediction model also demonstrated excellent and robust performance. The overall average ensemble MAE across all 50 test samples was 0.0809, indicating an average absolute deviation of approximately 8.09% between predicted and actual proportions.
Model performance did not decline monotonically with increasing sample size (Table 3). For the more complex 4-person and 5-person mixed samples, the average MAE (0.0768, 0.0673) was lower than that for 2-person and 3-person samples (0.0898, 0.1002), with smaller standard deviations. This indicates that the ensemble strategy demonstrates greater advantages when handling high-complexity mixtures, effectively integrating multi-locus information to resist noise.
|
Contributors(N) |
Samplesize |
AverageEnsembleMAE |
MAEstandarddeviation |
|
2 |
6 |
0.0898 |
0.0934 |
|
3 |
12 |
0.1002 |
0.0533 |
|
4 |
16 |
0.0768 |
0.0469 |
|
5 |
16 |
0.0673 |
0.0298 |
The performance of the ensemble model (MAE=0.0809) significantly outperformed all 16 independent locus models (whose MAEs ranged from 0.0886 to 0.0988) (Table 4). This demonstrates that multi-locus integration in Logits space effectively smooths biases arising from data quality issues and allele loss in individual loci, thereby enhancing prediction accuracy and robustness.
|
Model |
Average MAE |
Model |
Average MAE |
|
MAE(AMEL) |
0.0925 |
MAE(D5S818) |
0.0922 |
|
MAE(CSF1PO) |
0.0988 |
MAE(D7S820) |
0.0886 |
|
MAE(D13S317) |
0.0940 |
MAE(D8S1179) |
0.0970 |
|
MAE(D16S539) |
0.0986 |
MAE(FGA) |
0.0954 |
|
MAE(D18S51) |
0.0985 |
MAE(TH01) |
0.0976 |
|
MAE(D19S433) |
0.0962 |
MAE(TPOX) |
0.0932 |
|
MAE(D21S11) |
0.0924 |
MAE(vWA) |
0.0937 |
|
MAE(D2S1338) |
0.0975 |
Integrated Model |
0.0809 |
|
MAE(D3S1358) |
0.0955 |
The predicted proportions [0.1008, 0.4747, 0.4245] for the typical sample (ID:9, 3-person mixed) closely match the actual proportions [0.1111, 0.4444, 0.4444], with an ensemble MAE as low as 0.0202, demonstrating the model's high accuracy under ideal conditions.
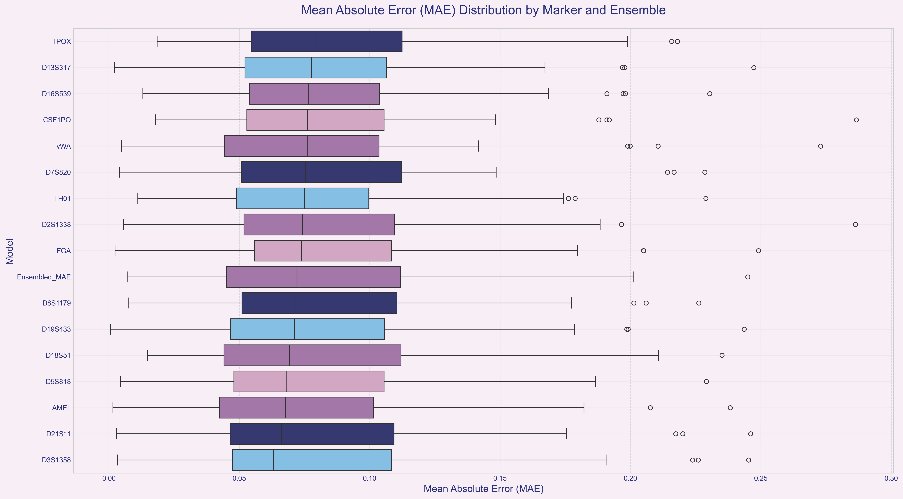
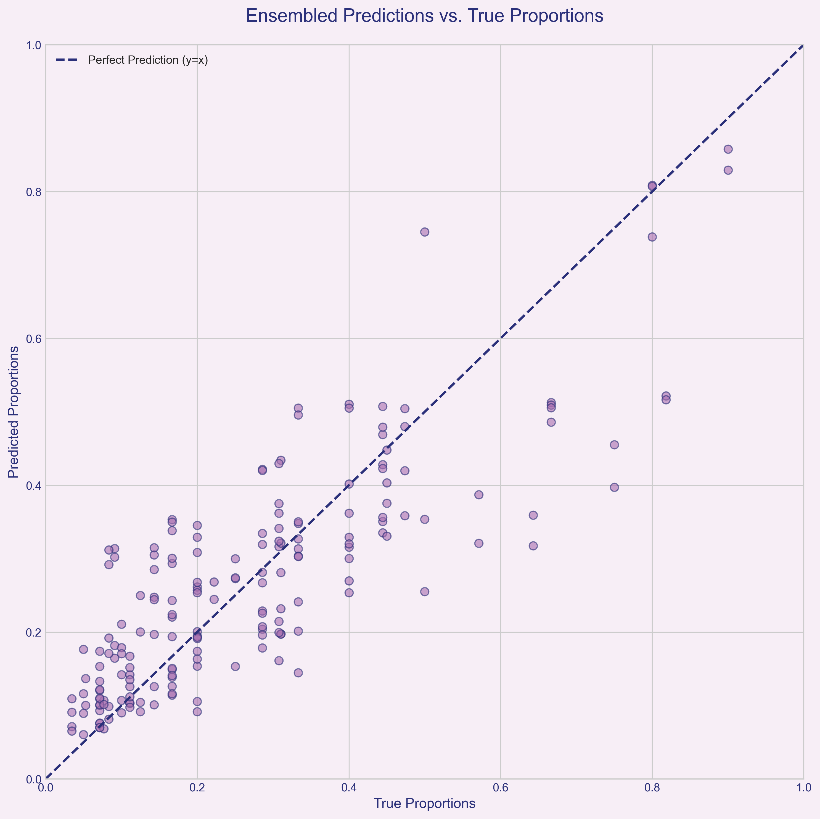
This result provides strong evidence that our ensemble strategy is successful. Ensemble learning effectively smooths out prediction biases in individual models caused by data noise, allele loss, or other random factors by synthesizing the “opinions” of multiple models, as shown in Figure 2. Even when data quality at a single locus leads to inaccurate predictions in its independent model, information from other loci can correct this bias. Consequently, the final ensemble result more closely approximates the true value and exhibits greater robustnes, as shown in Figure 3.
4. Model analysis
The cascade model constructed in this study demonstrates significant advantages in hybrid STR profile analysis:
First, the successful application of the distance-weighted self-attention mechanism (DWSA) represents one of the core innovations enabling the model's high accuracy. This mechanism successfully encodes the key biological prior that physically proximate alleles exhibit stronger associations into the model. By introducing distance penalty terms (linear or nonlinear decay), the model precisely captures local biological features such as stutter peaks, significantly enhancing its ability to recognize complex spatial interaction patterns between alleles. This attention mechanism design grounded in biological prior offers new insights for deep learning applications in specialized domains.
Second, the multimodal fusion design enables the model to simultaneously leverage micro-level sequence patterns (Size, Height sequences and their interactions) and macro-level statistical features (peak height distribution, effective gene number, etc.). This fusion provides a more comprehensive, multidimensional information view, enhancing the model's understanding and robustness toward complex, variable data. Particularly in applications like forensic DNA analysis where data quality varies significantly, the complementarity of multi-source information is crucial.
Third, the ingenious application of ensemble learning strategies effectively addresses the disparity in information content and reliability across loci. Weighted ensemble (for individual prediction) and logit-space averaging (for proportion prediction) allow the model to synthesize multiple information sources, automatically assigning higher weights to reliable loci. This approach effectively mitigates the impact of low-quality data or noise interference, ensuring the stability and accuracy of final decisions. This strategy demonstrates significant advantages when handling challenging samples.
Finally, the “number→proportion” cascade analysis framework aligns with forensic experts' logical interpretation process. The accurate number prior provided in Problem 1 establishes the foundation for precise proportion prediction in Problem 2, forming a systematic solution. This cascade design not only enhances analytical efficiency but also improves result interpretability.
Future research directions include: 1) developing more robust feature extraction methods, particularly for low-polymorphism loci; 2) exploring end-to-end training strategies to reduce error accumulation in cascading frameworks; 3) incorporating additional prior biological knowledge, such as stutter ratios and allele frequencies across different loci; 4) expanding dataset scale, especially by including rare proportion and highly degraded samples, to enhance model generalization.
5. Conclusion
This paper addresses key challenges in forensic DNA mixture analysis by proposing a mixed STR profile parsing model based on distance-weighted self-attention (DWSA). Through multimodal feature fusion and ensemble learning strategies, it systematically resolves the problems of contributor number inference and proportion estimation.
Experimental results demonstrate that the proposed model achieves 100% accuracy in number prediction and an average MAE of 0.0809 in proportion estimation, significantly outperforming traditional methods. The DWSA mechanism effectively captures local associations among alleles, multimodal fusion provides more comprehensive feature representations, and the ensemble learning strategy ensures model robustness.
However, this study still has some limitations. First, model performance is highly dependent on the accuracy of the initial number prediction. Any misjudgment of the number will lead to cumulative errors in subsequent proportion estimation. Second, although the ensemble strategy mitigates the impact of low-polymorphic loci to some extent, the prediction performance for loci such as TPOX and D7S820 still has significant room for improvement. Additionally, the model's performance in handling extreme proportion mixtures (e.g., where the major contributor's proportion exceeds 90%) requires further validation.
Future work will focus on optimizing the model architecture, incorporating additional prior knowledge, and expanding the dataset scale to further enhance the model's performance and practical value in complex scenarios.
References
[1]. Butler JM. Advanced topics in forensic DNA typing: methodology. Academic Press; 2011.
[2]. Gill P, Sparkes R, Pinchin R, Clayton T, Whitaker J, Buckleton J. Interpreting simple STR mixtures using allele peak areas. Forensic Science International. 1998; 91(1): 41-53.
[3]. Taylor D, Bright JA, Buckleton J. The interpretation of single source and mixed DNA profiles. Forensic Science International: Genetics. 2013; 7(5): 516-528.
[4]. Škaro V, Primorac D, Projić P, et al. Towards advanced interpretation of STR profiles: Applications of machine learning for the identification of the number of contributors in a DNA sample. Forensic Science International: Genetics. 2021; 54: 102557.
[5]. Cheng K, Jin X, Li H, et al. Deep learning model for estimating the number of contributors in DNA mixtures using a hierarchical attention mechanism. Briefings in Bioinformatics. 2022; 23(6): bbac440.
Cite this article
Su,Z. (2025). A Study on Hybrid STR Profile Analysis Model Based on Distance-Weighted Self-Attention Mechanism. Theoretical and Natural Science,139,210-219.
Data availability
The datasets used and/or analyzed during the current study will be available from the authors upon reasonable request.
Disclaimer/Publisher's Note
The statements, opinions and data contained in all publications are solely those of the individual author(s) and contributor(s) and not of EWA Publishing and/or the editor(s). EWA Publishing and/or the editor(s) disclaim responsibility for any injury to people or property resulting from any ideas, methods, instructions or products referred to in the content.
About volume
Volume title: Proceedings of ICBioMed 2025 Symposium: AI for Healthcare: Advanced Medical Data Analytics and Smart Rehabilitation
© 2024 by the author(s). Licensee EWA Publishing, Oxford, UK. This article is an open access article distributed under the terms and
conditions of the Creative Commons Attribution (CC BY) license. Authors who
publish this series agree to the following terms:
1. Authors retain copyright and grant the series right of first publication with the work simultaneously licensed under a Creative Commons
Attribution License that allows others to share the work with an acknowledgment of the work's authorship and initial publication in this
series.
2. Authors are able to enter into separate, additional contractual arrangements for the non-exclusive distribution of the series's published
version of the work (e.g., post it to an institutional repository or publish it in a book), with an acknowledgment of its initial
publication in this series.
3. Authors are permitted and encouraged to post their work online (e.g., in institutional repositories or on their website) prior to and
during the submission process, as it can lead to productive exchanges, as well as earlier and greater citation of published work (See
Open access policy for details).
References
[1]. Butler JM. Advanced topics in forensic DNA typing: methodology. Academic Press; 2011.
[2]. Gill P, Sparkes R, Pinchin R, Clayton T, Whitaker J, Buckleton J. Interpreting simple STR mixtures using allele peak areas. Forensic Science International. 1998; 91(1): 41-53.
[3]. Taylor D, Bright JA, Buckleton J. The interpretation of single source and mixed DNA profiles. Forensic Science International: Genetics. 2013; 7(5): 516-528.
[4]. Škaro V, Primorac D, Projić P, et al. Towards advanced interpretation of STR profiles: Applications of machine learning for the identification of the number of contributors in a DNA sample. Forensic Science International: Genetics. 2021; 54: 102557.
[5]. Cheng K, Jin X, Li H, et al. Deep learning model for estimating the number of contributors in DNA mixtures using a hierarchical attention mechanism. Briefings in Bioinformatics. 2022; 23(6): bbac440.