


Research about how lead influence the detection rate of muons and its attenuation coefficient
Cefu Lyu1*+, Haojiang Hu2+, Chuyue Hu3+, Yifan Wu4+
1Eberly College of Science, Penn State University, State ,16802, U.S
2School of Physics and Materials Science, Nanchang University, Nanchang, 330031, China
3Shenzhen College of International Education, Shenzhen, 518017, China
4Shanghai World Foreign Language Academy, Shanghai, 200233, China
* Corresponding author. Email: franklyu0831@sina.com
+These authors contributed equally to this work and should be considered co-first authors.
Abstract: This paper presents a way to determine how lead influence the detection rate of muon at the earth’s surface. There are four sets of data on different thicknesses of lead above the detectors included in the experiments, and the largest set has 45054 groups of data. After using python modules to analyze the data of muons and other background particles such as electrons detected by desktop muon detectors, the discussion about identity of muons, especially about the detection rate, was conducted, as well as their relations with other factors. Then, the comparison was made between the average rate of muon detections of varied thicknesses of lead above the detectors to define the correlation between them. The result of data analysis mainly demonstrates an exponentially decreasing relationship. Accordingly, the calculation of the attenuation coefficient of lead which influences the exponential relationship was conducted as well.
Keywords: Cosmic Ray, Extensive Air Shower, CosmicWatch Desktop Muon Detector, Coincident Measurement, Attenuation Coefficient.
1. INTRODUCTION
This paper describes some results and conclusions about muons detected at sea level by CosmicWatch Desktop Muon Detector. When cosmic rays enter the earth and interact with the upper atmosphere, massive particles are produced, known as Extensive Air Shower. Most of the final products are gamma rays, high-energy electron-positron pairs, and muons. Muon is classified as a lepton with an electric charge of -1e and a spin of \( -\frac{1}{2} \) , but with a much greater mass. Muons come from cosmic rays at sea level with an average energy of 4 GeV. This means it is relatively penetrable yet enough to reach the ground, which can then be detected by the apparatus [1].
This research is performed by CosmicWatch Desktop Muon Detector, which is designed by MIT and NCBJ and an undergraduate-level particle physics detector that is highly portable and self-sufficient. The detector aims to record the events of particles interacting with the material in the detector, mainly through the ionization process. By analyzing the data through python, some results can be developed. More information can be found in Ref [2-4].
This work uses coincidence measurement: a measurement that two detectors place in combinations so that only particular particles triggering both two detectors will be recorded to distinguish muons from other particles. Generally, the muon will penetrate both two detectors along with a few gamma rays. By using coincidence measurement, we depicted the data of muon [2]. In fact, most detected particles come from background radiation, alpha, beta, and gamma rays at sea level. By using lead coverage, some background radiation will be blocked. This paper describes the distribution of muon rate at the different thicknesses of lead.
In section II, the experiment set up and the working principles for apparatus are introduced. Then, the method to distinguish muon from background noises is discussed in section III. And the calculation and conclusions of this research are shown in section IV and V.
2. SETUP
2.1 Cosmic Ray
Most cosmic rays consist of protons (74%), a few helium nuclei (18%), and heavier elements which produced from the supernova explosion. When cosmic rays enter the earth, they collide mostly with nuclei of the oxygen and nitrogen of the upper atmosphere. Then, dramatic particles are produced. This process is known as an extensive air shower. The produced particles are primarily mesons - pions and kaons - which are short-lived particles. Besides, a small part of cosmic rays, especially protons and neutrons, can reach the earth’s surface. The high-energy photons are produced from the decay of neutral mesons. More mesons will be produced when charged mesons travel far enough to interact with the atmosphere. The cosmic ray muons are produced from the decay of mesons. About 80%-90% of the muons at the energy scale GeV to TeV come from the decay of pions and the rest muons are from kaons. Although muons are unstable, whose half-life is about 2.2 10-6, a muon with 2.4 GeV of energy has a longer half-life due to relativistic effects, large enough to reach the earth’s surface. Muons are especially penetrating, which lose only a tiny part of their energy through the ionizing process with the atmosphere or other materials. Typically, a muon with 4 GeV energy, average kinetic energy at sea level, would penetrate about 1.6 m lead to stop completely. More information can be found in Ref [5-7].
2.2 Radioactive Backgrounds
The ionizing radiation that happens at sea level can also has an influence on the measurement. Its energy level is relatively low (GeV) compared with the cosmic ray (MeV) but sufficient enough to dominate the particle source interacting with the detector. The radioactive backgrounds are mostly divided into three main processes: alpha, beta, and gamma decay radiation. Alpha particles are helium nuclei coming from unstable atoms. According to the quantum effect, helium nuclei have the possibility of overcoming the potential barrier and ejecting from the nuclei, known as quantum tunning. Since the helium nucleus has a +2e charge and a relatively heavier mass of 4GV, it is considered less penetrating. Beta decay is a three-body decay that a neutron transforms into a proton, an electron, and a neutrino. As a result, the produced electrons have a continuous energy spectrum range from tens of keV to a few MeV. Gamma rays are high-energy photons ejecting from de-excitation atomic nuclei. The energy scales of gamma rays are in the range of 100keV to MeV [8].
2.3 CosmicWatch Desktop Muon Detector
CosmicWatch Desktop Muon Detector is a portable, self-contained, low-costing machine designed to collect and analyze data from muons and other particles from cosmic rays or background radiation.
Each muon detector mainly consists of a scintillator and a silicon photomultiplier (SiPM). The CosmicWatch Desktop Muon Detector uses an organic plastic scintillator that interacts with particles through electromagnetic interactions and then emits photons, whose energy is proportional to the energy precipitated in the material. Photomultipliers are generally used in particle physics as a device for converting photon energy into a measurable electrical signal - the SiPM voltage. In a nutshell, incident particles interact with the scintillator through ionizing processes and then produce photons, and photons are transformed into electrical signals by SiPM. These signals are then processed by a printed circuit board (PCB), which amplifies and shapes the signal so that the microcontroller (Arduino Nano) can measure the event time stamp and peak voltage. Once the voltage is above the threshold, the microcontroller will record the event data to an SD card or a computer through a USB connection. The detector records the event number, event time, average 10-bit ADC value, calculated SiPM peak voltage, total dead-time, pressure, and temperature for each event.
Note that each event recorded by detectors takes time to calculate, and the period during which the device can’t make measurements is called dead-time. When calculating the sum time of all events, up-time should subtract the total dead-time and the rest of the time is called live-time [9].
2.4 Coincidence measurement
Since muons are relatively more penetrating than other particles like electrons and heavy nuclei, if two detectors are put in a combination, only particular particles such as muons and a few photons can trigger the two detectors simultaneously. This method is called coincidence measurement. The time window is about 30us due to two detectors’ characteristics. In this measurement, detectors are chosen to be put up and down, where one is set to the master mode and the other one is on the coincidence mode [2].
Once two detectors are set ready, only muons or particles from a solid spectrum angle will be recorded. Both of particles could trigger the master and the coincident detector simultaneously, but not the very muon particle wanted.
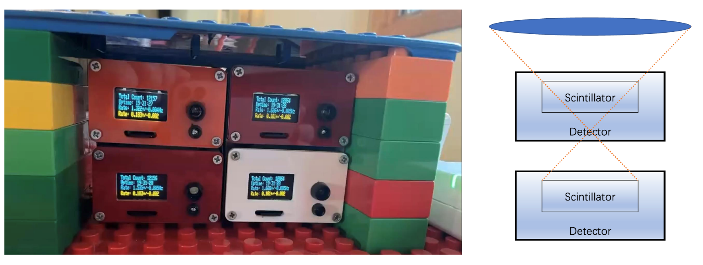
FIG. 1. The combination of detectors in this measurement.
These background data could have a more considerable influence as the counting rate is higher but can be easily distinguished from muons’ data.
3. EXPERIMENTAL SKETCH AND SALIENT DETAILS
3.1 Data Pre-processing
In the experiment, four sets of data are obtained. The thickness of lead that put on the top of the machine varies in different sets. Using the detectors set in FIG. 1, 7 quantities are able to be recorded: Event, Time Stamp(ms), SiPM(mV), Temperature(°C), Pressure (Pa), Dead Time(us), and Coincident. A sample of data from detector 1 when there is no lead added on the top is listed in table I.
TABLE I. Sample of 7 data qualities from detector 1 when there is no lead added on the top.
Event | Time Stamp (ms) | SiPM (mV) | Tempe-rature (°C) | Pressure (Pa) | Dead Time (us) | Coinc-ident |
1 | 1342 | 7.4 | 34.42 | 101209.9 | 101030 | 0 |
2 | 1893 | 44.54 | 34.42 | 101210.6 | 56477 | 0 |
3 | 318 | 14.86 | 34.42 | 101211.6 | 52360 | 0 |
4 | 3208 | 39.12 | 34.42 | 101211.6 | 1849 | 0 |
5 | 4256 | 10.8 | 34.42 | 101212.6 | 52358 | 0 |
Because of different measuring time durations, the amounts of data in each set are also different. The specific numbers are shown in table II.
TABLE II. Sets of data with the different thickness of lead added on the top and the total amount of data of detector 1 and detector 3.
Set | Thickness of lead added(cm) | Number of data in detector 1 | Number of data in detector 3 |
1 | 0 | 25780 | 29814 |
2 | 5 | 37827 | 45714 |
3 | 10 | 36374 | 44671 |
4 | 15 | 45054 | 55687 |
Table II shows the amount of data for detector 1 and 3, and all four sets are checked before processing. Some of the abnormal data in set 1 are removed, which is responsible for the gap in the following figures of set 1 (see FIG 2, FIG 3, and FIG 4).
3.2 Rate Distribution
According to II.4, the principle of determining muon particles is that muon particles will pass through both detectors at the same time. However, the time stamp recorded in two detectors of a muon could be different because of the time difference due to machine error. This time difference is a variable value since the two detector’s built-in time flow is different. In summary, the experimenter needs to determine the time difference between the two detectors by muons first and then filter the muons by the time difference.
Take the data of set 1 as an example. The data is first plotted in a scatter diagram as shown in FIG 2, which is the time difference against the time stamp of detector 1 in a large scale. By carefully examining the graph, a condense dot line could be observed. The line represents the aggregation of muons.
Zooming in the graph, a specific range of time difference could be determined. After this, an equivalent line of changing time differences is established to model the data better. FIG 3 shows the equivalent line in red.
The condensed dot line should be near zero because the detectors detected muons at almost the same instant. This time difference is caused by machine errors which should be eliminated. Then the changing time difference is corrected and calculated automatically by our python program. The new slope for set 1 is 0.0172 and the intercept is 1.481. The corrections of all four groups of data are shown in FIG 4.
After all calculations, new slopes and intercepts of equivalent lines for all sets are obtained and are listed in table III.
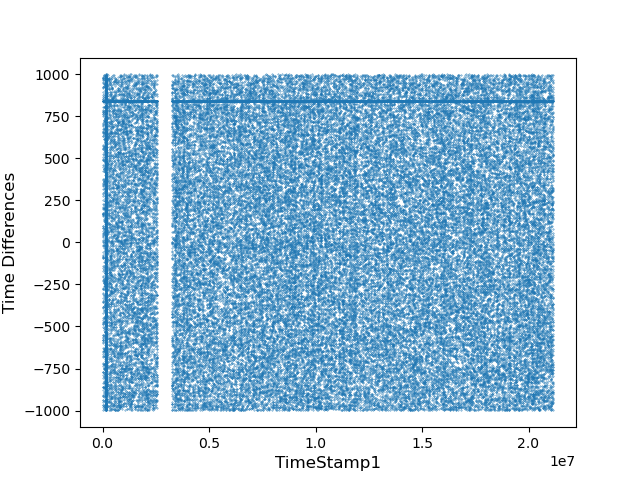
FIG. 2. Scatter figure of time difference with range between -1000 to 1000 against time stamp of detector 1 of set 1 with an equivalent red line.
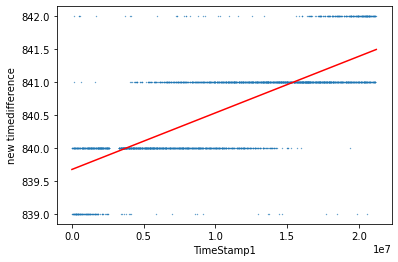
FIG. 3. Scatter figure of time difference with range between 839 to 842 against time stamp of detector 1 of set 1 with an equivalent red line.
After filtering, the number of muons detected for detector 1 in set 1 is 3600. The number of muons in the other sets is listed in table IV below.
To ensure the accuracy of data processing, the time difference is checked in another form of graph: pairs versus time differences, where “pairs” refers to the number of data that falls into one time difference value. FIG 5 shows the original data, and FIG 6 demonstrates the regulated data.
The peak on the graph shows the accumulation of muons. It is obvious that the time differences of muons in the two detectors are about zero, which means the correction is successful.
Finally, all data that meet the time differences in each set are stored in a new file for subsequent analysis. Meanwhile, a speculation can be made that about 10% of the selected data is the signal of background decay. This error needs to be corrected in further data analysis.
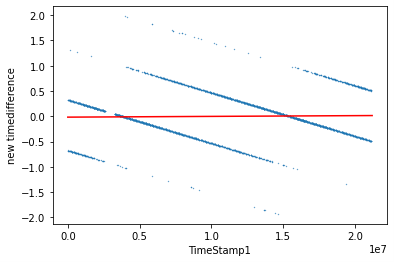
FIG. 4. Correction of scatter figure of time difference with range between 839 to 842 against time stamp of detector 1 of set 1 with an equivalent red line by multiplying a slope and adding a constant.
TABLE III. Slopes and Intercept that correct the equivalent line for each set.
Set | slope | Intercept |
1 | 0.0172 | 1.481 |
2 | 0.0137 | -4.783 |
3 | -0.0536 | 3.409 |
4 | 0.0035 | -2.232 |
3.3 SiPM Voltages of Muons
To ensure that the events selected from all the events are muon events, the work compared the energy loss of background noise particles and muon particles based on the characteristics of the Silicon Photomultiplier (See section II). When different particles pass through the detector, they would produce different amounts of current, which are shaped into signals that could be measured by an Arduino Nano [9]. Then, the Arduino Nano measures the event time stamp and peak value on the analog-to-digital converter (ADC). The measured peak ADC values can then be converted back into a SiPM peak voltage [2].
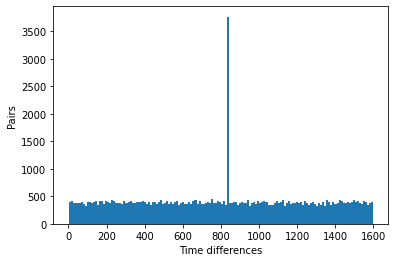
FIG. 5. Graph of abundance of number of particles that falls in a certain time range.
TABLE IV. Number of data of muon detected by detector 1 in each set of experiment.
Set | Number of muon’s data |
1 | 3600 |
2 | 5102 |
3 | 4886 |
4 | 5920 |
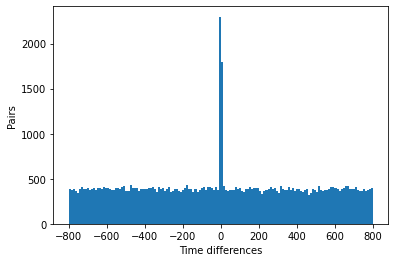
FIG. 6. Graph of abundance of number of particles that falls in a certain time range after time difference correction.
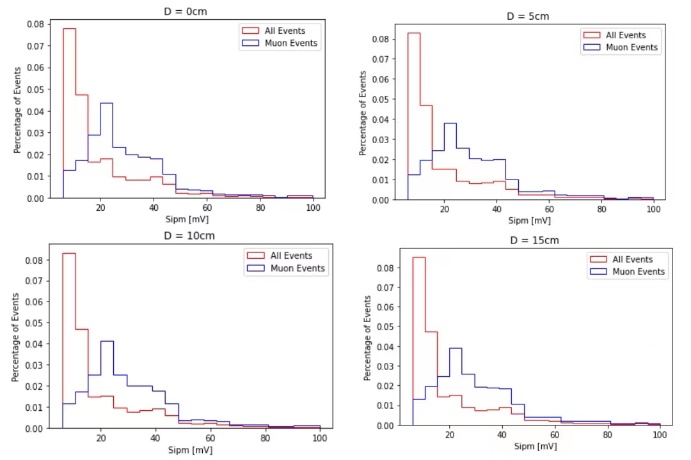
FIG. 7. Histogram of SiPM values. Red bins are SiPM voltages of all events, blue bins are SiPM voltages of Muon events.
Therefore, the muon events would generate SiPM voltages different from voltages generated by all the other particles. Histograms of SiPM values are plotted in FIG. 7 to describe the frequency of SiPM values with respect to their number of events. 5mV is chosen as the width of each bin, ranging from 0mV to 100mV where most events are generated. As shown in FIG. 7, most of the events generate SiPM voltages in the range of 5 to 10 mV and most of the muon events generate SiPM voltages in the range of 20 to 25 mV. Histograms of both muon events and all events indicate the properties of standard Poisson distributions and that the thicknesses of the lead placed above the detector didn’t change the frequency a lot. So, it could prove that most of the events selected from all the events are different from the background noises. These results agree with the results obtained by Axani that the muons generated higher SiPM voltages than most of the background noise particles such as electrons [2].
3.4 Poisson Distribution
Poisson distribution is a discrete probability distribution that describes the number of random events occurring per unit time [10]. From this definition, it could be known that an event happens that is completely independent of the occurrence of other events will follow the rule of Poisson distribution. Theoretically, each decay follows the rule of Poisson distribution. In this case, the distributions of the average rate in certain time interval of different sets can be plotted to test whether the data follow the rules of Poisson distribution. The time intervals are chosen as 10s, 40s, 100s, 200s, 300s, and 600s. The graph of set 1 is shown in Fig. 8 as an example.
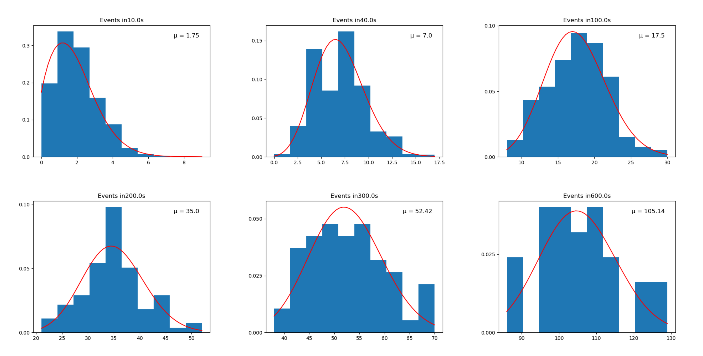
FIG. 8. Histogram of SiPM values. Red bins are SiPM voltages of all events, blue bins are SiPM voltages of Muon events.
In the FIG. 8, each column shows the abundance of muons detected per unit time while the red lines are the expected Poisson distribution. The shape of blue columns relatively fits the Poisson distribution shown in red line. Therefore, it is able to conclude that each muon decay is a completely independent event.
4. DATA PRESENTATION AND ERROR ANALYSIS
In previous sections, the paper has discussed how events are selected and proved to be muon. This section is going to discuss how lead influences the detection rate of muons. The experiments are about four detections under the same environments but with different thicknesses of the lead above the detectors. And the attenuation coefficient of lead is calculated to determine how its thickness influences the detection rate. In FIG. 9, the average rate of muon detection of detector 1 under different thicknesses of lead is plotted. The average rate is calculated by equation. 1.
\( R=\frac{N}{S-dt}…(1) \)
Where N is the total event number, S is the time stamp of the last detection, and dt is the sum of dead time (see section II).
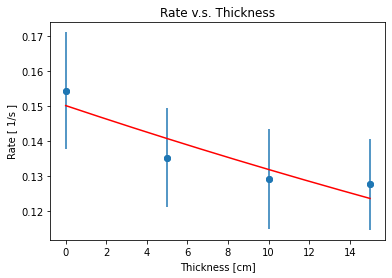
Note: The blue dots are the average rate of detection with corresponding thickness of lead. The red line is the fitting curve of the plots with Eq 2.
FIG. 9. Correlation between average rate of muon detection and thickness of lead above the detectors.
The paper has already discussed that there is still ten percent of background events in selected muon events in section III. Therefore, to reduce the error, the experiment discarded ten percent of the events and kept the time stamps. Although there are still some errors, they can be ignored because of the large data scale. The correlation between the rate of detection and thickness of lead can be defined using the following equation.
\( R={R_{0}}{e^{\frac{D}{λ}}}…(2) \)
Where \( {R_{0}} \) is the rate of detection with no lead above the detector, and λ is the attenuation coefficient of lead. The plots in FIG. 9 follows the prediction, and the fitting curve of these four plots is inside the range of the error bars. The attenuation coefficient lambda = 77.42±14.77 cm and the rate of detection without lead \( {R_{0}} \) = 0.15/s. The fitting curve acts like a straight line in the range of 0 cm to 20 cm. So, the range is increased to 200cm as shown in the FIG. 10 to get a more complete fitting curve, which is more logical and consistent with expectations. With a relatively small amount of data, there will be some errors in the results. But the results demonstrate the feasibility of the experiment. Thus, the experiment determined how lead influences the rate of muons by calculating the lead’s attenuation coefficient.
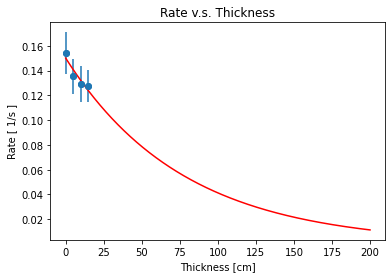
Note:Red curve is the extension of rad line in FIG. 9.
FIG. 10. Theoretical correlation between average rate of muon detection and thickness of lead above the detectors.
5. CONCLUSIONS
Cosmic-ray muons decayed from Mesons were detected by detectors at 210 feet above sea level with 4 GeV energy and were recognized from more than twenty thousand other background noise particles. Then this research used coincident measurements to test these events’ properties and compared them with background noise events. Consequently, this work proved that the data selected is muon detection. Based on Axani’s research [2], it is able to know that the lead could decrease the background noise. Hence, this work continued testing how lead influences the detection rate of muons. The experiment put lead above detectors with different thicknesses and calculate the attenuation coefficient of lead. The major findings of this work are as follows.
1. This paper plotted the Poisson distribution of muon events and proved that each muon detection is an induvial event.
2. Most of the muon detection would generate a SiPM voltage at a range of 20mV to 25mV.
3. The detection rate of muon without any materials above the detector equals 0.15 \( \frac{1}{s} \) .
4. The attenuation coefficient of lead equals 77.42±14.77 cm.
This work provided deep research on using CosmicWatch Desktop Muon Detectors to detect the muon from cosmic rays. Also, the results showed how lead influence the detection rate of muon and calculate the attenuation coefficient of lead with relative accuracy. Future study could calculate the attenuation coefficient of lead more accurately or test other materials by using the methods showed in this work.
6. ACKNOWLEDGMENTS
These authors contributed equally to this work and should be considered co-first authors.
References
[1]. Griffiths, D. (2020). Introduction to elementary particles. John Wiley & Sons.
[2]. Axani, S. N. (2019). The physics behind the cosmicwatch desktop muon detectors. arXiv preprint arXiv:1908.00146.
[3]. Axani, S. N., Frankiewicz, K., & Conrad, J. M. (2018). The CosmicWatch Desktop Muon Detector: a self-contained, pocket sized particle detector. Journal of Instrumentation, 13(03), P03019.
[4]. Axani, S. N., Conrad, J. M., & Kirby, C. (2017). The Desktop Muon Detector: A simple, physics-motivated machine-and electronics-shop project for university students. American Journal of Physics, 85(12), 948-958.
[5]. Grupen, C., Shwartz, B. A., Spieler, H., Eidelman, S., & Stroh, T. (2008). Particle detectors (Vol. 10). Cambridge: Cambridge university press.
[6]. LBNL, S. K. 32. Passage of Particles Through Matter.
[7]. Green, D. (2000). The physics of particle detectors (Vol. 12). Cambridge University Press.
[8]. W. Benenson, J. Harris, H. St¨ocker, and H. Lutz, Handbook of Physics, Handbook of Physics (Springer New York, 2006).
[9]. A. Pla-Dalmau, A. D. Bross, V. V. Rykalin, and B. M. Wood, “Extruded plastic scintil-lator for minerva,” in Nuclear Science Symposium Conference Record, 2005 IEEE, vol. 3, pp. 1298–1300, IEEE, 2005.
[10]. Haight, F. A. (1967). Handbook of the Poisson distribution (No. 519.23 H3).
Cite this article
Lyu,C.;Hu,H.;Hu,C.;Wu,Y. (2023). Research about how lead influence the detection rate of muons and its attenuation coefficient. Theoretical and Natural Science,5,710-719.
Data availability
The datasets used and/or analyzed during the current study will be available from the authors upon reasonable request.
Disclaimer/Publisher's Note
The statements, opinions and data contained in all publications are solely those of the individual author(s) and contributor(s) and not of EWA Publishing and/or the editor(s). EWA Publishing and/or the editor(s) disclaim responsibility for any injury to people or property resulting from any ideas, methods, instructions or products referred to in the content.
About volume
Volume title: Proceedings of the 2nd International Conference on Computing Innovation and Applied Physics (CONF-CIAP 2023)
© 2024 by the author(s). Licensee EWA Publishing, Oxford, UK. This article is an open access article distributed under the terms and
conditions of the Creative Commons Attribution (CC BY) license. Authors who
publish this series agree to the following terms:
1. Authors retain copyright and grant the series right of first publication with the work simultaneously licensed under a Creative Commons
Attribution License that allows others to share the work with an acknowledgment of the work's authorship and initial publication in this
series.
2. Authors are able to enter into separate, additional contractual arrangements for the non-exclusive distribution of the series's published
version of the work (e.g., post it to an institutional repository or publish it in a book), with an acknowledgment of its initial
publication in this series.
3. Authors are permitted and encouraged to post their work online (e.g., in institutional repositories or on their website) prior to and
during the submission process, as it can lead to productive exchanges, as well as earlier and greater citation of published work (See
Open access policy for details).
References
[1]. Griffiths, D. (2020). Introduction to elementary particles. John Wiley & Sons.
[2]. Axani, S. N. (2019). The physics behind the cosmicwatch desktop muon detectors. arXiv preprint arXiv:1908.00146.
[3]. Axani, S. N., Frankiewicz, K., & Conrad, J. M. (2018). The CosmicWatch Desktop Muon Detector: a self-contained, pocket sized particle detector. Journal of Instrumentation, 13(03), P03019.
[4]. Axani, S. N., Conrad, J. M., & Kirby, C. (2017). The Desktop Muon Detector: A simple, physics-motivated machine-and electronics-shop project for university students. American Journal of Physics, 85(12), 948-958.
[5]. Grupen, C., Shwartz, B. A., Spieler, H., Eidelman, S., & Stroh, T. (2008). Particle detectors (Vol. 10). Cambridge: Cambridge university press.
[6]. LBNL, S. K. 32. Passage of Particles Through Matter.
[7]. Green, D. (2000). The physics of particle detectors (Vol. 12). Cambridge University Press.
[8]. W. Benenson, J. Harris, H. St¨ocker, and H. Lutz, Handbook of Physics, Handbook of Physics (Springer New York, 2006).
[9]. A. Pla-Dalmau, A. D. Bross, V. V. Rykalin, and B. M. Wood, “Extruded plastic scintil-lator for minerva,” in Nuclear Science Symposium Conference Record, 2005 IEEE, vol. 3, pp. 1298–1300, IEEE, 2005.
[10]. Haight, F. A. (1967). Handbook of the Poisson distribution (No. 519.23 H3).