


1. Introduction
Glioblastoma (GBM) is the most highly malignant primary human brain tumor with very low survival (median overall survival of 12-15 months). This poor clinical scenario is mainly due to the high heterogeneity and therapeutic resistance of GBM. The current histopathological diagnosis of GBM is largely dependent on morphological observation, which is incapable of accurately quantifying the complicated cell composition in GBM and cannot be revealed the whole process of tumorigenesis and progression of GBM. Although previous molecular classifications based on The Cancer Genome Atlas help us gain some insights, the signals obtained from bulk sequencing are average signals of cell populations, which blur the differences among various cellular subclones.
In the past few years, the development of single-cell RNA sequencing(scRNA-seq)technology has offered a powerful tool to explore GBM cellular heterogeneity at single-cell level. However, it is still a big computational challenge to accurately and efficiently identify the malignant cell from scRNA-seq data, which includes various cell types and then further evaluate the tumor purity. The inaccurate assessment of tumor purity will directly cause biases of downstream genomic and transcriptomic analysis, which will further affect the analysis of driver genes and core signaling pathways [1, 2].
Therefore, this study aims to build a computational workflow to integrate scRNA-seq data and machine learning method to solve the challenge of accurate malignant cell identification in GBM. Firstly, this paper introduces the GBM heterogeneity and scRNA-seq technology; Secondly, the construction process of two machine learning models(XGBoost and Multilayer Perceptron)based on signature genes are described; Finally, the excellent performance of different models in malignant cell discrimination and its application value in improving the accuracy of GBM molecular subtyping and enhancing the reliability of tumor purity assessment are discussed.
2. Literature review
The heterogeneity of GBM is the primary reason for its treatment failure and recurrence. At the histological level, a single tumor often contains multiple cellular subpopulations with different differentiation states, such as astrocyte-like and mesenchymal-like cells [3-5]. This introduces subjective variability in morphology-based assessments of malignancy. Molecularly, The Cancer Genome Atlas (TCGA) consortium has established four principal molecular subtypes of GBM (classical, mesenchymal, proneural, and neural), each possessing distinct gene expression profiles and clinical outcomes. Alterations in key driver genes such as IDH1, TERT, EGFR, and PTEN collectively constitute the complex molecular landscape of GBM [6-10]. However, bulk sequencing studies have revealed that these molecular alterations are often distributed unevenly across different regions of the tumor, creating spatial heterogeneity that limits the accuracy of molecular subtyping based on a single sample.
scRNA-seq technology, by capturing the entire mRNA content of individual cells, enables comprehensive mapping of the cellular atlas within the tumor microenvironment. This technique allows for the systematic discrimination of all components, including tumor cells, immune cells, and stromal cells, thereby overcoming the limitations of traditional methods. In GBM research, scRNA-seq has been successfully applied to reveal novel cellular subpopulations within tumors, track cell state transition trajectories, and elucidate mechanisms of therapy resistance. Collectively, these studies underscore the significant potential of scRNA-seq in identifying rare but critical malignant cell subclones [11].
Accurate identification of malignant cells is a fundamental step in scRNA-seq data analysis and a prerequisite for assessing tumor purity. The level of tumor purity directly impacts the reliability of molecular biology studies: in low-purity samples, signals from non-malignant cells can dilute the true characteristics of malignant cells, leading to misinterpretation of driver events. At the clinical level, tumor purity is closely associated with immune microenvironment features, treatment response, and patient prognosis. Therefore, developing computational methods capable of automatically and precisely identifying malignant cells from single-cell data is a crucial link in bridging high-dimensional omics data with biological insights [12].
Although existing studies have utilized scRNA-seq to explore GBM heterogeneity, a robust computational workflow specifically optimized for malignant cell identification remains to be fully developed. This study aims to address this gap by integrating differential expression analysis with efficient machine learning models (XGBoost and MLP) to construct a lightweight, high-precision malignant cell classifier, thereby providing a reliable tool for malignant cell identification in GBM research.
3. Methodology
Network inference from single-cell sequencing data was performed in the following four steps. First, quality control and normalization for single-cell sequencing data were performed. Second, an independent samples t-test was used to select 30 most differentially expressed genes as features. Third, XGBoost and multilayer perceptron (MLP) model were trained with selected features. At last, the validity of analytical results was validated by multidimensional evaluation metrics.
3.1. Dataset description and preprocessing
The dataset used in this study was downloaded directly from GBM data published by Courturier et al [13]. The original single-cell RNA-Seq sequencing data was generated from GBM tumor samples.
In the data preprocessing procedure, this study adopted three main steps for cells and samples filtering, cell filtering for invalid cell data removal, and data standardization for genes expression levels normalization. All these steps ensured the reliability of the subsequent results. And then the data was divided into training set and test set according to the standard machine learning process. 80% were randomly reserved as training set, and the rest 20% as test set.
3.2. Data feature filtering
Feature selection by statistical testing is an indispensable procedure in building accurate classification models for this training. In order to discover gene features with statistically significant expression differences between malignant and non-malignant cells, we systematically conducted differential analysis on the whole-genome expression data.
This study uses the independent samples t-test. For each gene, the expression level of each gene in malignant and non-malignant cell data is compared to each other. The t statistic and corresponding p value is obtained.
Sort the statistical significance, and take the 30 smallest p value genes as the feature set for the following machine learning model construction. These 30 genes have the strongest expression differences between malignant and non-malignant cells and are the most discriminative biomarkers.
The final feature matrix is (n_cells, 30). Each row represents a cell sample and each column represents a differentially expressed gene. The selected feature set is meaningful from a biological perspective and has statistical significance.
3.3. XGBoost model
This study uses the XGBoost algorithm to build the malignant cell classifier. XGBoost is an ensemble learning method based on the gradient boosting framework. It builds models in a sequential manner, learning a sequence of decision trees. Each new tree provides predictions that minimize the residuals of the previous trees. Finally, a strong classifier is obtained by weighted summation.
In terms of parameter configuration, we use 400 decision trees to serve the balance between control and enough complexity. The learning rate is set to 0.05 to serve the balance between single tree performance and enough convergence. The maximum depth of each tree is set to 4 layers to avoid over fitting. The log loss function is chosen as the evaluation metric. And the random seed is fixed to 42 to make the experiment reproducible.
3.4. Multilayer perceptron (MLP)
The multilayer perceptron constructed in this study is a fully connected feedforward neural network designed to learn complicated nonlinear mapping relationships between gene expression features and cellular malignancy states.
The network architecture uses a deep design of two hidden layers with 128 and 64 neurons respectively. This layer-wise compressed feature representation structure helps to learn more compressed and abstract features. The hidden layers use the ReLU activation function. ReLU can introduce nonlinear mapping relationship while avoiding the vanishing gradient problem. The output layer uses the Sigmoid activation function. The output range of Sigmoid is [0,1], which could be interpreted as the probability value of the predicted cell being malignant.
For the model, we use the Adam optimization algorithm (Kingma & LeCun, 2014) with an initial learning rate of 0.001 (decreases the "step size" adaptively on parameters). As loss function, we use cross-entropy and decrease it via backpropagation. To reduce overfitting, we implement multiple forms of regularization, namely L2 weight decay, early stopping, and loss increase on validation set. The maximum number of epochs during training is 300. The training process is stopped if loss on the validation set does not decrease anymore for more than 5 epochs consecutive times (meaning the model stops learning at the point of best generalization).
Both models use exactly the same input (same 30 differentially expression genes detected by t-tests), and exactly the same standardized data. Training and testing are done under exactly the same training-test splits (80%-20%), hence the models can be compared fairly and reliably.
3.5. Model evaluation strategies
We designed a detailed model evaluation framework to evaluate models in two levels: graphical analysis and quantitative metrics.
In graphical analysis, we adopted three kinds of visualization strategies: First, ROC curves visualize the model performance on all the classification thresholds. And the AUC is derived from the ROC curves as an overall metric of classification performance; Second, confusion matrices visualize the mapping relationship between predicted results and true labels and it is obvious that true positive, true negative, false positive and false negative account for what proportions of all the samples. Finally, probability distribution plots visualize the training process of cell type labels’ probability output from the model and then analyze the classification certainty and rationality of the model’s decision boundary. In addition, we adopted three kinds of evaluation indicators based on confusion matrix: accuracy represents the overall correctness of the classifier, recall (sensitivity) represents the model’s ability to correctly classifies malignant cell, specificity represents the model’s ability to correctly classifies non-malignant cell. These three kinds of evaluation indicators construct an objective and comprehensive evaluation standard to reflect the performance of the model.
All the evaluations are adopted on the strictly separated test set. The results obtained by this method provide a reliable basis for model comparison.
4. Results
4.1. Data preprocessing screens for malignant cell-related genes
After quality control and standardization, the final data set of high-quality single-cell transcriptomic data remains. In the final data matrix, each row represents a gene and each column represents a cell. The values in the data matrix represent gene expression (higher values more expression, 0 no detected expression). This data set contains 5000 genes and 40026 cells. Cells were labeled malignant (annotated malignant cells, n=17403) or non-malignant (tumor-adjacent brain cells, n=14705 and brain cells from healthy donors, N=7918). Relevant features were selected, meaning a subset of gene features was extracted that were most strongly associated with GBM malignant cells, upon which the modeling was built.
4.2. ROC curve reflects the performance of sample classification under different decision thresholds
The ROC curve results for the two models are shown in Figure 1.

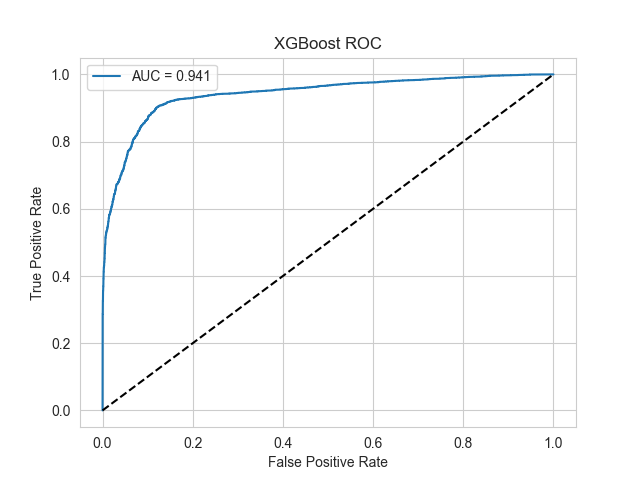
Figure 1. ROC curve of two models
Results show that two machine learning models constructed in this study have excellent discriminative performance in malignant glioblastoma cells classification.
The ROC curve area under curve (AUC) of Multi-Layer Perceptron (MLP) model was 0.937. This model ranked randomly selected malignant cells ahead of non-malignant cells with the probability of 93.7%. The ROC curve was convex-shaped and rapidly increased in the low false positive rate range. Meanwhile, the model could maintain high specificity while presenting good sensitivity.
A slightly better AUC of 0.941 was reached by XGBoost model, which achieved the best classification performance in this study. The ROC curve of XGBoost model was close to the ideal upper-left corner in the entire range of thresholds, which means the balance between sensitivity (ability to positively predict malignant cells) and specificity (ability to negatively predict non-malignant cells) of this model was well maintained in the entire range of thresholds.
Two models reached an AUC value greater than 0.93, which was noticeably higher than the AUC=0.5 of randomly selecting classifiers. The effectiveness and reliability of machine learning models constructed based on differentially expressed genes to predict malignant cells have been proved in this study, which provide solid theoretical basis for its clinical application.
4.3. Confusion matrix evaluates multidimensional discrimination performance in models
The confusion matrix results for the two models are presented in Figure 2.
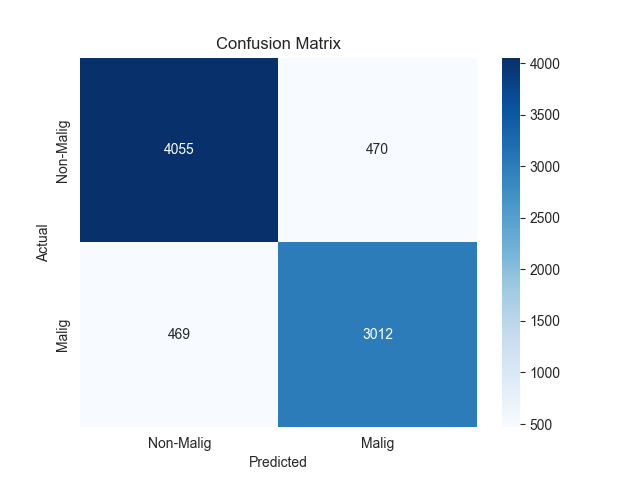

Figure 2. Confusion matrix of two models
In addition to confusion matrix analysis, we further analyze the two models’ multidimensional discrimination performance. As shown in confusion matrix, XGBoost and MLP have strong discriminative ability in binary classification of malignant glioblastoma cells.
The confusion matrix of MLP model demonstrated that 4055 non-malignant cells were correctly predicted as negative (TN, negative judgment of non-malignant cells) and 3012 malignant cells were correctly predicted as positive (TP, positive judgment of malignant cells), while there were 470 FP and 469 FN. Based on the confusion matrix data, the final accuracy of the model was 88.3%, which can be used as a reliable classification capability. In terms of specificity, the model can correctly identify negative samples, which is 89.6%. In addition, when the sensitivity is 86.5%, the model can effectively identify positive samples.
The confusion matrix of XGBoost model demonstrated that 4089 negative samples and 3066 positive samples were correctly predicted, while there were 447 FP and 406 FN. Compared with the FN of other models, XGBoost reduced FN by 63. Since there is a clinically significant number of missed malignant cells, the risk of missing is reduced. Overall, the comprehensive analysis shows that XGBoost has a better-balanced performance in accuracy, specificity and sensitivity, especially the obvious advantage in reducing the risk of missing.
4.4. Prediction probability distributions evaluate model confidence and decision boundaries
The probability prediction distributions of the two models are shown in Figure 3.


Figure 3. Predicted probability distribution of two models
In addition to probability prediction distribution analysis, we further analyze the two models’ multidimensional classification performance. It can be seen from the probability prediction distribution that the neural network (MLP) and XGBoost have different feature patterns in the probability distribution.
The probability distribution of MLP model showed that the probability density curve of malignant and non-malignant cell was significantly overlapped in the probability interval of 0.2–0.8. The probability density curve of non-malignant cell (blue curve) spread in the low probability range (0–0.4). The probability density curve of malignant cell (orange curve) spread in the high probability range (0.6–1.0). The feature pattern of probability distribution showed that the MLP model adopted a relatively conservative method in the classification decision. For some borderline samples, the MLP model showed a low confidence of prediction results. This also reflected that the MLP model displayed a relatively cautious attitude in handling complex feature patterns.
From the probability distribution, we can find that the probability distribution of the XGBoost model is more reasonable. The density probability of the non-malignant cell is concentrated in the low probability range of 0–0.2 and presents a sharp peak distribution. While the density probability of the malignant cell is concentrated in the high probability range of 0.8–1.0. The intersection of two distribution curves is greatly reduced compared with those of MLP model, and the density probability in the intermediate probability range is greatly reduced. The distribution of the two distribution curves reflects that the XGBoost model has clearer boundary and higher classification confidence. The XGBoost model can definitely place the samples in the corresponding categories with higher confidence.
The above probability distribution is highly consistent with the confusion matrix. The more concentrated probability distribution of the XGBoost model explains why the XGBoost model has advantages in accuracy, sensitivity, and specificity. And the more dispersed probability distribution of MLP model explains why the MLP model has higher false positive and false negative.
4.5. Comprehensive evaluation based on performance metrics
Analysis based on evaluation metrics in comprehensive performance as shown in Table 1 and Table 2, multilayer perceptron and XGBoost models have excellent classification ability in the field of malignant glioblastoma cells classification.
|
precision |
recall |
f1-score |
|
|
Non-Malignant |
0.90 |
0.90 |
0.90 |
|
Malignant |
0.87 |
0.87 |
0.87 |
|
accuracy |
0.88 |
||
|
Sensitivity |
0.8653 |
||
|
Specificity |
0.8961 |
||
|
AUC |
0.9371 |
||
|
precision |
recall |
f1-score |
|
|
Non-Malignant |
0.90 |
0.90 |
0.90 |
|
Malignant |
0.87 |
0.87 |
0.87 |
|
accuracy |
0.89 |
||
|
Sensitivity |
0.8716 |
||
|
Specificity |
0.8992 |
||
|
AUC |
0.9411 |
||
The Multi-Layer Perceptron model shows the power of deep learning method in multiple aspects of evaluation. With the overall accuracy of 0.88, balanced precision, recall and F1 results, we can find that the model can maintain the ability to capture complex feature patterns in the single-cell data. Model AUC value of 0.9371 also validate the reliability of the model in the category of cells. In addition, the model sensitivity of 0.8653 and specificity of 0.8961 also show that the model has the ability to malignant cells and exclude non-malignant cells.
XGBoost model in this paper has a lot of merits. The accuracy of 0.89 coupled with an AUC value of 0.9411 shows that ensemble learning method can be used to process genomic data. The specificity of 0.8992 while maintaining sensitivity of 0.8716. Model has an advantage in the different types of classification errors. Most importantly, the models have a strong consistency in predicting the malignant and non-malignant categories. This is an important characteristic of biomedical application.
In terms of technical strength, each model has its own advantages. Multi-Layer Perceptron use its deep network to handle high-dimensional nonlinear data. Ensemble learning used by XGBoost has advantages in feature interaction and generalization ability. The technical characteristics of these two models provide strong technical support for single-cell data analysis.
The results show that, based on the selected gene features, machine learning based on selected gene features can build an efficient classification model, and provide a reliable computational biology tool for the precise diagnosis of glioblastoma. The results of this study not only demonstrate the application value of machine learning method in biomedical data mining, but also provide different technical paths for further research.
5. Discussion
This study successfully constructed and validated a machine learning workflow based on single-cell transcriptomic data for the precise identification of malignant cells in glioblastoma. We used independent sample t-tests to select 30 gene features with discriminative abilities as features. Based on these features, we used two classifiers (XGBoost and multilayer perceptron (MLP)) for classification. Results show that both models exhibit outstanding classification performance. The AUC values achieved were >0.93 and accuracy was close to 89%, confirming the strong predictive capability of the selected gene feature combination and the high applicability of machine learning methods for this problem. Crucially, this computational workflow provides a reliable tool for objectively assessing tumor purity and shows clear application potential at the interface of computational science and precision medicine.
However, there are still the following limitations. First, the model training and validation were based on one single-source single-cell sequencing dataset. The sample representativeness might be limited, and the model might not be generalized to cover all molecular subtypes and population variations of glioblastoma, which may impact the external validity of our results. Second, there may exist certain confounding factors in downstream analysis due to unavoidable technical biases of single-cell sequencing, such as cell capture efficiency and gene detection count variation. Third, although our model can achieve high classification accuracy, its black box decision process limits the understanding of biological mechanisms, which in turn limits its direct application to discover novel biology.
In the future, we would like to focus on the following research directions: First, to improve model interpretability by designing biology-guided machine learning models, where known cancer pathway knowledge is embedded into algorithm design to enhance the result credibility and biological relevance. Second, to explore the possibility of leveraging massive unlabeled data to construct pre-trained foundation models to further improve robustness and generalization ability to finally promote clinical translation [14-15].
6. Conclusion
This study successfully built a machine learning workflow based on single-cell RNA sequencing data, which could be used to accurately identify the malignant cell in glioblastoma. And, thirty differentially expressed genes screened in an unbiased way displayed strong discriminative ability for the malignant cell state.
Our results demonstrated that the XGBoost model, built on the boosting method, had remarkable overall performance in malignant cell classification, and the AUC was as high as 0.941, meanwhile the model had a relatively good balance between sensitivity (0.883) and specificity (0.901). Meanwhile, the nonlinear feature learning ability of Multi-Layer Perceptron (MLP) model was very strong, and the AUC was 0.937, which proved that the deep learning method could be used in such biomedical data [16].
The computational workflow established in this study could not only be used to accurately identify the malignant cell, but more importantly, it could provide us a reliable computational biology method to assess tumor purity. And this method could overcome the limitation of using traditional histopathology to distinguish mixed cell population, and provide technical basis to explore glioblastoma heterogeneity in depth. Meanwhile, the research has demonstrated the huge potential of cross-disciplinary integration between computational science and life science in solving complex biomedical problems, and it also provided new technical routes to promote precision diagnosis and optimal therapy.
References
[1]. Mao, X. G. (2024). Understanding glioblastoma at the single-cell level: Latest progress and future challenges [J]. Chinese Journal of Neurosurgical Disease Research, 18(05), 21.
[2]. Zhao, H. H., Zhang, Z. Y., Yu, X. X., et al. (2025). Progress of single-cell RNA sequencing in cancer research [J]. Journal of Lanzhou University (Medical Sciences), 51(06), 79-86+94. https: //doi.org/10.13885/j.issn.2097-681X.2025.06.011.
[3]. Wang, J., & Su, W. (2022). Development history and research progress of related molecules in glioblastoma [J]. Journal of Practical Medical Techniques, 29(12), 1237-1240. https: //doi.org/10.19522/j.cnki.1671-5098.2022.12.001.
[4]. Sun, Y., Jin, W., Ni, H. B., et al. (2025). Research progress on the molecular mechanism of glucose metabolism in glioblastoma and its targeted therapy [J]. Journal of Clinical Neurosurgery, 22(05), 594-600.
[5]. Tian, L. Y., Cheng, C. D., Qian, Z. R., et al. (2024). Analysis of clinical and molecular pathological features and prognostic factors of primary glioblastoma [J]. Journal of Clinical Neurosurgery, 21(03), 292-297.
[6]. Zhang, H. B. (2024). A study on predicting TERT promoter mutation in glioblastoma based on multi-parameter MRI deep learning [D]. Southern Medical University. https: //doi.org/10.27003/d.cnki.gojyu.2024.000165.
[7]. Wang, G., Zhao, J. J., Nuerbiyaemu·Abulikemu, et al. (2022). Study on the effectiveness of subregional MRI radiomics combined with classification algorithms in predicting MGMT methylation in glioblastoma [J]. Journal of Clinical Radiology, 41(07), 1222-1226. https: //doi.org/10.13437/j.cnki.jcr.2022.07.034.
[8]. Lv, C., Xia, L. F., Chen, Q. S., et al. (2025). Predicting MGMT promoter methylation status in glioblastoma using deep neural network MRI radiomics [J]. Magnetic Resonance Imaging, 16(10), 35-40.
[9]. Li, Q., Dong, F., Jiang, B., et al. (2019). A study on the optimization of glioblastoma EGFR gene amplification classification model based on radiomics [C]// Zhejiang Medical Association, Radiology Branch of Zhejiang Medical Association. Proceedings of the 2019 Academic Congress of Radiology of Zhejiang Medical Association. The Second Affiliated Hospital of Zhejiang University School of Medicine, 2019: 34. https: //doi.org/10.26914/c.cnkihy.2019.101392.
[10]. Ren, L., Wei, Z. L., Qiu, Y. M., et al. (2015). Expression of ID1 in three glioblastoma cell lines and its significance [J]. Journal of Clinical Medicine in Practice, 19(09), 62-64.
[11]. Song, P., Deng, H., & Zhang, M. X. (2024). Application of single-cell RNA sequencing technology in glioblastoma research [J]. Journal of Huazhong University of Science and Technology (Medical Sciences), 53(01), 110-116.
[12]. Deng, H., Guo, W. J., Song, P., et al. (2023). Construction of a prognostic model for glioblastoma based on single-cell sequencing [J]. Biotechnology, 33(01), 38-47. https: //doi.org/10.16519/j.cnki.1004-311x.2023.01.0007.
[13]. Couturier, C.P., Ayyadhury, S., Le, P.U. et al. Single-cell RNA-seq reveals that glioblastoma recapitulates a normal neurodevelopmental hierarchy. Nat Commun 11, 3406 (2020). https: //doi.org/10.1038/s41467-020-17186-5
[14]. Zhang, Y. Z. (2024). A study on differentiating glioblastoma from solitary brain metastases based on radiomics and deep learning [D]. Southern Medical University. https: //doi.org/10.27003/d.cnki.gojyu.2024.000735.
[15]. an, J., Sun, Q., Tan, X., et al. (2023). Imaging-based deep learning identifies glioblastoma risk stratification with genomic and transcriptomic heterogeneity: A multicenter study [J]. International Journal of Medical Radiology, 46(02), 244-245. https: //doi.org/10.19300/j.2023.e0204.
[16]. Zheng, F., & Chen, X. Z. (2022). Research progress of deep learning in glioblastoma [J]. Magnetic Resonance Imaging, 13(03), 115-117.
Cite this article
Liang,S. (2025). Machine Learning-Based Classification of Malignant Glioblastoma Cells with Single-Cell RNA-Seq. Theoretical and Natural Science,152,1-10.
Data availability
The datasets used and/or analyzed during the current study will be available from the authors upon reasonable request.
Disclaimer/Publisher's Note
The statements, opinions and data contained in all publications are solely those of the individual author(s) and contributor(s) and not of EWA Publishing and/or the editor(s). EWA Publishing and/or the editor(s) disclaim responsibility for any injury to people or property resulting from any ideas, methods, instructions or products referred to in the content.
About volume
Volume title: Proceedings of ICMMGH 2026 Symposium: Biomedical Imaging and AI Applications in Neurorehabilitation
© 2024 by the author(s). Licensee EWA Publishing, Oxford, UK. This article is an open access article distributed under the terms and
conditions of the Creative Commons Attribution (CC BY) license. Authors who
publish this series agree to the following terms:
1. Authors retain copyright and grant the series right of first publication with the work simultaneously licensed under a Creative Commons
Attribution License that allows others to share the work with an acknowledgment of the work's authorship and initial publication in this
series.
2. Authors are able to enter into separate, additional contractual arrangements for the non-exclusive distribution of the series's published
version of the work (e.g., post it to an institutional repository or publish it in a book), with an acknowledgment of its initial
publication in this series.
3. Authors are permitted and encouraged to post their work online (e.g., in institutional repositories or on their website) prior to and
during the submission process, as it can lead to productive exchanges, as well as earlier and greater citation of published work (See
Open access policy for details).
References
[1]. Mao, X. G. (2024). Understanding glioblastoma at the single-cell level: Latest progress and future challenges [J]. Chinese Journal of Neurosurgical Disease Research, 18(05), 21.
[2]. Zhao, H. H., Zhang, Z. Y., Yu, X. X., et al. (2025). Progress of single-cell RNA sequencing in cancer research [J]. Journal of Lanzhou University (Medical Sciences), 51(06), 79-86+94. https: //doi.org/10.13885/j.issn.2097-681X.2025.06.011.
[3]. Wang, J., & Su, W. (2022). Development history and research progress of related molecules in glioblastoma [J]. Journal of Practical Medical Techniques, 29(12), 1237-1240. https: //doi.org/10.19522/j.cnki.1671-5098.2022.12.001.
[4]. Sun, Y., Jin, W., Ni, H. B., et al. (2025). Research progress on the molecular mechanism of glucose metabolism in glioblastoma and its targeted therapy [J]. Journal of Clinical Neurosurgery, 22(05), 594-600.
[5]. Tian, L. Y., Cheng, C. D., Qian, Z. R., et al. (2024). Analysis of clinical and molecular pathological features and prognostic factors of primary glioblastoma [J]. Journal of Clinical Neurosurgery, 21(03), 292-297.
[6]. Zhang, H. B. (2024). A study on predicting TERT promoter mutation in glioblastoma based on multi-parameter MRI deep learning [D]. Southern Medical University. https: //doi.org/10.27003/d.cnki.gojyu.2024.000165.
[7]. Wang, G., Zhao, J. J., Nuerbiyaemu·Abulikemu, et al. (2022). Study on the effectiveness of subregional MRI radiomics combined with classification algorithms in predicting MGMT methylation in glioblastoma [J]. Journal of Clinical Radiology, 41(07), 1222-1226. https: //doi.org/10.13437/j.cnki.jcr.2022.07.034.
[8]. Lv, C., Xia, L. F., Chen, Q. S., et al. (2025). Predicting MGMT promoter methylation status in glioblastoma using deep neural network MRI radiomics [J]. Magnetic Resonance Imaging, 16(10), 35-40.
[9]. Li, Q., Dong, F., Jiang, B., et al. (2019). A study on the optimization of glioblastoma EGFR gene amplification classification model based on radiomics [C]// Zhejiang Medical Association, Radiology Branch of Zhejiang Medical Association. Proceedings of the 2019 Academic Congress of Radiology of Zhejiang Medical Association. The Second Affiliated Hospital of Zhejiang University School of Medicine, 2019: 34. https: //doi.org/10.26914/c.cnkihy.2019.101392.
[10]. Ren, L., Wei, Z. L., Qiu, Y. M., et al. (2015). Expression of ID1 in three glioblastoma cell lines and its significance [J]. Journal of Clinical Medicine in Practice, 19(09), 62-64.
[11]. Song, P., Deng, H., & Zhang, M. X. (2024). Application of single-cell RNA sequencing technology in glioblastoma research [J]. Journal of Huazhong University of Science and Technology (Medical Sciences), 53(01), 110-116.
[12]. Deng, H., Guo, W. J., Song, P., et al. (2023). Construction of a prognostic model for glioblastoma based on single-cell sequencing [J]. Biotechnology, 33(01), 38-47. https: //doi.org/10.16519/j.cnki.1004-311x.2023.01.0007.
[13]. Couturier, C.P., Ayyadhury, S., Le, P.U. et al. Single-cell RNA-seq reveals that glioblastoma recapitulates a normal neurodevelopmental hierarchy. Nat Commun 11, 3406 (2020). https: //doi.org/10.1038/s41467-020-17186-5
[14]. Zhang, Y. Z. (2024). A study on differentiating glioblastoma from solitary brain metastases based on radiomics and deep learning [D]. Southern Medical University. https: //doi.org/10.27003/d.cnki.gojyu.2024.000735.
[15]. an, J., Sun, Q., Tan, X., et al. (2023). Imaging-based deep learning identifies glioblastoma risk stratification with genomic and transcriptomic heterogeneity: A multicenter study [J]. International Journal of Medical Radiology, 46(02), 244-245. https: //doi.org/10.19300/j.2023.e0204.
[16]. Zheng, F., & Chen, X. Z. (2022). Research progress of deep learning in glioblastoma [J]. Magnetic Resonance Imaging, 13(03), 115-117.