


1. Introduction
Over 40% of American people suffer from obesity, making it a serious public health concern [1]. Chronic illnesses like type 2 diabetes, heart disease, and several types of cancer are exacerbated by it [2]. In addition to diet and physical activity, sleep has emerged as a potentially important behavioral determinant of obesity [3]. Reduced energy expenditure, increased hunger, and metabolic dysregulation have all been related to short sleep duration [4]. While numerous studies have reported associations between insufficient sleep and obesity, fewer have examined long sleep duration, with mixed findings regarding its relationship with adiposity [5]. Given changing sleep patterns in modern societies, investigating the sleep–obesity relationship remains a timely public health priority. By demonstrating a clear association between sleep duration and the risk of overweight in the US adult population, this article provides evidence to support the integration of sleep health promotion into existing obesity prevention and health management efforts. This study also guides future research directions by emphasizing the need to advance the mechanistic understanding of how sleep duration contributes to the development of obesity.
2. Methodology
2.1. Data source
The National Health and Nutrition Examination Survey (NHANES) is a program of studies conducted by the National Center for Health Statistics (NCHS) designed to assess the health and nutritional status of adults and children in the United States. NHANES combines interviews and physical examinations and employs a complex, multistage probability sampling design to ensure national representativeness [6]. For this analysis, we used data from the 2021–2023 cycle.
2.2. Measures
Self-report data on length of sleep was collected using the questionnaire item SLD012, "Estimate your usual nightly duration of sleep on workdays." Responses were recorded in hours. Sleep durations were classified as short (less than six hours), normal (6–8 hours), and long (more than eight hours).
Height and weight measurements from the Body Measures Examination (BMX) were used to compute the body mass index (BMI). A BMI equal or exceed 30 kg/m² was deemed obese. RIDRETH3 categories were used to alter for age as a continuous measure, sex (male/female), and race/ethnicity.
2.3. Statistical analysis
Descriptive analyses were conducted to estimate mean BMI and Obesity prevalence across sleep duration categories. The chi-square test was used to analyze differences between groups. The odds ratio (OR) for obesity across different sleep durations and its 95% confidence interval were calculated using a logistic regression model that controlled for factors such as age, gender, and race/ethnicity. Analyses were conducted using Python 3.11 with pandas, stats models, and SciPy libraries. Sampling weights were not applied in this preliminary analysis; however, NHANES recommends the use of weights in population-level inference.
2.4. Results
In first table, Participants sleeping less than 6 hours had the highest mean BMI and obesity prevalence, whereas those sleeping more than 8 hours had the lowest obesity prevalence. Chi-square tests confirmed significant variation in obesity prevalence across sleep categories (χ²=25.16, p<0.001). Logistic regression results (Table 3) indicate that, relative to 6–8-hour sleepers, short sleepers had 33% higher odds of obesity. Long sleepers did not differ significantly from normal sleepers. Figure 1 illustrates obesity prevalence by sleep category.
|
SLEEP_CAT |
N |
Mean_BMI |
Obesity_Rate |
|
<6h |
1000 |
30.6 |
0.466 |
|
6–8h |
3322 |
29.327 |
0.387 |
|
>8h |
2129 |
29.156 |
0.376 |
N, mean BMI, and obesity prevalence across sleep categories (see attached Excel for details).
Note: N = weighted sample size; BMI in kg/m²; obesity defined as BMI ≥30
Table 1 summarizes the descriptive statistics across sleep duration categories. Participants sleeping fewer than 6 hours had the highest mean BMI (30.6 kg/m²) and the highest obesity prevalence (46.6%). In comparison, those sleeping 6–8 hours and more than 8 hours had lower mean BMIs and lower obesity prevalence rates.
|
Sleep Category |
Non-obese |
Obese |
|
<6h |
534 |
466 |
|
6–8h |
2035 |
1287 |
|
>8h |
1329 |
800 |
Chi-square test: χ²=25.16, df=2, p<0.0001
Cross-tabulation of sleep duration by obesity status
Table 2 presents obesity status across different sleep duration categories. Individuals who reported sleeping fewer than 6 hours showed the greatest proportion of obesity, followed by those with 6–8 hours of sleep and those exceeding 8 hours. Chi-square analysis indicates that differences in obesity rates among sleep duration groups are not evenly distributed, with the highest obesity rate observed among short sleepers.
|
term |
coef |
OR |
CI_low |
CI_high |
p_value |
|
Intercept |
-0.428 |
0.652 |
0.521 |
0.814 |
0.0 |
|
C(SLEEP_CAT) [T.<6h] |
0.282 |
1.326 |
1.145 |
1.535 |
0.0 |
|
C(SLEEP_CAT) [T.>8h] |
-0.095 |
0.909 |
0.811 |
1.019 |
0.102 |
|
C(SEX)[T.Male] |
-0.229 |
0.795 |
0.717 |
0.881 |
0.0 |
|
C(RACE) [T.2] |
-0.378 |
0.685 |
0.54 |
0.87 |
0.002 |
|
C(RACE) [T.3] |
-0.345 |
0.709 |
0.583 |
0.861 |
0.001 |
|
C(RACE) [T.4] |
0.087 |
1.091 |
0.867 |
1.372 |
0.458 |
|
C(RACE) [T.6] |
-1.79 |
0.167 |
0.117 |
0.238 |
0.0 |
|
C(RACE) [T.7] |
-0.272 |
0.762 |
0.584 |
0.995 |
0.046 |
|
RIDAGEYR |
0.008 |
1.008 |
1.005 |
1.011 |
0.0 |
Odds ratios for obesity by sleep duration, age period, sex, race and ethnicity.
Table 3 presents the modified odds ratios for obesity by sleep duration. Short sleepers remained more prone to obesity than adults sleeping 6–8 hours, even with demographic controls applied. Conversely, there was no meaningful association between sleeping more than 8 hours and obesity.
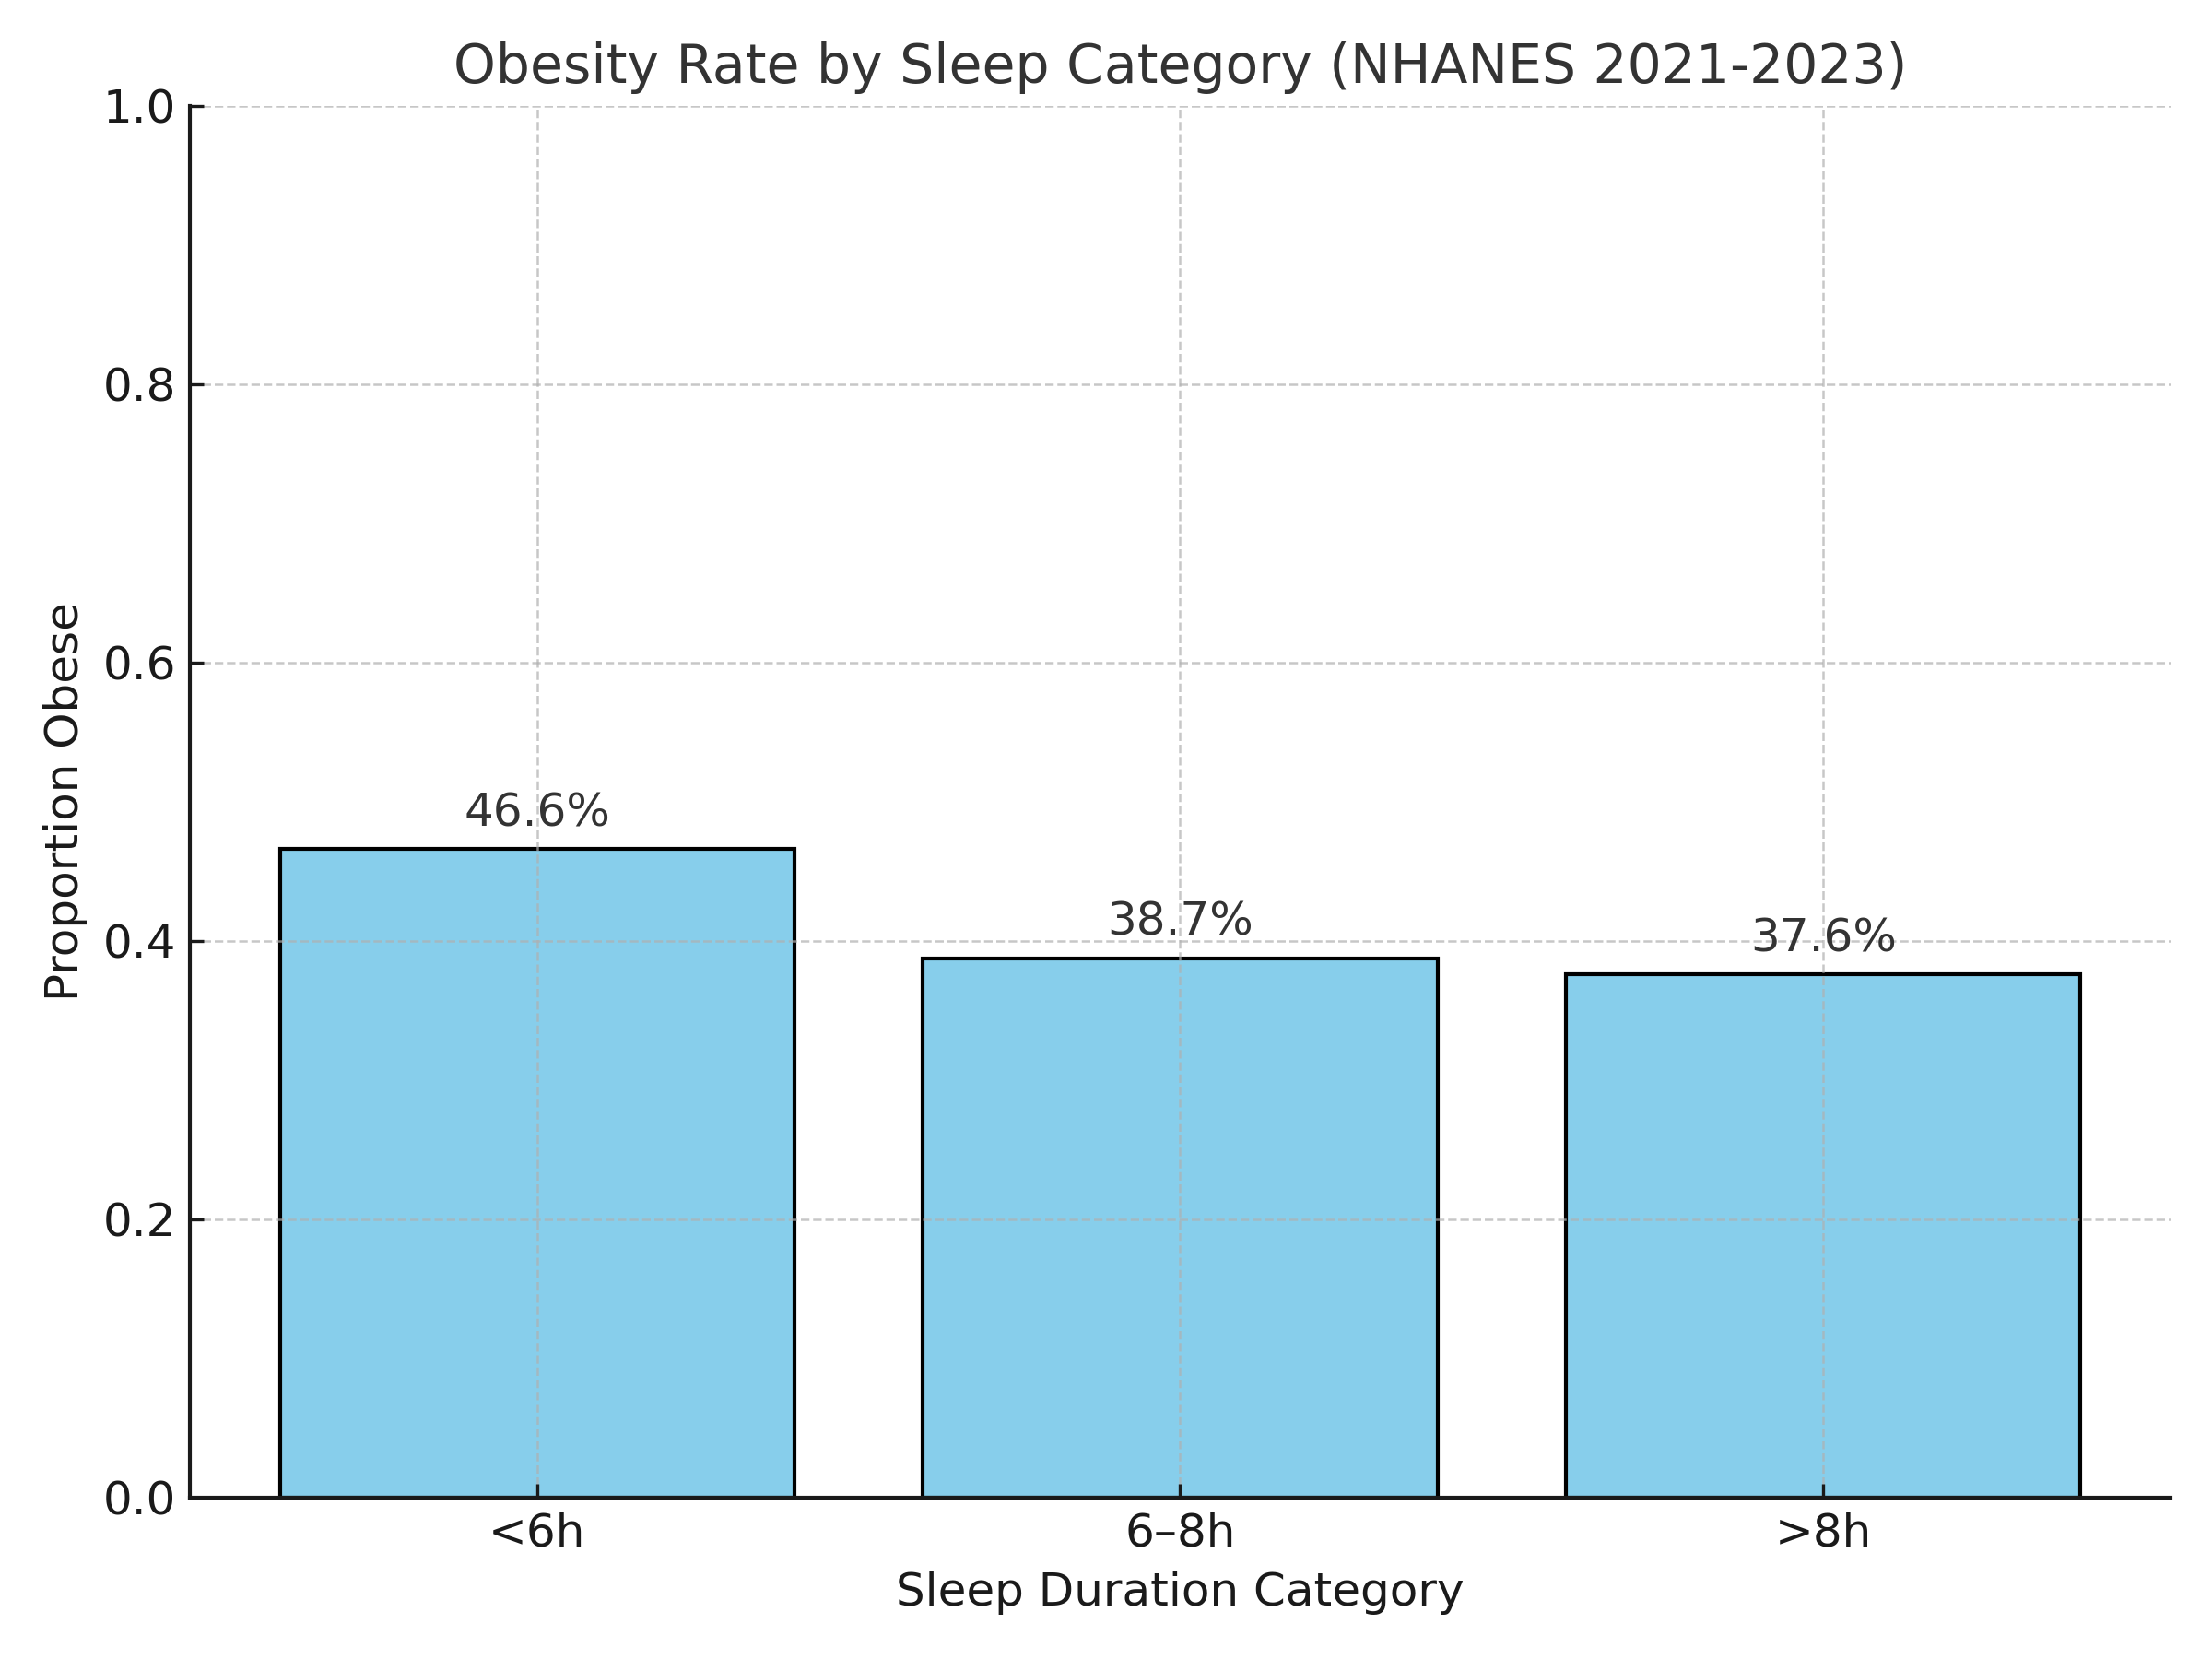
Bar chart showing obesity prevalence (%) by sleep duration categories. Figure 1 displays the proportion of obesity across three sleep duration categories. The prevalence of obesity is highest in the <6 h group, with lower and relatively similar rates observed in the 6–8 h and >8 h groups. The visual trend indicates that shorter sleep duration is associated with a higher likelihood of obesity among U.S. adults.
3. Discussion
The study provides contemporary evidence linking short sleep duration with increased obesity risk among U.S. adults using NHANES 2021–2023 data. Short sleepers (<6h) exhibited significantly higher odds of obesity compared to normal sleepers (6–8h), independent of age, sex, and race/ethnicity. These findings are consistent with prior NHANES-based analyses and longitudinal studies showing that sleep curtailment predisposes individuals to weight gain [3,5].
Several biological mechanisms may underlie this relationship. Lack of sleep is linked to changes in hormones that control hunger, such as decreased leptin and increased ghrelin, which raise calorie intake [4]. Sleep restriction may also impair glucose metabolism, increase evening cortisol, and reduce physical activity due to fatigue [7]. On the other hand, while some studies have found increased risks at both extremes of sleep length, the observed non-significant link between obesity and long sleep (>8h) is consistent with earlier research [8]. The reasons for long sleep remain less clear, potentially reflecting underlying health conditions, depression, or socioeconomic factors.
The study's strengths include the use of objective BMI assessments as well as recent, nationally representative data. Due to reliance on self-reported sleep duration and the use of a cross-sectional study design, no conclusions regarding causality can be drawn. Furthermore, potential confounding factors such as socioeconomic status, physical activity levels, and dietary habits were excluded, resulting in certain limitations.
4. Conclusion
In conclusion, People have a short total sleep time is negatively correlated with obesity among American adults. These findings indicate that adequate sleep is a variable for preventing obesity. Besides traditional strategies such as nutrition and exercise, sleep hygiene education should be incorporated in public health initiatives. Although this study achieved its main goal, it also has several limitations: sleep duration was measured through self-reporting, which may lead to measurement errors; and the factors related to sleep quality, sleep duration, and sleep disorders were not examined, and further research is urgently needed. Future studies that integrate these dimensions will help to comprehensively understand the mechanism by which sleep affects obesity outcomes.
References
[1]. Hales, C. M. (2020). Prevalence of Obesity and Severe Obesity Among Adults: . US Department of Health and Human Services, Centers for Disease Control and Prevention, National Center for Health Statistics.
[2]. Hruby, A., & Hu, F. B. (2015). The epidemiology of obesity: a big picture. Pharmacoeconomics, 33(7), 673-689.
[3]. Patel, S. R., & Hu, F. B. (2008). Short sleep duration and weight gain: a systematic review. Obesity, 16(3), 643-653.
[4]. Taheri, S., Lin, L., Austin, D., Young, T., & Mignot, E. (2004). Short sleep duration is associated with reduced leptin, elevated ghrelin, and increased body mass index. PLoS medicine, 1(3), e62.
[5]. Itani, O., Jike, M., Watanabe, N., & Kaneita, Y. (2017). Short sleep duration and health outcomes: a systematic review, meta-analysis, and meta-regression. Sleep medicine, 32, 246-256.
[6]. Centers for Disease Control and Prevention (CDC). (2023). National Health and Nutrition Examination Survey. https: //www.cdc.gov/nchs/nhanes/about/index.html
[7]. Knutson, K. L., Spiegel, K., Penev, P., & Van Cauter, E. (2007). The metabolic consequences of sleep deprivation. Sleep medicine reviews, 11(3), 163-178.
[8]. Cappuccio, F. P., Taggart, F. M., Kandala, N. B., Currie, A., Peile, E. D., Stranges, S., & Miller, M. A. (2008). Meta-analysis of short sleep duration and obesity in children and adults. Sleep, 31(5), 619-626.
Cite this article
Xu,J. (2025). Sleep: A Modifiable Risk Factor? Sleep Duration and Obesity Burden in U.S. Adults. Theoretical and Natural Science,152,56-60.
Data availability
The datasets used and/or analyzed during the current study will be available from the authors upon reasonable request.
Disclaimer/Publisher's Note
The statements, opinions and data contained in all publications are solely those of the individual author(s) and contributor(s) and not of EWA Publishing and/or the editor(s). EWA Publishing and/or the editor(s) disclaim responsibility for any injury to people or property resulting from any ideas, methods, instructions or products referred to in the content.
About volume
Volume title: Proceedings of ICMMGH 2026 Symposium: Biomedical Imaging and AI Applications in Neurorehabilitation
© 2024 by the author(s). Licensee EWA Publishing, Oxford, UK. This article is an open access article distributed under the terms and
conditions of the Creative Commons Attribution (CC BY) license. Authors who
publish this series agree to the following terms:
1. Authors retain copyright and grant the series right of first publication with the work simultaneously licensed under a Creative Commons
Attribution License that allows others to share the work with an acknowledgment of the work's authorship and initial publication in this
series.
2. Authors are able to enter into separate, additional contractual arrangements for the non-exclusive distribution of the series's published
version of the work (e.g., post it to an institutional repository or publish it in a book), with an acknowledgment of its initial
publication in this series.
3. Authors are permitted and encouraged to post their work online (e.g., in institutional repositories or on their website) prior to and
during the submission process, as it can lead to productive exchanges, as well as earlier and greater citation of published work (See
Open access policy for details).
References
[1]. Hales, C. M. (2020). Prevalence of Obesity and Severe Obesity Among Adults: . US Department of Health and Human Services, Centers for Disease Control and Prevention, National Center for Health Statistics.
[2]. Hruby, A., & Hu, F. B. (2015). The epidemiology of obesity: a big picture. Pharmacoeconomics, 33(7), 673-689.
[3]. Patel, S. R., & Hu, F. B. (2008). Short sleep duration and weight gain: a systematic review. Obesity, 16(3), 643-653.
[4]. Taheri, S., Lin, L., Austin, D., Young, T., & Mignot, E. (2004). Short sleep duration is associated with reduced leptin, elevated ghrelin, and increased body mass index. PLoS medicine, 1(3), e62.
[5]. Itani, O., Jike, M., Watanabe, N., & Kaneita, Y. (2017). Short sleep duration and health outcomes: a systematic review, meta-analysis, and meta-regression. Sleep medicine, 32, 246-256.
[6]. Centers for Disease Control and Prevention (CDC). (2023). National Health and Nutrition Examination Survey. https: //www.cdc.gov/nchs/nhanes/about/index.html
[7]. Knutson, K. L., Spiegel, K., Penev, P., & Van Cauter, E. (2007). The metabolic consequences of sleep deprivation. Sleep medicine reviews, 11(3), 163-178.
[8]. Cappuccio, F. P., Taggart, F. M., Kandala, N. B., Currie, A., Peile, E. D., Stranges, S., & Miller, M. A. (2008). Meta-analysis of short sleep duration and obesity in children and adults. Sleep, 31(5), 619-626.