


1. Background
In our day-to-day lives, we constantly have to rely on our spatial memory. Consider driving into a supermarket nearby without the use of a GPS or modern apps such as Google Maps. This activity utilizes an individual’s attention and spatial memory, allowing them to identify the way by passing landmarks, recognizing certain junctions where to make turns, and finally finding their goal, the supermarket. Similar processes occur when navigating inside a large shopping mall, finding one’s way in a new city, or hiking an unfamiliar trail.
Understanding the cognitive and neural mechanisms underlying the navigation is crucial. Successful goal-directed navigation required both decision-making and spatial navigation abilities [1]. The working memory holds the goal representation, plans the trajectory to the goal, which requires scenery perception, and retrieves the map knowledge [2]. This integration of memory, perception, and executive function is essential for efficient navigation, and its capacity can vary greatly among individuals.
Certain individuals can fail at this kind of navigation due to a combination of biological and cognitive factors. Damage or underdevelopment in brain areas such as the hippocampus, the prefrontal cortex, and the parietal cortex can impair spatial processing. Attention deficit or inappropriate selective attention, such as focusing on the wrong features or not paying attention to environments, can hinder effective navigation as well [3]. Memory-related problems also play a role in map-reading and wayfinding. They include failure in associating places with visual features and patterns in long-term memory and generating sequences of places such as starting points, landmarks and goals in the working memory.
However, it is unclear what the specific factors are that drive individual differences in navigation abilities and spatial cognition. Systematic tests with well-designed maze structures and simultaneous neural recordings are required to address these issues. Therefore, I built a maze with the design of the classic Tolman’s multiple T junctions [4], in which subjects need to rely on multiple landmarks to find goal locations.
2. Research questions
In this project, I designed two experiments to explore the main factors that drive individual differences in spatial cognition by using a novel maze consisting of multiple landmarks and junctions. I predicted that the level of spatial experience and landmark processing and working memory capacity would cause the differences in maze learning and goal finding. For example, some subjects may pay more attention to important, salient landmarks in the maze than others, and the presence or absence of meaningful associations between these landmarks and the goal location plays an important role in forming mental maps. Varying abilities in map learning can consist of analyzing what is on the map and what one should do to reach the goal. Furthermore, individuals may have different capacities in terms of executive functioning, such as generating sequences linking key locations to each other, paying attention to your surroundings, making use of working memory and planning in a cognitively flexible manner.
While subjects navigate the maze by controlling the motor in the maze, the local field potential signals will be recorded through an electroencephalogram (EEG) cap that captures electrical signals from the prefrontal and parietal regions. I predicted that the attention-related signal level from the EEG measurements should be reflected in the navigation experience of the subject.
3. Hypotheses
1. Behavior:
Subjects will likely demonstrate better map understanding, faster arrival at goal locations, fewer changes of headings during active navigation.
During the second attempt in finding the goal, performance might increase.
2. Neural:
Subjects will likely demonstrate better map understanding and navigation, as well as a higher level of concentration in the EEG data.
There is a correlation between landmark and signpost viewing frequency/time and the theta/beta/gamma bands.
4. Methods
To address our research questions, I performed two experiments to collect behavioral and neural data from participants while they navigate through NeuroNav research platform which is specifically designed for revealing the neural mechanisms in naviagation. The NeuroNav platform is a physical maze with complex layouts and multiple goal locations, with various decision points, diverse visual landmarks, signposts and visual panoramas indicating routes and directions.
4.1. Subjects
In Experiment 1, three participants will be required to perceive the visual features, remember the surrounding landmarks to create mental maps, then use these mental maps to plan routes to find two different goal locations. In Experiment 2, the same batch of subjects navigate in the same maze to find the goal locations without an explicit map by hand.
4.2. Goal-directed navigation research platform(NeuroNav)
Previously researchers analyze the cognitive and neural mechanisms regarding the navigation via VR-based method or on-site navigation studies. It is difficult for subjects to feel the full sensory realism and on-site navigation studies in complex environments (e.g., supermarkets or malls) are always time-consuming. The novel goal-directed navigation research platform, NeuroNav, offer a physical, safe and resource-efficient setting and this platform preserves naturalistic visual exploration through the camera-based perspective while maintaining precise control over environmental variables such as landmarks, path geometry, and goal locations.
4.2.1. Maze design
The maze has been designed to branch into multiple T-shaped structures [4,5] and has different junctions with two alternative options leading to the ends, in which only one of the ends relates to the next available routes and the other one is a dead end, as shown in Figure 1. The physical maze was fabricated on a 80cm x 80cm arcylic plate based on the maze schematic via laser-cutting techniques. The transparent acrylic base ensures clear visibility, high geometric fidelity, and repeatability across trials, while the sharp precision of laser cutting preserves pathway boundaries and dimensions exactly as intended in the sketch.
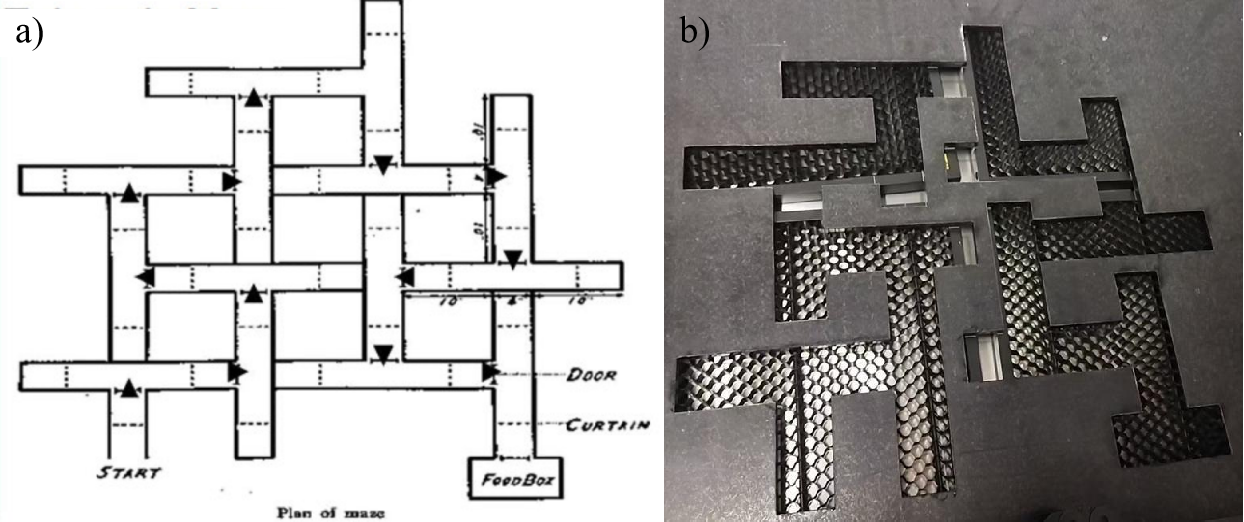
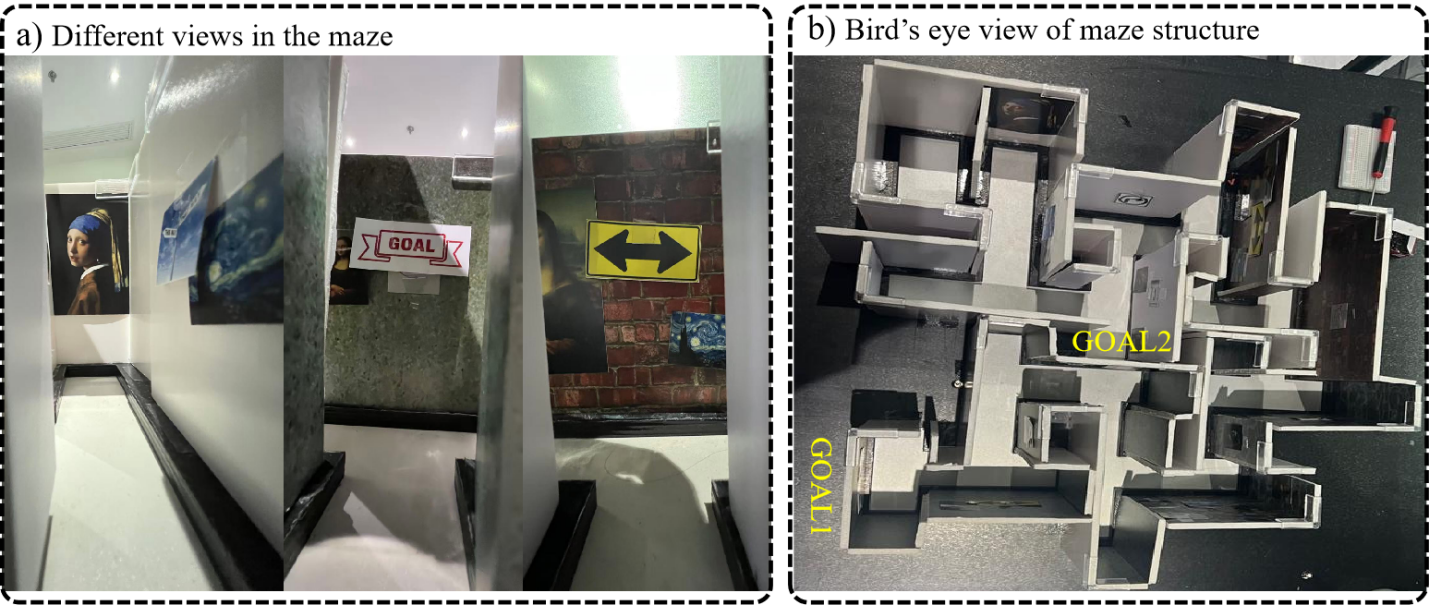
The walls of the physical maze are constructed from KT board, a lightweight yet rigid foam core material, due to its precision-cut ability, durability and easy-to-print visual patterns. In order to facilitate spatial orientation and navigation research, distinctive visual landmarks and cues, i.e., traffic direction signs, goal sign and world famous painting sign, were strategically placed both on the walls and at the key intersections in the maze(see Figure 2a). Finally, we combine the KT-board walls with the maze base to form the complete experimental maze environment(as shown in Figure 2b).
4.2.2. Assembly and usage of the NeuroNav platform
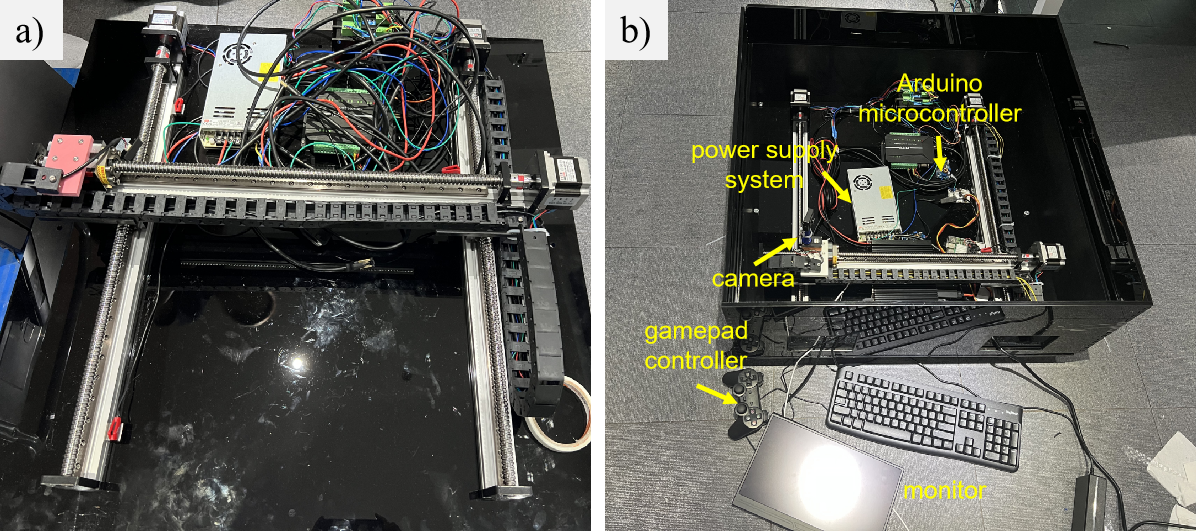
The drive system in the Goal-directed Navigation Research Platform (NeuroNav) is implemented using a lead-screw linear stage(see Fig 3a). The lead-screw linear slide is mounted onto an acrylic base plate. We connect devices such as the camera, gamepad, monitor, arduino controller to the lead-screw linear stage in order to facilitate subjects to use NeuroNav research platform(see Fig 3b).
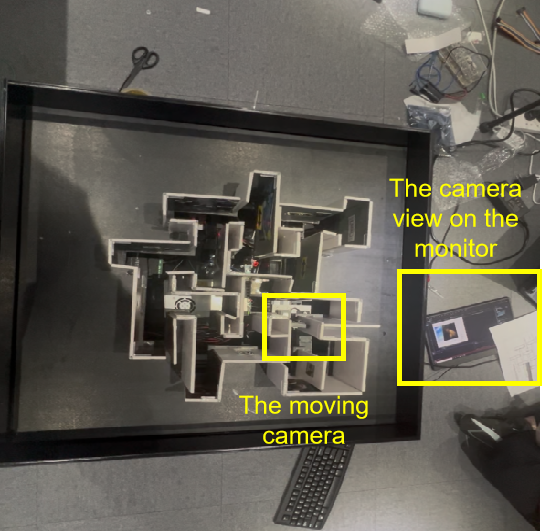
During the experimental sessions, participants are equipped with EEG devices that continuously monitor and record their brain activity. They observe the camera's live view displayed on a monitor and manipulate the camera's orientation using a gamepad controller(see Figure 4). This setup enables real-time analysis of neural responses associated with navigation tasks, providing insights into cognitive processes such as attention, spatial awareness, and decision-making.
4.3. Experimental procedures
Subjects volunteered to participate in the two experiments. They first learned how to control a motor to move the camera and change its heading for different views in the maze. They were informed of the design of landmarks which might help them familiarize themselves with the maze. The aim was to reach the goal location in the maze as quickly as possible. To achieve this, subjects had the freedom to adjust the heading and control the motor.
In the first experiment, subjects first had to travel to Goal Location 1 (at the end of the maze trajectories) without a map. Then, they had to navigate from the starting point to a new Goal Location 2 (in the center part of the maze) without a map. In the second experiment, the same subjects were required to travel to the Goal Location 1 again, but with a map of the maze layout.
A top-down view of navigating experience was captured and saved as a video for behavioral data for each session. For the EEG setup, in both experiments, subjects wore the EEG cap at the same time during navigation experience. I made sure that the time range of the EEG recording was longer than the time range for the behavioral data.
4.4. Data processing
In Experiment 1, I analyzed the six video clips and EEG datasets from the three subjects. I compared the six navigation sessions gathered from the three participants as they each navigated through the maze towards two different destinations. One session for each participant was for navigating toward Goal Location 1, and another toward Goal Location 2. The analysis below was structured to obtain both within-subject and between-subject differences. Within-subject contrasts examined potential changes in performance when the same individual travelled to Goal Location 1 compared to Goal Location 2. Across-subject contrasts searched for differences between individuals traveling to the same goal location. Group-level means were then determined to establish general patterns of navigation performance.
Stage 1
Stage 1 of analysis searched for significant timepoints within navigation. The actual onset of movement was identified, and significant events were labelled after this timestamp (see Table 1). Using the video recordings, I then tracked the direction of heading of the camera, which made it possible to understand the subjects' attentional orientation in the environment. These heading changes were associated with the visual configurations that were encountered in the maze. These visual cues, such as signposts or paintings, were then considered important and were measured for their potential in decision-making (see Table 2). Changes in heading direction, and pause durations were monitored per session to provide differences in navigational strategy. Scanning ahead in the path, dead-ending and backtracking previously explored routes were such strategies.
Stage 2
During stage 2, the behavioral timestamps in the videos were aligned to the EEG recordings. The movement time was calculated to determine how long the participant took to move to the subsequent location in the maze. Paths were divided into epochs at the scale of seconds, then further be corrected using camera movement and points of interest, as discussed in Stage 1. The points of interest were marked and their lengths were calculated and recorded on the EEG data sheet.
Stage 3
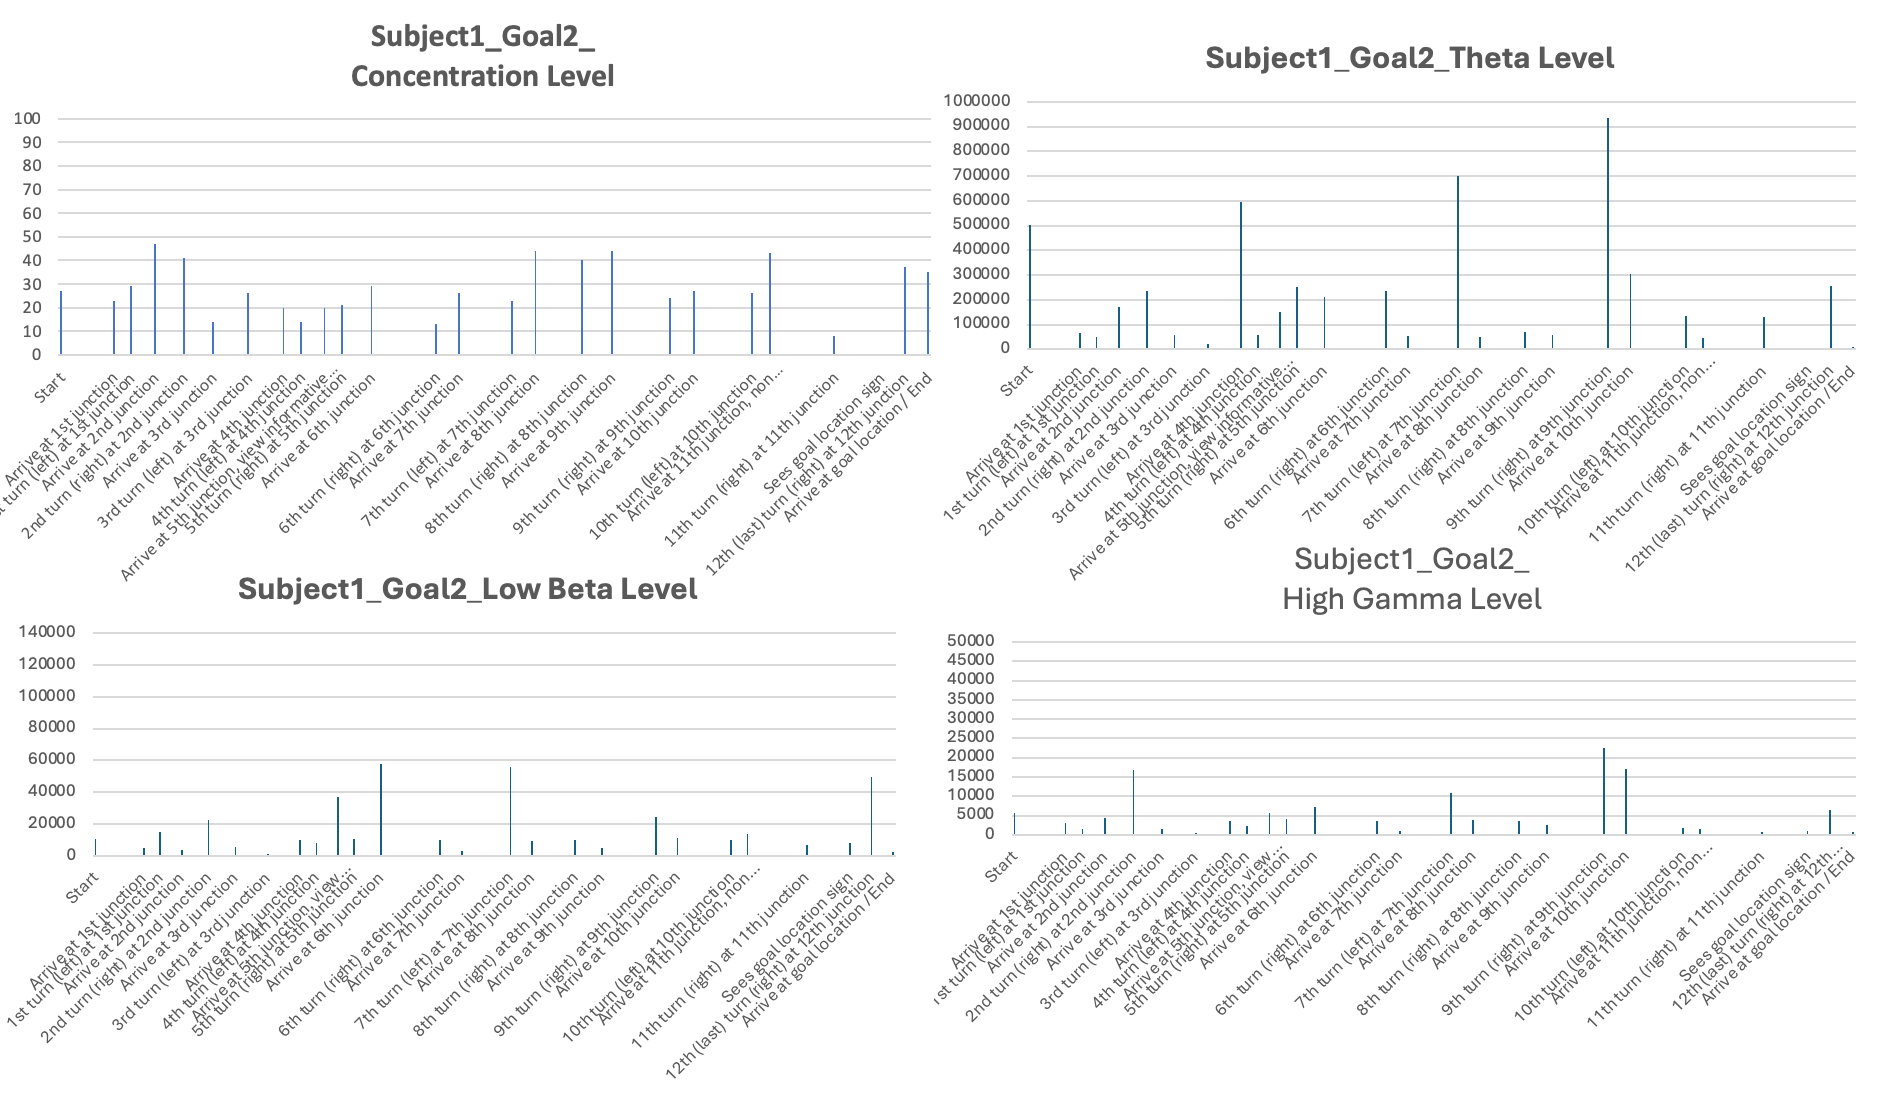
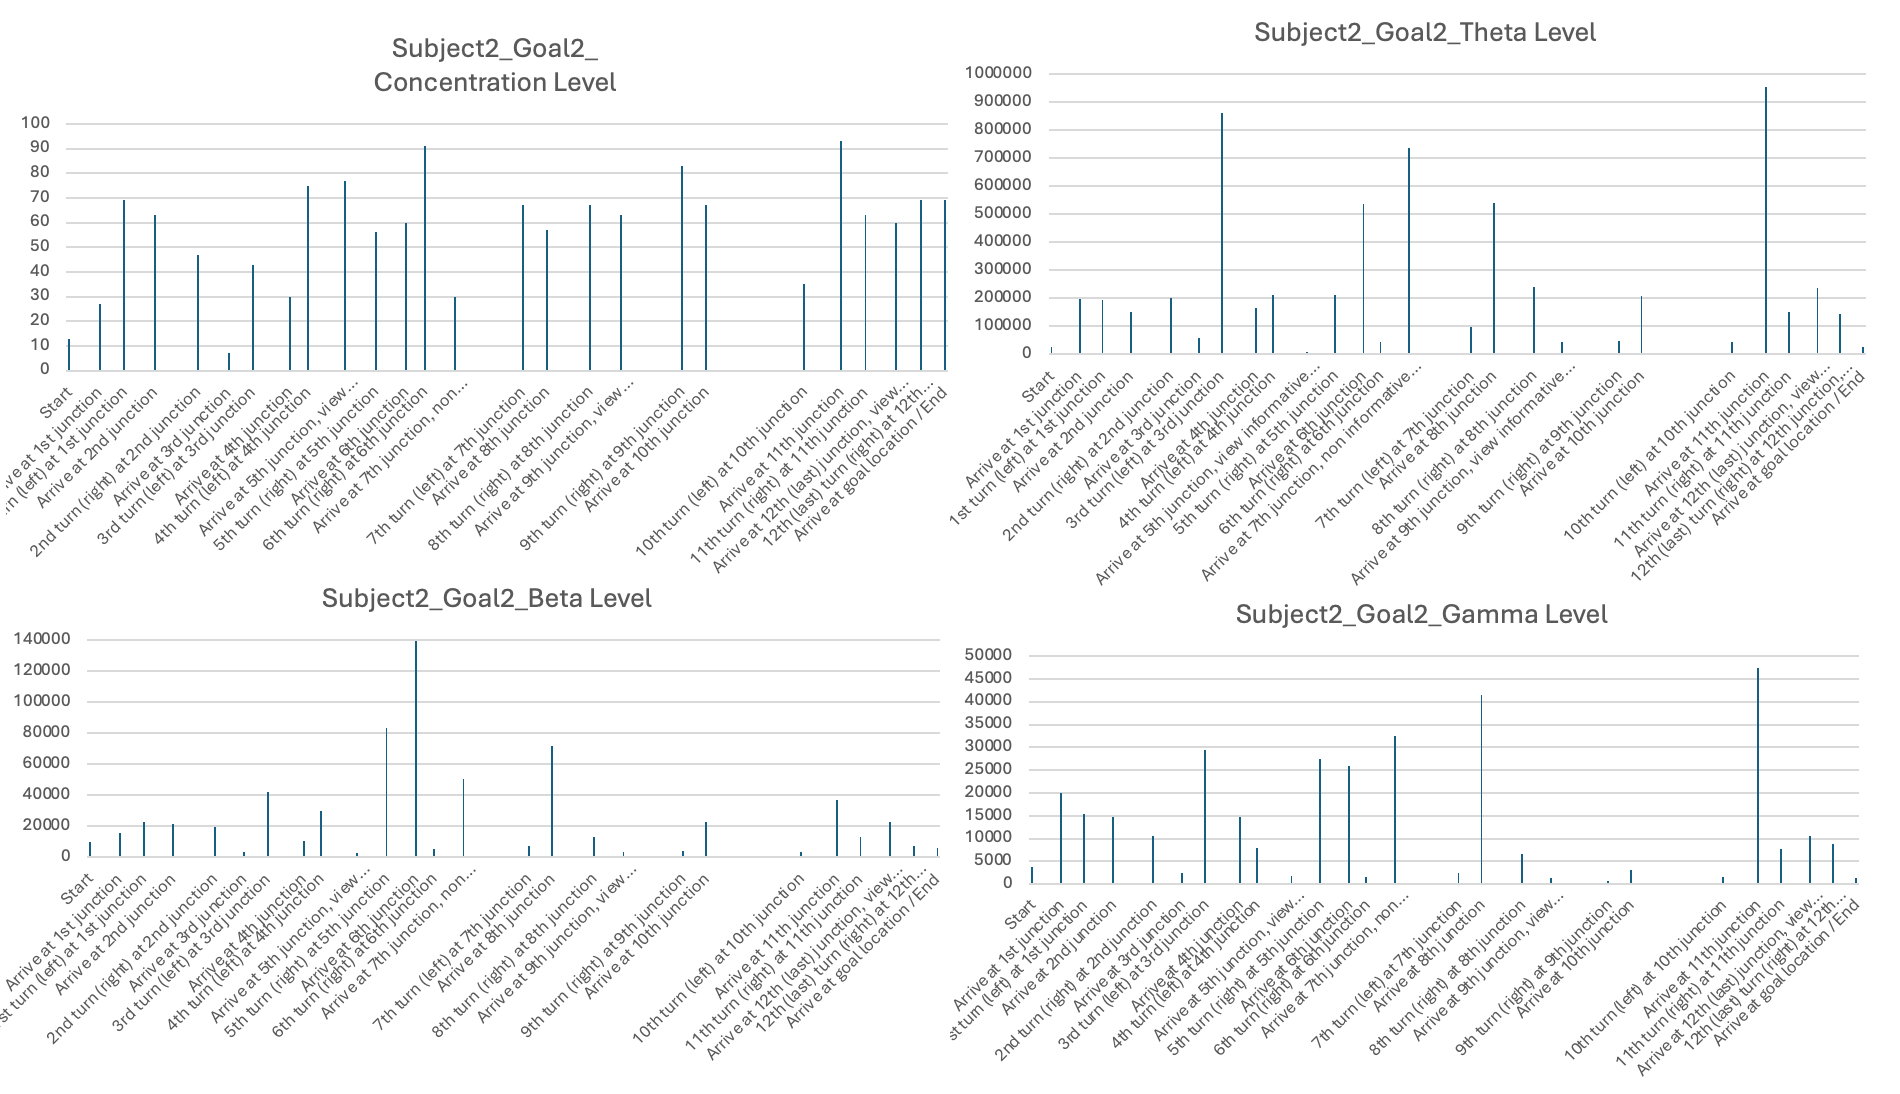
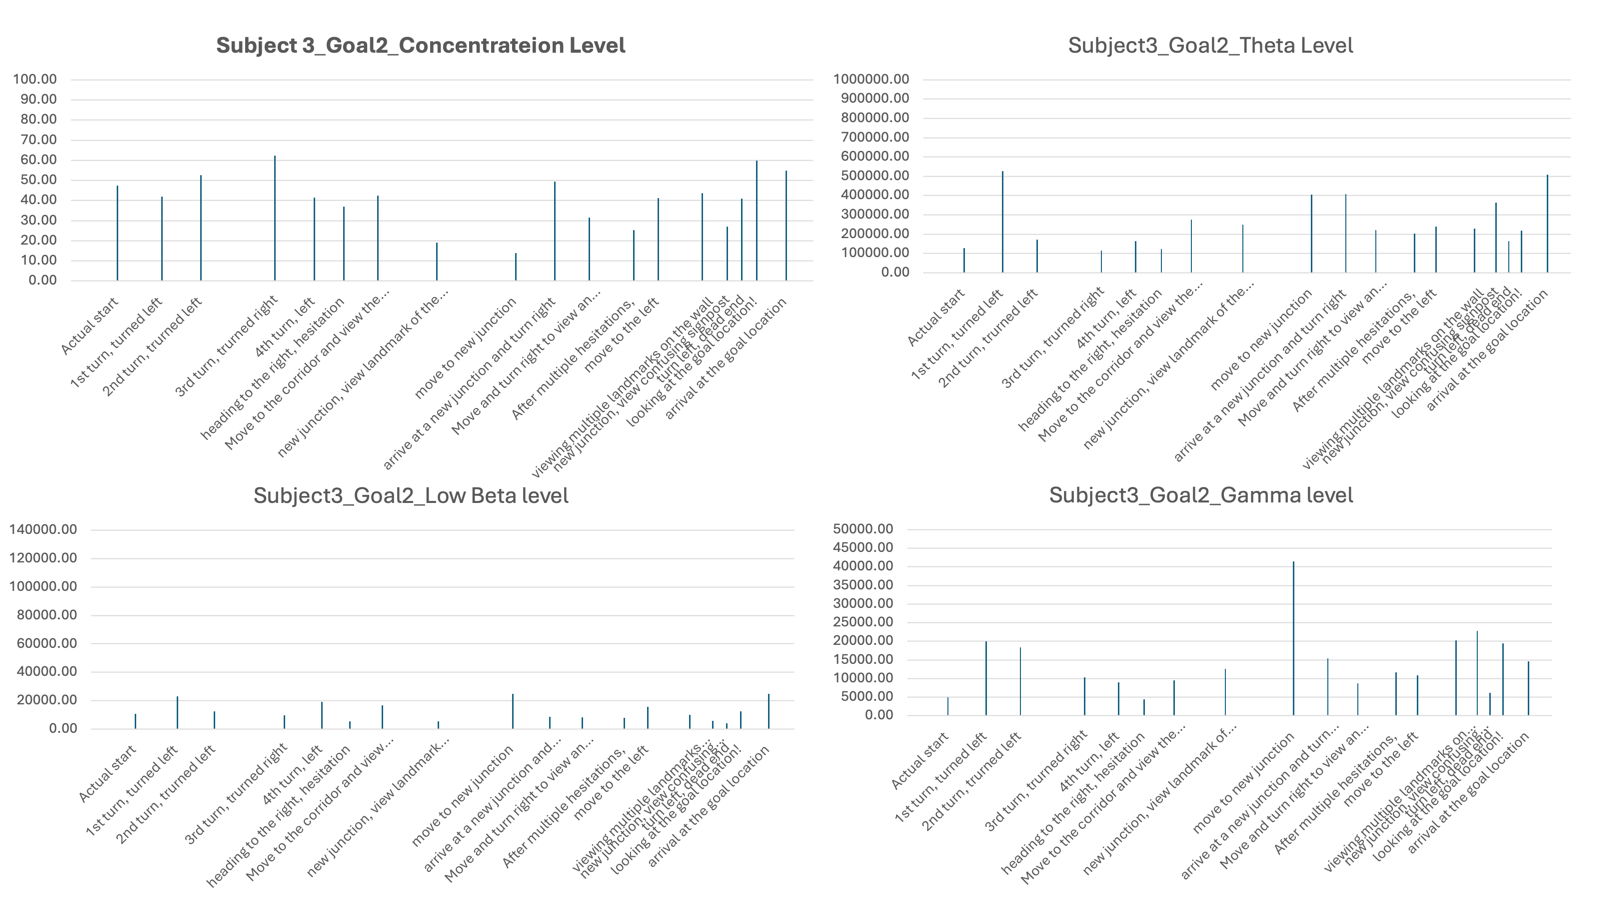
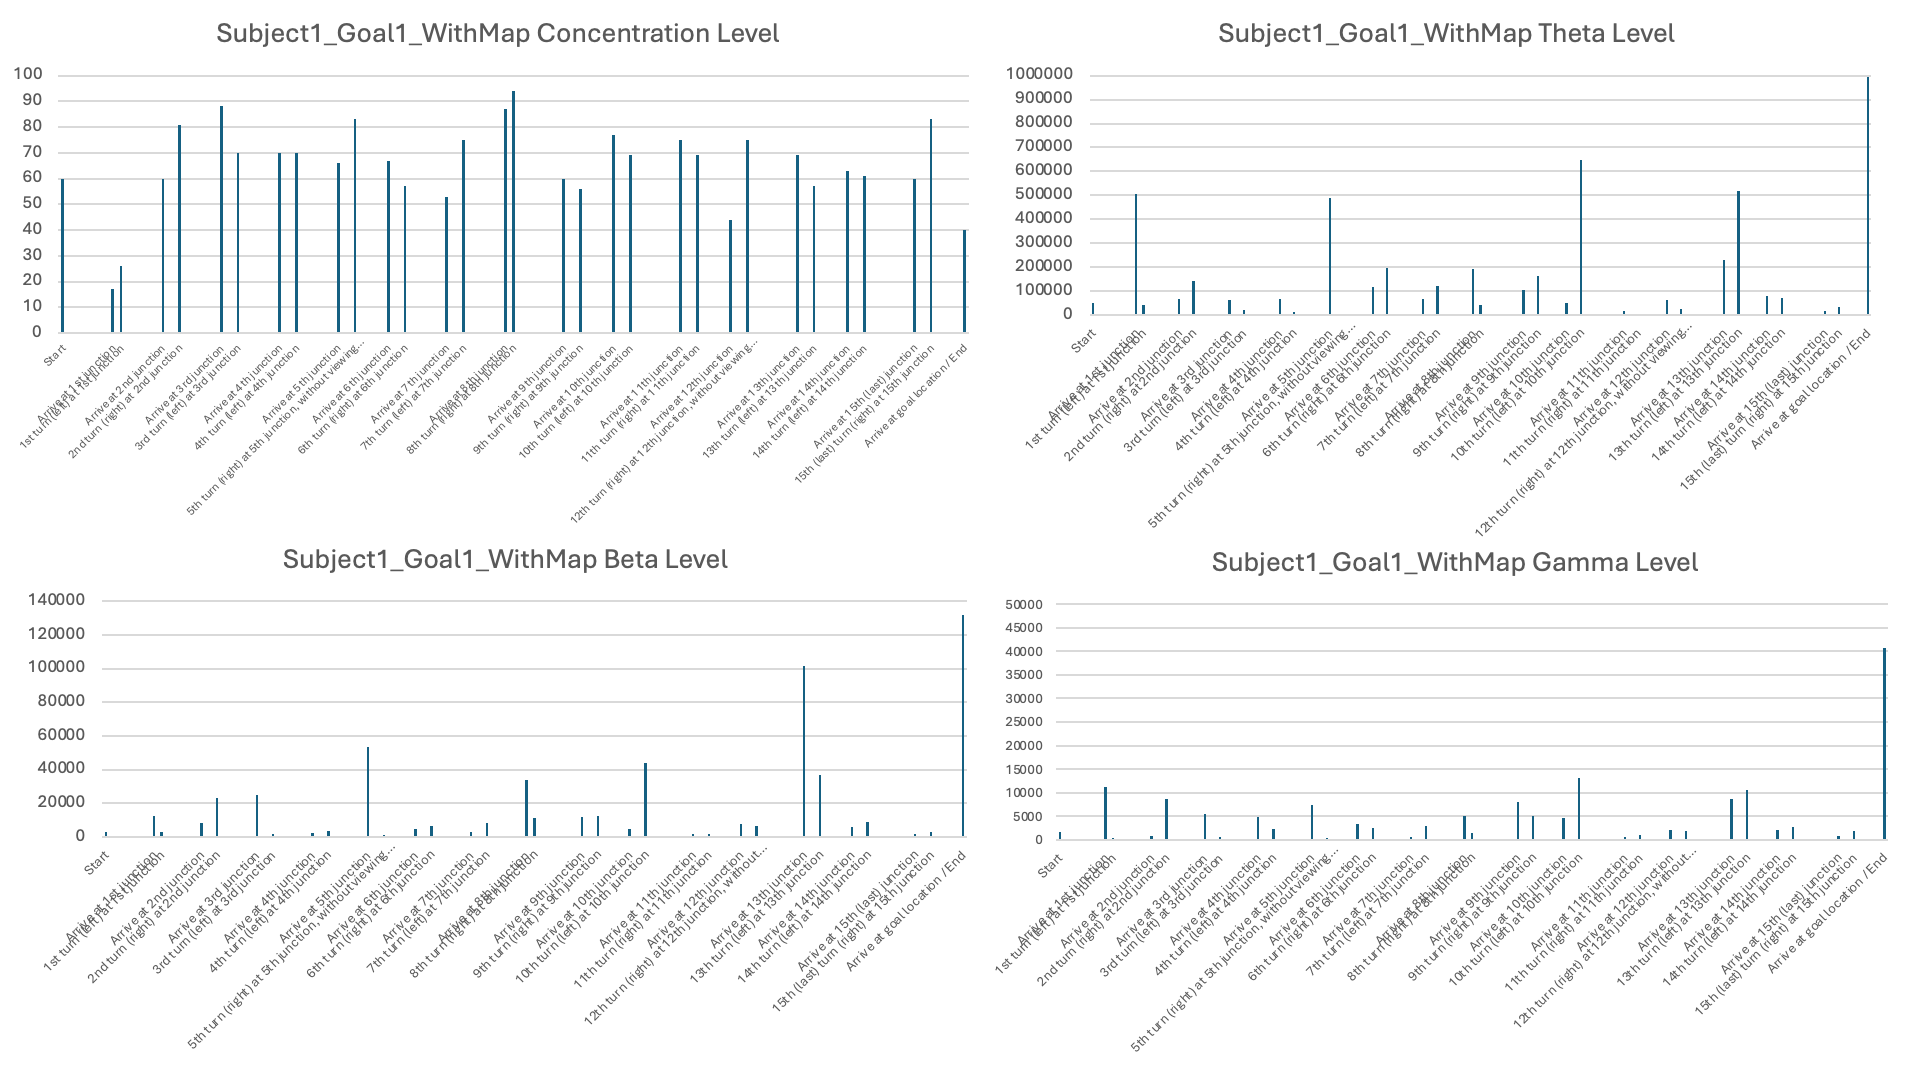
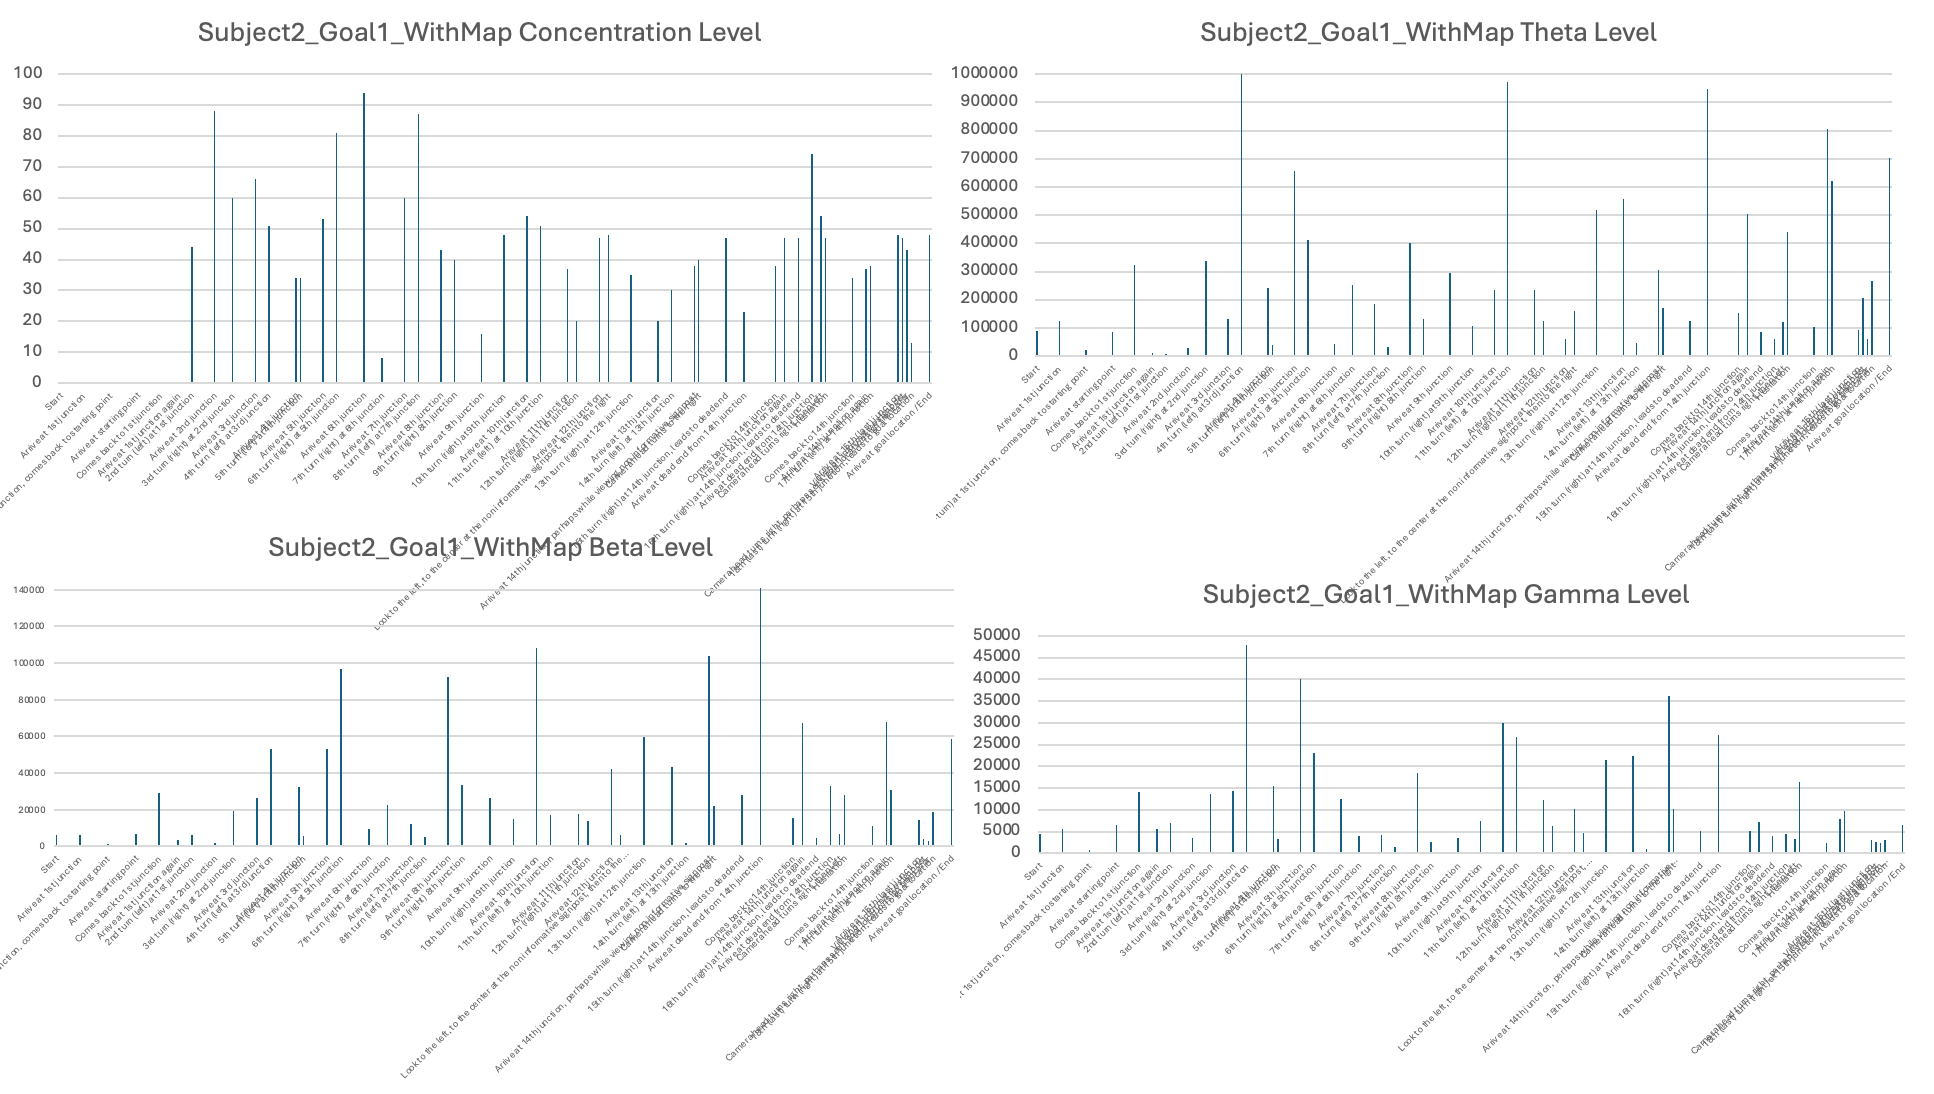
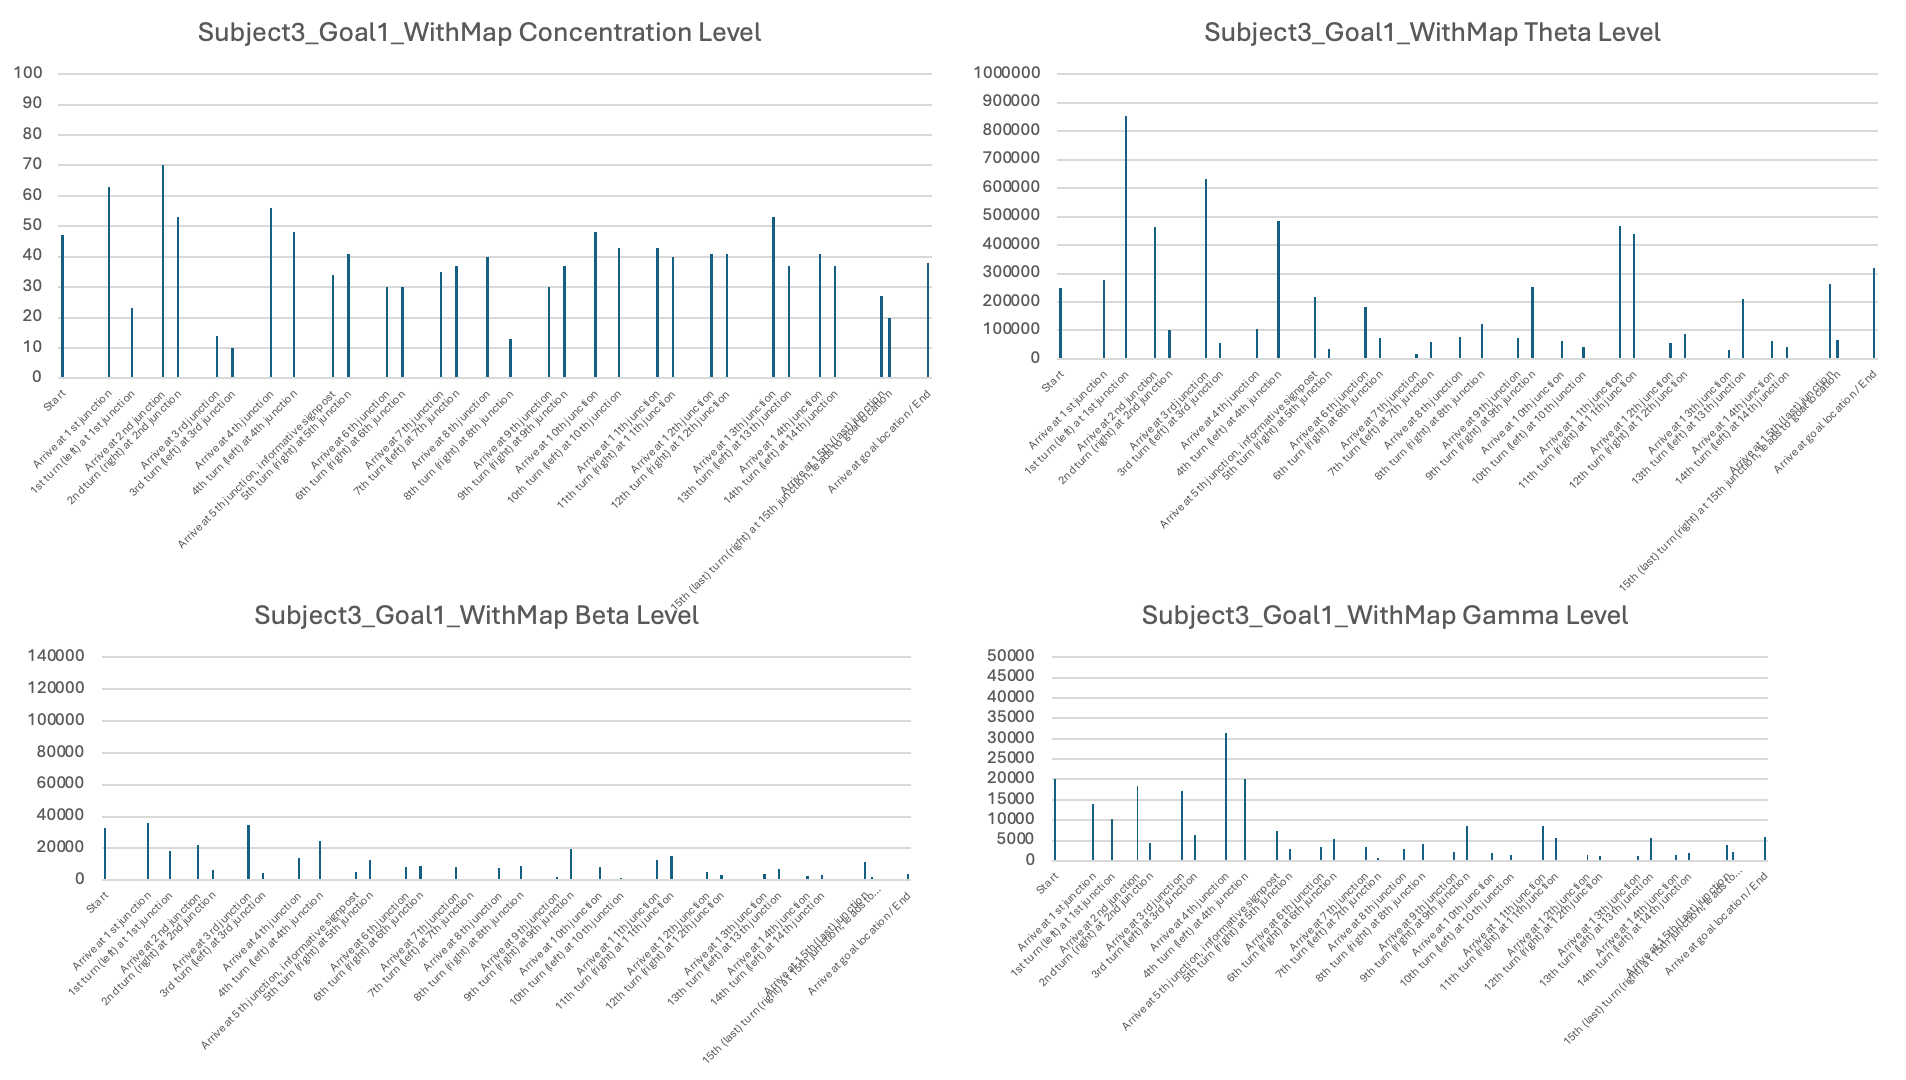
The third stage of analysis utilized the EEG measures such as levels of concentration, Theta, Low Beta, and High Gamma activity (see examples in Table 3). Raw EEG values for individual subjects were averaged over behavioral epochs identified in Stage 2. These were then displayed in bar plots with timestamps on the X-axis and EEG signal levels on the Y-axis in order to illustrate how neural activity varied under various phases of navigation (see Figures 6-11 for each subject and the individual session).
Stage 4
Finally, all the values were compared between sessions. Within-subject comparisons examined whether patterns of EEG activity differed between Goal Location 1 and Goal Location 2 for the same subject. Across-subject analyses took into account whether there were invariant patterns across participants and whether individual differences were apparent. Group-level averages were used to test the overall consistency of reported patterns, namely whether heightened neural activity close to goal locations was consistent for both navigation tasks.
|
Actual starting time |
17:16:55 |
|
1st turning point (turned left) |
17:17:04 |
|
2nd turning point (decision point for making choice) |
17:17:12 |
|
View landmarks |
17:17:12-15 |
|
then turned right for decision |
17:17:27 |
|
The next junction for turning, left |
17:17:35 |
|
Hesitation at the junction |
17:17:41 |
|
Looking at the informative signpost, then moves smoothly to the next junction |
17:17:48-53 |
|
Arrive to a new junction and view another landmark (dead end) |
17:18:00-01 |
|
Arrival at a new junction and turn right to the upcoming path |
17:18:24-30 |
|
View ambiguous signpost + lots of hesitation back and forth |
17:18:36-48 |
|
Multiple landmarks/scene viewing |
17:18:56 |
|
Arrival at the last junction (for goal) and view non-informative signpost |
17:18:59 |
|
Turn left, looking at the dead end |
17:19:02 |
|
Turn right, looking at the goal |
17:19:05 |
|
Arrival at the goal location |
17:19:11 |
5. Results
1. Behavior: From the video recordings, I identified the following metrics: the total time spent to arrive at goal locations (in seconds), counts of how many times subjects change headings during navigation, and counts of number of events identified during the navigation.
2. Neural: For the identified behavioral events during navigation, I also recorded the EEG data from the subjects, including the concentration level, theta bands, low beta bands and high gamma bands. I plotted the neural signal change across different events for a single session.
Experiment 1: Subjects visited two different goal locations in the maze without a map
I reported that, in comparison to Goal Location 1, subjects generally spent less time approaching Goal Location 2 (see Table 2 and Figure 2). They also tended to explore the maze slightly less in Goal Location 2, likely because they were more familiar with the environment. Changes in heading reflect how deterministic and confident subjects are when making decisions at junctions. Fewer heading changes are associated with better performance and faster arrival at the goal location. An interesting pattern emerged when comparing the two goal locations: for Goal Location 2, the number of heading changes generally increased. This may indicate that shifting the goal to a new location introduced uncertainty, requiring subjects to pay more attention to locate the goal. By contrast, Goal Location 1 was positioned at the end of the tracks, which may not have required an active mental representation of the goal during navigation.
|
Subject |
Time to arrive at goal 1 (s) |
Time to arrive at goal 2 (s) |
Change of headings for goal 1 (times) |
Change of headings for goal 2 (times) |
No. events identified for goal 1 |
No. events identified for goal 2 |
|
1 |
131 |
122 |
7 |
26 |
29 |
48 |
|
2 |
222 |
113 |
12 |
15 |
45 |
29 |
|
3 |
180 |
98 |
22 |
26 |
51 |
20 |
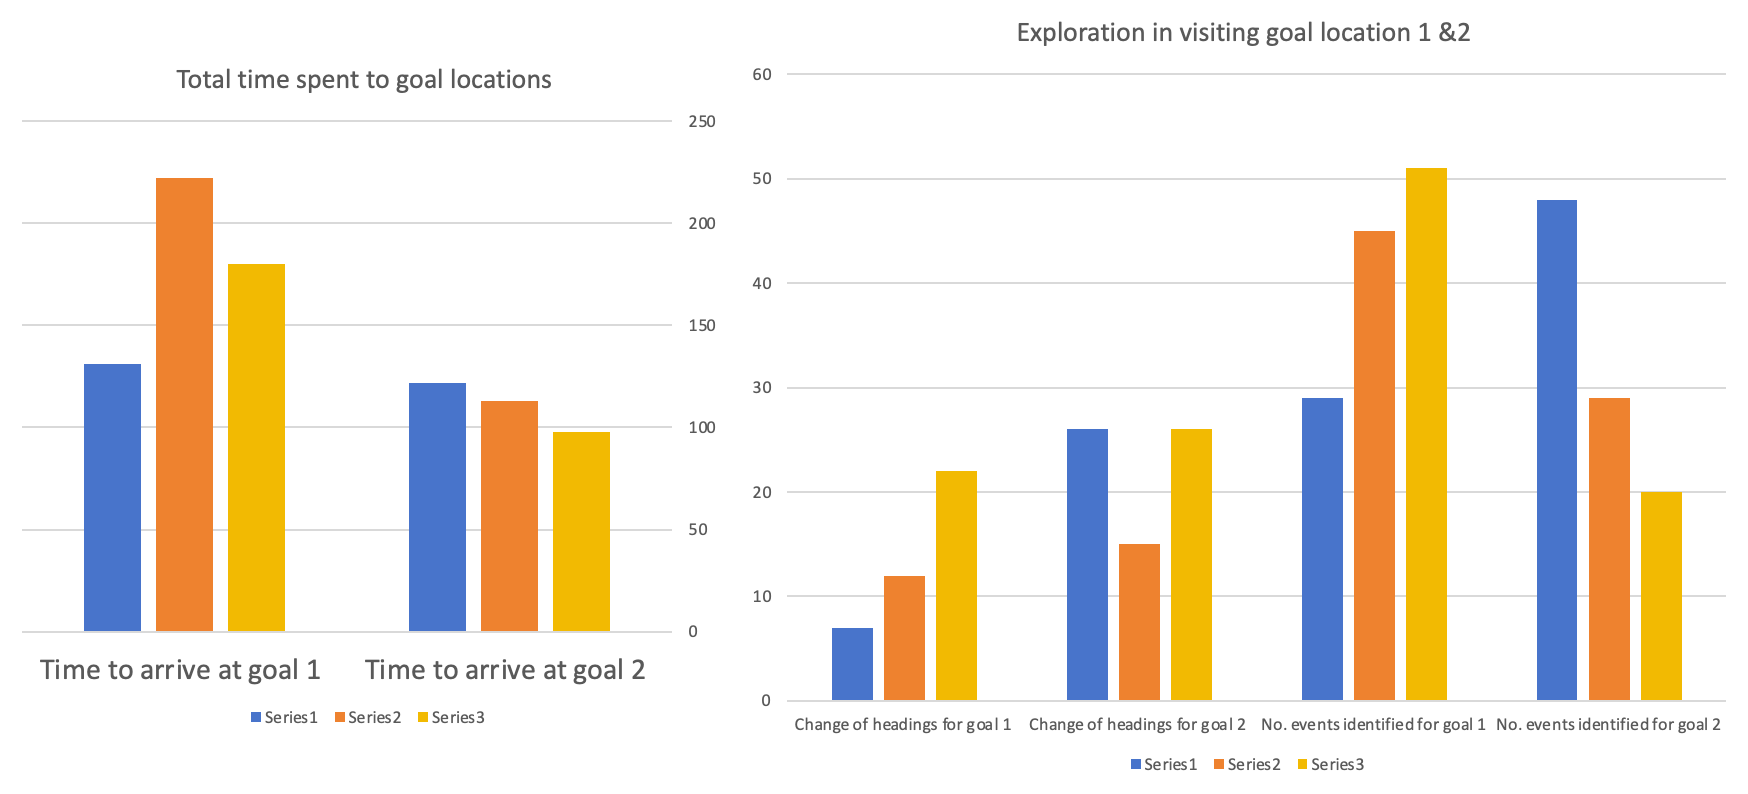
Different colors show data for different subjects (blue: subject1; orange: subject2; yellow: subject3). Left: total time spent to goal locations 1 and 2; Right: counts for change of headings and exploration events identified from video recordings for goal locations 1 and 2.
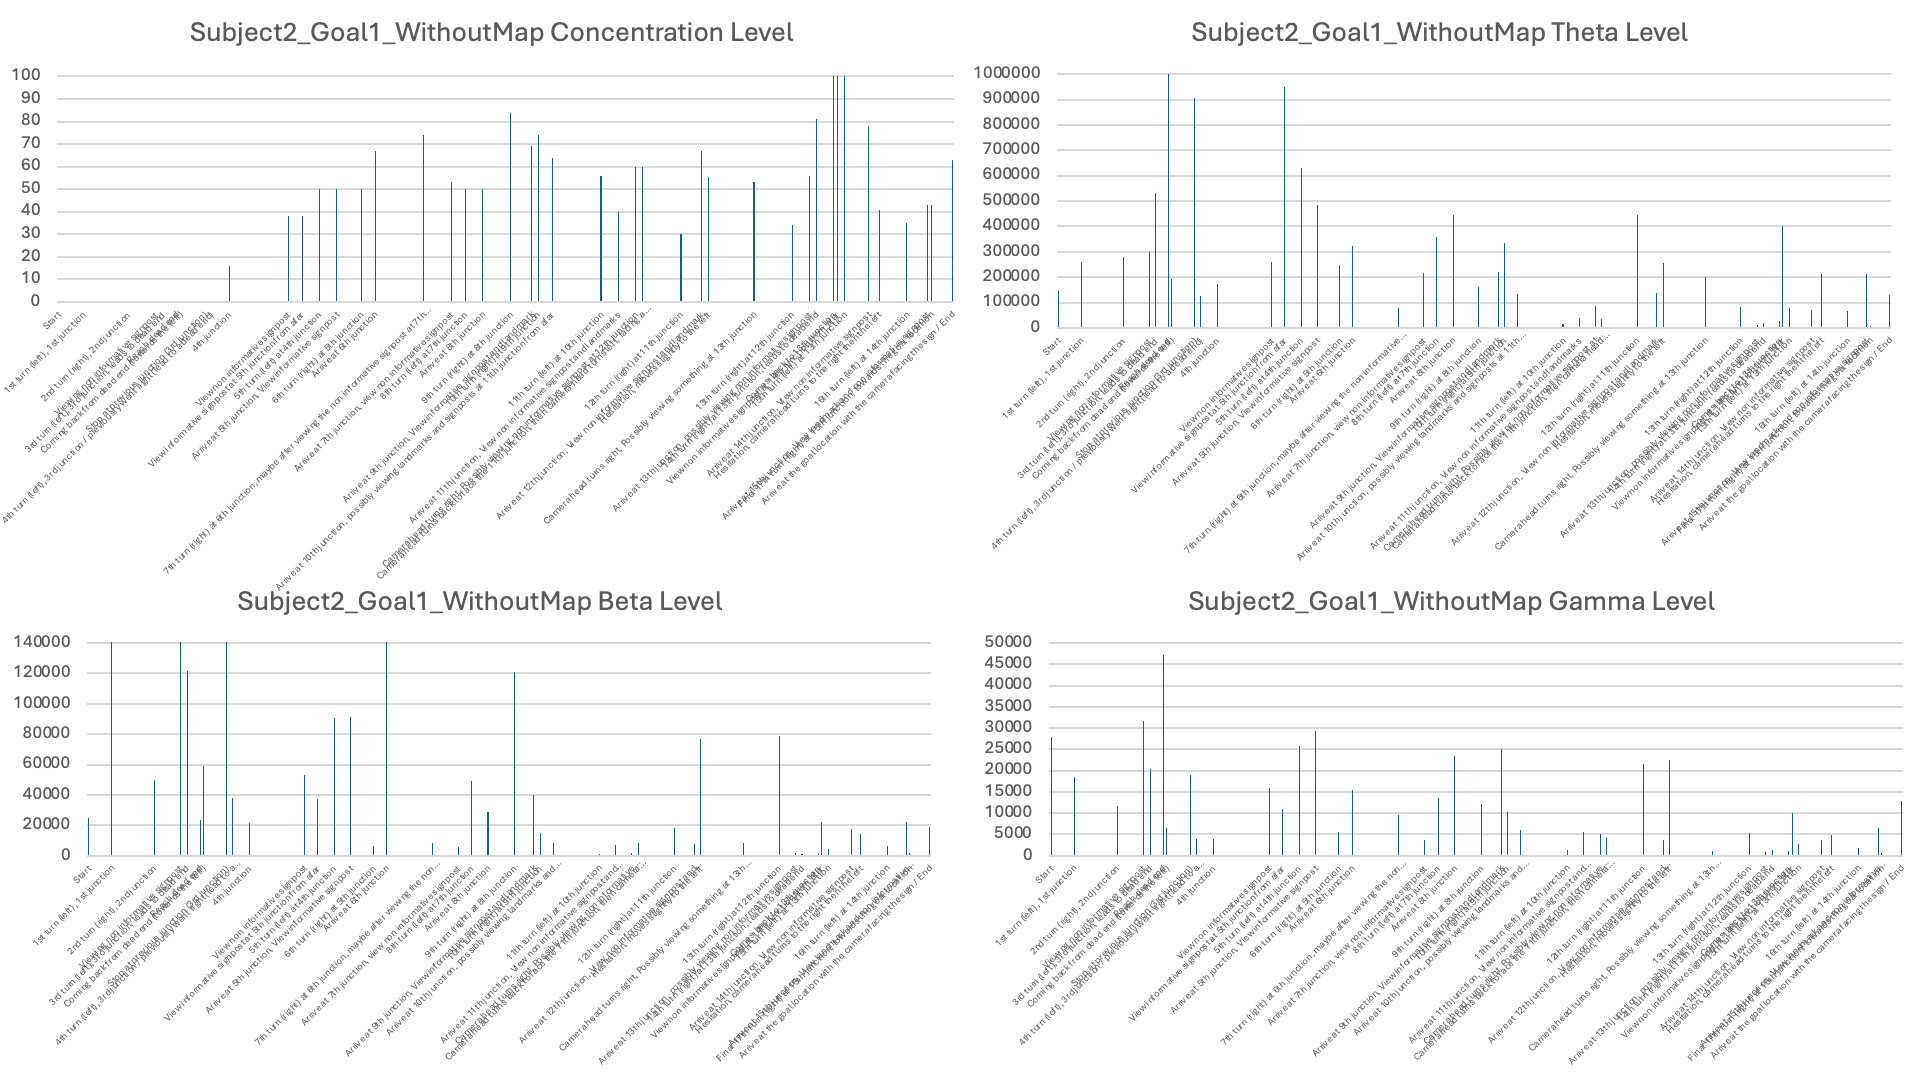
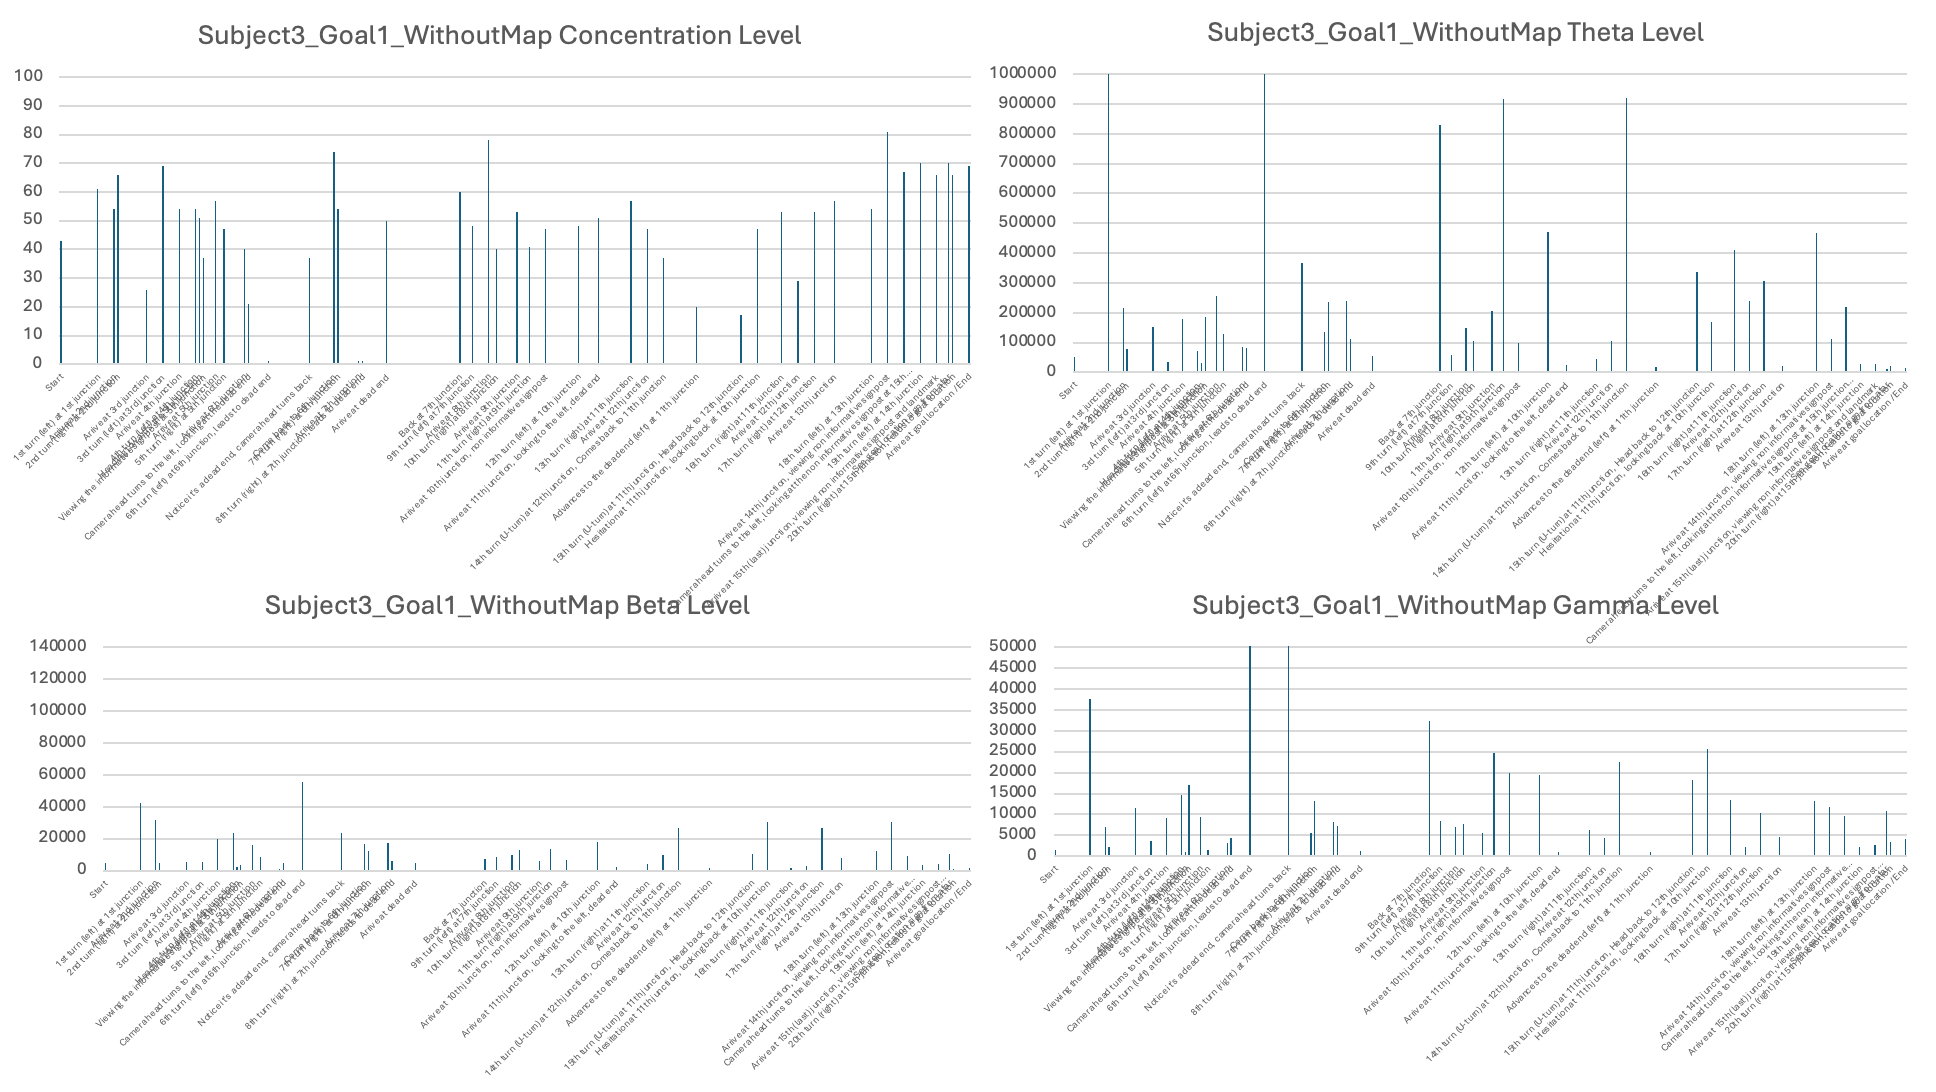
The second part of the results presents the corresponding EEG data recorded from subjects while navigating to Goal Location 1 and Goal Location 2. I found that, for most subjects, the concentration level, theta level, and gamma level were generally higher when navigating to Goal Location 1 than to Goal Location 2. This likely reflects the novel experience of exploring the maze and encoding landmark information, which is consistent with the role of EEG signals in supporting maze learning and memory formation. Occasionally, bursts of neural activity were observed when subjects approached new junctions or viewed landmarks in the maze.
In addition, Subject 2 stood out by showing very few hesitations when making decisions at different junctions, as reflected by the smallest number of heading changes for Goal Location 2. Correspondingly, Subject 2 also exhibited the highest values and the largest range across most EEG measurements, including consistently high concentration levels and substantial fluctuations in theta, beta, and gamma bands throughout the navigation task.
|
Behavior |
Concentration |
Theta |
Low Beta |
High Gamma |
|
Literature |
Attention |
Movement, learning, encoding new information |
Visual processing, working memory |
Cognitive processing (more general) |
|
Experiment |
Right from the start it is relatively high throughout the navigation, small peaks at arrival to new junctions; high attention is maintained |
Increase in the middle while arriving at new junction and view signposts |
Fluctuate, low in general, only increase in the middle of navigation |
Some fluctuation in the 1st half of the experience, then drop in the middle, increase at the end |
|
Interesting event: signpost |
Informative > ambiguous |
Informative > ambiguous |
Not apparent |
Not apparent |
|
Peak event |
6th and 11th junction, approaching goal location |
3rd turn and 11th junction, approaching goal |
6th junction |
New junction, 11th junction |
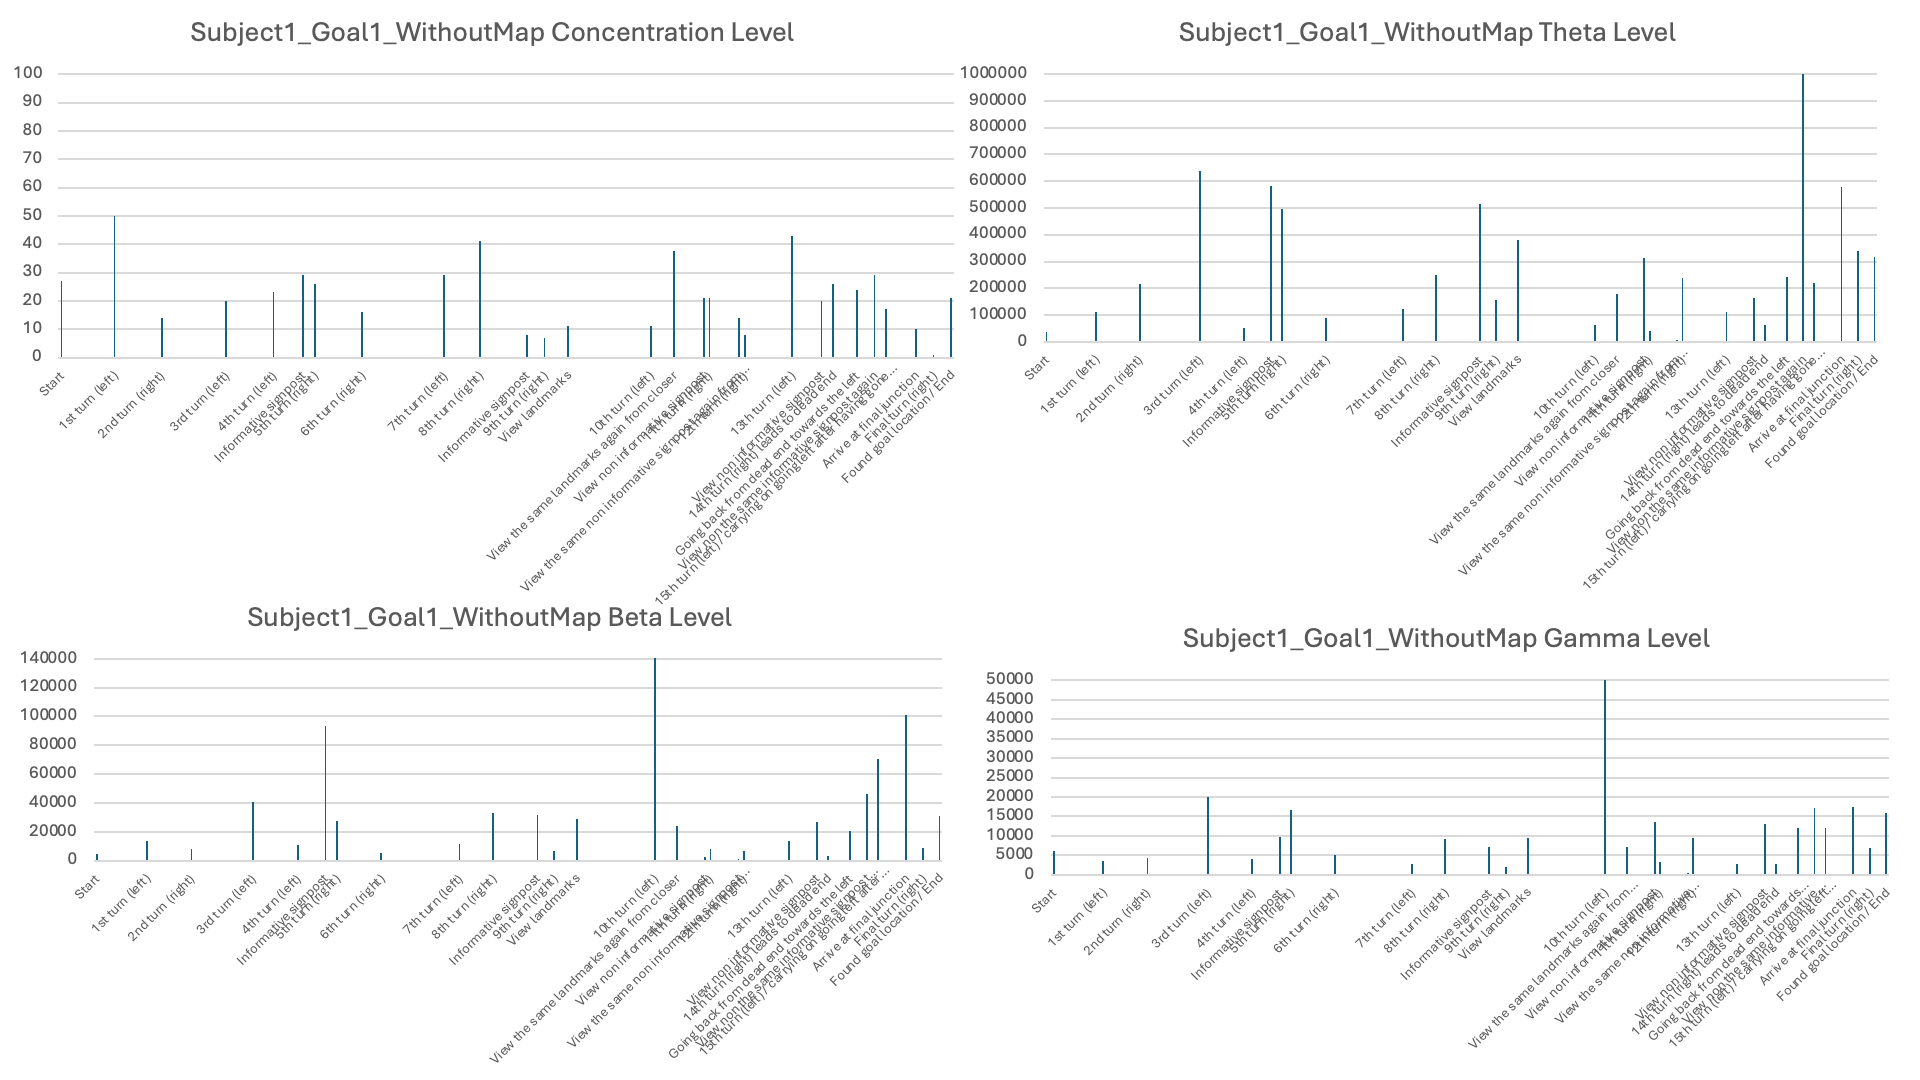
Four different EEG signals shown for Subject 1 in Session 1. Different bars indicated the raw EEG value identified for behavioral epoch or event in the behavior video recordings. All subject data are plotted using the same scale.
Experiment 2: Subjects visited Goal Location 1 again in the maze with a map
In order to address the question of whether subjects could improve performance by using structural information, such as a map layout, for navigation, I tested the subjects again in visiting Goal Location 1, but this time they were provided with a map. I found that all subjects showed a significant reduction in the time spent to reach the goal location, indicating an improvement in navigation performance. I also noted that two of the subjects showed no changes in heading at all when using the map, suggesting a high level of knowledge of the map without hesitation (see Table 4). Therefore, providing the map itself could be helpful for navigation. However, we cannot rule out potential practice effects, as the subjects were visiting the same goal location they had visited earlier.
|
Subject |
Time to arrive at Goal 1 (sec) without a map |
Time to arrive at Goal 1 (sec) with a map |
Change of headings for Goal 1 without a map |
Change of headings for Goal 1 with a map |
No. of events identified for goal 1 without a map |
No. of events identified for Goal 1 with a map |
|
1 |
131 |
77 |
7 |
0 |
29 |
31 |
|
2 |
222 |
150 |
12 |
14 |
45 |
46 |
|
3 |
180 |
81 |
22 |
0 |
51 |
30 |
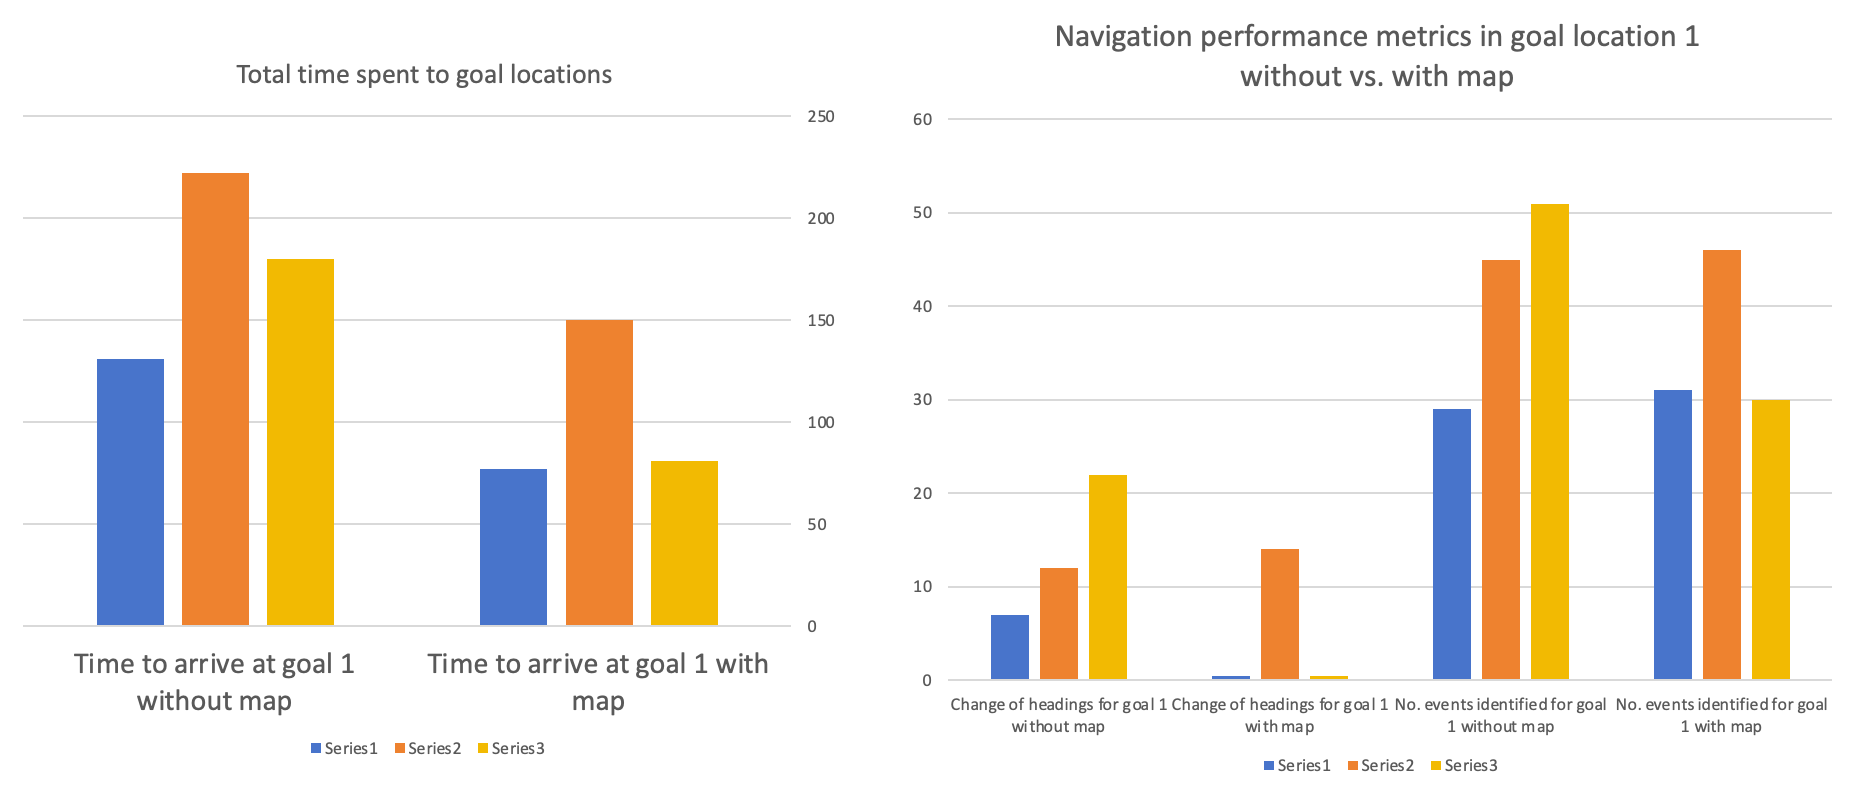
In terms of neural signals, I found large variations in EEG patterns across subjects. I reported that, for some subjects, the theta, beta, and gamma levels were lower when using a map and only increased upon reaching the goal locations (e.g., Subject 1). For Subject 2, the levels were generally high, showing some fluctuations during visits to new junctions and when viewing landmarks, indicating that even when provided with a map, Subject 2 was still actively processing information in the maze to find the goals. More sessions and subjects would be needed to draw solid conclusions.
6. Discussion
In summary, in the two experiments in the project, I found that behaviorally, subjects generally spent less time to reach Goal Location 2 compared to Goal Location 1. They explored the maze slightly less, which was likely due to increased familiarity with the environment. Heading changes reflected the subjects’ confidence in decision-making, where fewer changes were associated with faster navigation. When navigating towards Goal Location 2, there were more heading changes, which suggests that changing the goal created more uncertainty and thus required more attention.
Second, I measured selective attention through concentration and gamma level from the EEG. The EEG data showed that concentration, theta, and gamma levels were generally higher when traversing to Goal Location 1 than for Goal Location 2. The higher theta levels potentially reflect the novelty and landmark encoding needed when navigating towards the first goal. Moreover, bursts of neural activity would appear at new junctions or when viewing landmarks. However, Subject 2 seems to have differed from the others, showing consistently high concentration levels and significant fluctuations in theta, beta, and gamma levels. In the future, a larger sample of subjects is required to consolidate the conclusion.
Third, I found that providing a map greatly reduced the time it took to reach Goal Location 1 for all subjects. Two of the three subjects showed no heading changes, indicating that they were confident and efficient in their navigation of the maze. The EEG responses varied across the subjects. Generally, theta, beta, and gamma levels decreased when they were navigating with a map, and showed an increase when approaching the goal, suggesting there is a lesser processing load when equipped with the map. This might indicate some engagement level change. Nevertheless, Subject 2 maintained high EEG activity. Although the EEG signal showed some variations, there was a tendency of signal changes along with important behavioral epochs defined in the task, such as the relationship between beta and landmark viewing, theta and movement, and gamma with cognitive processing [6].
The main limitation of this study is the small sample size. To remedy this, other than adding participants, it is possible to vary the experimental conditions. For example, we could provide more maze layouts and goal locations for the participants to navigate.
We all need to rely on spatial navigation in our daily lives. Our findings suggest that familiarity with an environment and access to information regarding the environment’s structures and configuration, such as a map, can significantly reduce the cognitive load when navigating. In addition, attention to different types of information in the surroundings such as informative signposts and landmarks would determine the map learning and navigation efficiency.
This research has potential implications for designing wayfinding aids and improving training strategies for spatial learning. Our findings could then support populations who have difficulty with navigation and attention deficits, such as older populations or patients with memory impairments like Alzheimer’s disease and hyperactive attention deficits.
7. Conclusion
By designing a novel reseach platform NeuroNav for navigation and goal-directed behavior, I found that subjects paid different levels of attention to the visual features in the environment and reached the goal locations at different speeds. Through landmark viewing, visual scene processing, maze learning, subjects improved the efficiency of goal finding in two different locations. These behavioral changes were accompanied by neural signal changes in the EEG data. My project provides an opportunity to investigate the relationship between selective attention, memory, cognitive processing, and their neural substrates in goal-directed navigation.
References
[1]. Epstein, R. A., Patai, E. Z., Julian, J. B., & Spiers, H. J. (2017). The cognitive map in humans: spatial navigation and beyond. Nature neuroscience, 20(11), 1504-1513.
[2]. Diamond, A. (2013). Executive functions. Annual review of psychology, 64(1), 135-168.
[3]. Hofmann, W., Schmeichel, B. J., & Baddeley, A. D. (2012). Executive functions and self-regulation. Trends in cognitive sciences, 16(3), 174-180.
[4]. Tolman, E. C. (1948). Cognitive maps in rats and men. Psychological review, 55(4), 189.
[5]. Behrens, T. E., Muller, T. H., Whittington, J. C., Mark, S., Baram, A. B., Stachenfeld, K. L., & Kurth-Nelson, Z. (2018). What is a cognitive map? Organizing knowledge for flexible behavior. Neuron, 100(2), 490-509.
[6]. Cohen, M. X. (2017). Where does EEG come from and what does it mean? Trends in neurosciences, 40(4), 208-218.
Cite this article
Geng,A. (2025). Investigating Neural Mechanisms Underlying Landmark and Map-Learning in a Novel Goal-Directed Navigation Research Platform. Theoretical and Natural Science,152,183-198.
Data availability
The datasets used and/or analyzed during the current study will be available from the authors upon reasonable request.
Disclaimer/Publisher's Note
The statements, opinions and data contained in all publications are solely those of the individual author(s) and contributor(s) and not of EWA Publishing and/or the editor(s). EWA Publishing and/or the editor(s) disclaim responsibility for any injury to people or property resulting from any ideas, methods, instructions or products referred to in the content.
About volume
Volume title: Proceedings of ICMMGH 2026 Symposium: Biomedical Imaging and AI Applications in Neurorehabilitation
© 2024 by the author(s). Licensee EWA Publishing, Oxford, UK. This article is an open access article distributed under the terms and
conditions of the Creative Commons Attribution (CC BY) license. Authors who
publish this series agree to the following terms:
1. Authors retain copyright and grant the series right of first publication with the work simultaneously licensed under a Creative Commons
Attribution License that allows others to share the work with an acknowledgment of the work's authorship and initial publication in this
series.
2. Authors are able to enter into separate, additional contractual arrangements for the non-exclusive distribution of the series's published
version of the work (e.g., post it to an institutional repository or publish it in a book), with an acknowledgment of its initial
publication in this series.
3. Authors are permitted and encouraged to post their work online (e.g., in institutional repositories or on their website) prior to and
during the submission process, as it can lead to productive exchanges, as well as earlier and greater citation of published work (See
Open access policy for details).
References
[1]. Epstein, R. A., Patai, E. Z., Julian, J. B., & Spiers, H. J. (2017). The cognitive map in humans: spatial navigation and beyond. Nature neuroscience, 20(11), 1504-1513.
[2]. Diamond, A. (2013). Executive functions. Annual review of psychology, 64(1), 135-168.
[3]. Hofmann, W., Schmeichel, B. J., & Baddeley, A. D. (2012). Executive functions and self-regulation. Trends in cognitive sciences, 16(3), 174-180.
[4]. Tolman, E. C. (1948). Cognitive maps in rats and men. Psychological review, 55(4), 189.
[5]. Behrens, T. E., Muller, T. H., Whittington, J. C., Mark, S., Baram, A. B., Stachenfeld, K. L., & Kurth-Nelson, Z. (2018). What is a cognitive map? Organizing knowledge for flexible behavior. Neuron, 100(2), 490-509.
[6]. Cohen, M. X. (2017). Where does EEG come from and what does it mean? Trends in neurosciences, 40(4), 208-218.