


1. Introduction
Hadley Circulation (HC) is one of the crucial three-dimensional circulations working in the earth's climate. Near the equator, warmer air rises and moves poleward. During its path, it is cooled in the subtropics, then it subsides and flows to the tropical regions, so an enclosed system of circulation is formed in both hemispheres [1,2]. Greenhouse Gases (GHGs), consisting of major components including water vapor, carbon dioxide (CO2), Chlorofluorocarbons (CFCs), and methane are major factors resulting in global warming by trapping and absorbing outgoing long-wave radiation (OLR) emitted from ground [3]. After a great number of research done on the HC, it can be concluded that the widening of the HC is directly related to the increased GHGs [1,2,4,5]. The issues of HC are so concerning that the Fifth Assessment (AR5) Report of the Intergovernmental Panel on Climate Change (IPCC) has listed the expansion of the HC and its following climatic influence as a major topic to deal with. This paper aims to go through some of the influential studies already done researching the widening of the HC and to list out different results of the intensity of the HC concerning determinants taken into account. Besides, the possible impacts that the intensity of the HC leaves on the precipitation will be discussed in the later sections. Lastly, some limitations in the research will be pointed out, together with the opinions for studies in the future.
2. Increasing greenhouse gases and global temperature
As the behavior of human beings is becoming more and more influential, some experts have already defined this period as the Anthropocene and one of the most apparent changes observed is the amount of GHGs emitted into the atmosphere. The nature of global warming can be well explained by the rising amount of GHGs as the short-wave radiation emitted by the sun directly passes through the GHGs, being absorbed and re-radiated by the ground via the form of long-wave radiation. Consequently, the GHGs absorb the OLR and lead to the warming of the globe, exactly like the mechanism of greenhouse [3]. Global warming is a great concern to the whole international society because of its positive relationship with natural disasters: as the globe becomes hotter, more frequent and intensified natural disasters are observed [6]. As illustrated by Figure.1, global CO2 emissions from fossil fuels and land use change have risen dramatically since 1850. After more than a century, the amount of CO2 emissions had reached 37.12 billion tonnes in total by 2021, considering fossil fuels and land use change [7]. Figure.2 demonstrates the total GHG emissions over the past decades, and it's observed that the value had increased from somewhat more than 30 billion tonnes in 1990 to value of almost reaching 49.76 billion tonnes by 2019 [7]. Figure.3 and Figure.4 respectively reveal the change in concentration of CO2 in the atmosphere and the change in global temperature, where both the red, green, and blue lines are the projected future in different scenarios. From 1850 onwards until recent years, the CO2 concentration has risen from approximately 280 ppm to 420 ppm, whereas the change of global temperature since 1901 is approximately 2 ℉, both of which experiences an upward trend. As for the projected future, no matter which scenario is discussed, the final predicted value of CO2 concentration and global temperature is higher than the current value, suggesting an irreversible trend of continued global warming. These factors, combined, provide the premise for studying the extent of widening and intensity of the HC.
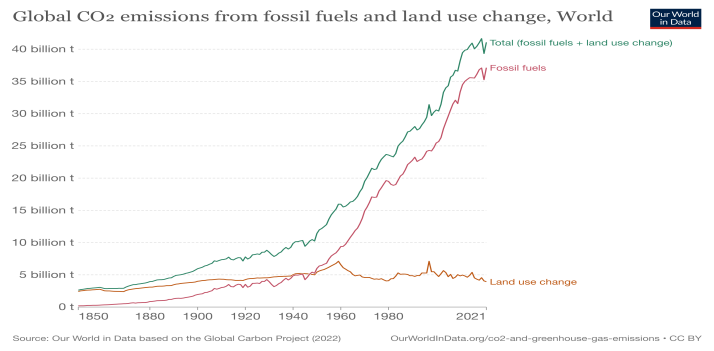
Figure 1. Annual global CO2 emission [7].
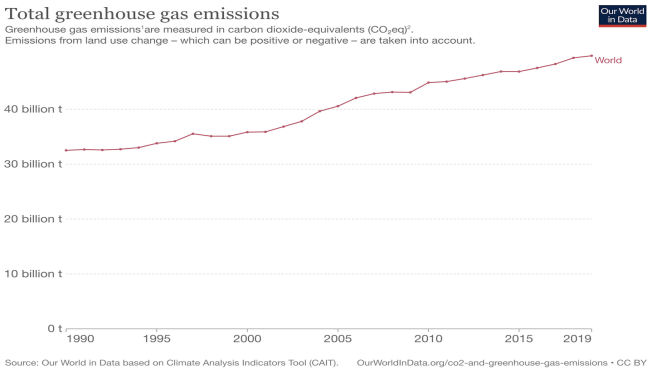
Figure 2. Annual total greenhouse gas emissions [7].
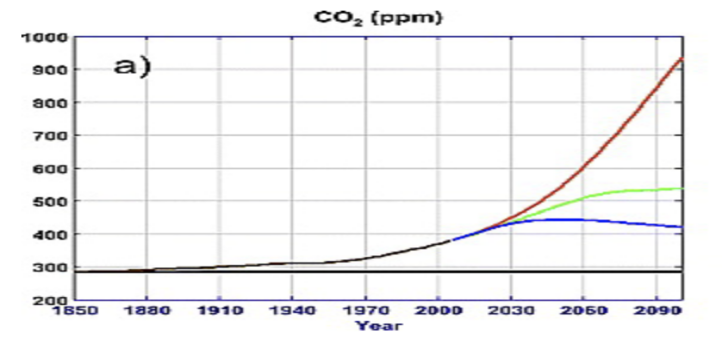
Figure 3. CO2 concentrations. (black-control, brown-historical, red-RCP 8.5, green-RCP 4.5, blue-RCP 2.6, RCP for future simulations) [8]
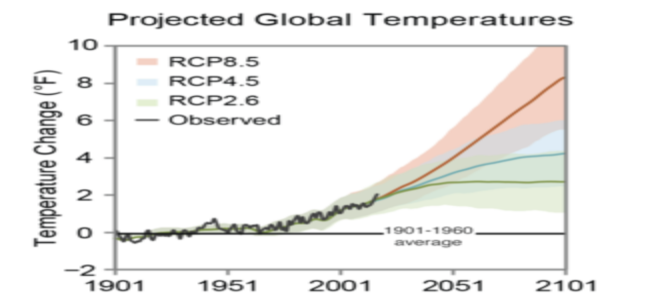
Figure 4. Projected global temperatures [9].
3. The pole-ward expansion of the hadley circulation
It could be confusing when defining the widening of the tropical atmospheric circulation since there are two terms that can both be used to characterize the widening. One of the terms is "widening (pole-ward expansion) of the HC" whereas the other terminology is "widening of the tropical belt". Here, the former definition shall be the main focus because this paper is mainly concentrated on the HC itself, while tropical belt may include broader meanings consisting of physical and chemical metrics which include but are not limited to precipitation, OLR, stratospheric depletion, etc. After figuring out the definition of the widening of the tropical atmospheric circulation, the subsequent problem is to define the width of the HC. In effect, the definition of width could be difficult to unify since each paper uses different proxy measures when measuring the edge of the HC. Nonetheless, in this paper, the location of the subtropical zero line of the mean meridional mass stream function is the definition of the width of the HC [4].
As for the intensity of the HC, Subtropical OLR is used as an effective proxy measure since the intensity and motion of the HC are correlated with each other. In general, a greater intensity of the HC will bring about a heightened descending motion which, in turn, results in more emissions of infrared radiation into space [5].
3.1 The forcing mechanism related to greenhouse gases
Even though there are four possible mechanisms contributing to the widening of the HC, the paper tends to focus solely on GHGs, for the aim of the paper is to find out the response of the HC to GHGs. According to simulations of Coupled Model Intercomparison Project Phase 3 (CMIP3), in the subtropical regions, the baroclinic eddies are attenuated due to the increasing static stability. The premise of this mechanism is based upon the global warming configuration in climate simulations, which means that in the subtropical regions, the lower troposphere is warmed less compared with the middle and upper tropospheres [1].
Changes in thermal structure contrast around the tropopause trigger the widening of the HC as well, and this mechanism is linked with GHGs to some extent, for the process of tropospheric warming and stratospheric cooling are the consequences of the increased GHGs in the atmosphere. Apart from the rising amount of GHGs, stratospheric ozone depletion also acts as an important role which contributes to stratospheric cooling. By combining the two factors, the meridional temperature contrasts between the upper troposphere and the lower stratosphere are sharpened. As a result, in the region of extratropics, the westerly winds undergo acceleration, leading to the increased phase speed for the baroclinic eddies in the upper troposphere. Lastly, the ultimate consequence is a result of the inability of the high-speed eddies to penetrate as far equatorward, which brings about a pole-ward shift in eddy momentum flux convergence and an associated pole-ward shift of the position of the eddy-driven subtropical jet and widening of the HC [4].
3.2 Seasonal variation of the HC widening
The seasonal variation of the HC widening can have large differences in values for different months throughout the year. In Figure.5, the pole-ward expansion of the edges of the HC is illustrated. The graph covers both hemispheres since NH stands for the Northern Hemisphere (NH) and SH means the Southern Hemisphere (SH). It is worth mentioning that the seasons are very likely to be contrasted in NH and SH at any time. This is because the point at which the vertical solar rays incident moves between the Tropic of Cancer and the Tropic of Capricorn throughout the year. As illustrated by Figure.5, in summer and winter both NH and SH have the most highlighted statistical values in terms of HC widening trends. In contrast, the widening trends of the HC in winter and spring, are suggested by the smaller statistical values and relatively short bars on the graph. Among all the seasons in NH and SH, boreal autumn in NH performs the greatest widening trend in the simulation. The reason behind these phenomena is worth considering, and the driving mechanism mentioned beforehand may provide some hints. In regions of extratropics in NH, tropospheric ozone and black carbon are the main contributors which facilitate HC widening in that their warming effect is largest in the extratropics of NH [10]. As aforementioned, ozone depletion is one of the causes of the HC widening, The effect of ozone depletion is amplified in SH since Antarctic Ozone Hole is the major location of ozone depletion which creates the greatest effect of radiative cooling in the lower stratosphere in the austral summer [11].
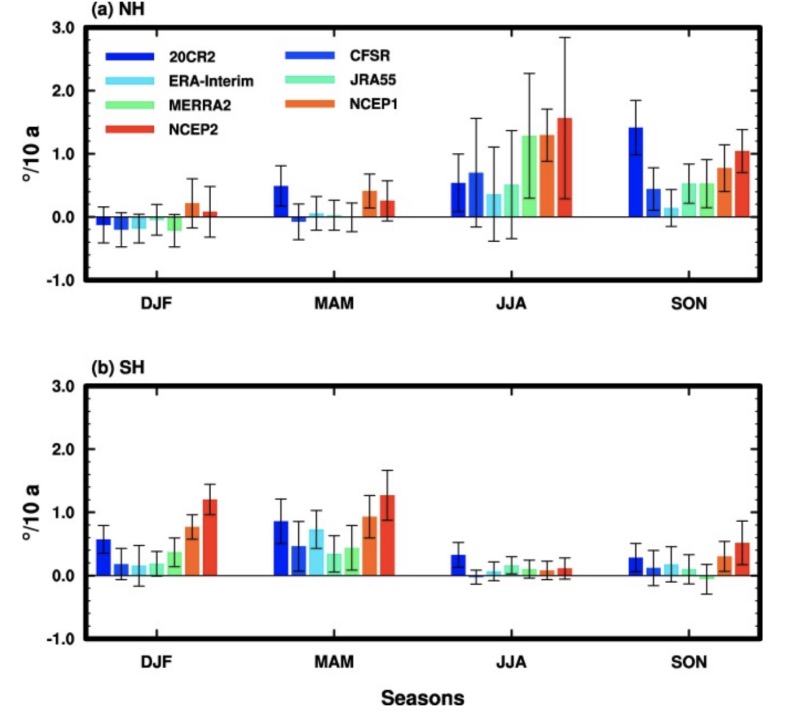
Figure 5. Widening of the Hadley circulation for four seasons: December-January-February (DJF), March-April-May (MAM), June-July-August (JJA), and September-October-November (SON), derived from seven reanalysis datasets. (a) NH, and (b) SH. The trends are calculated from 1979-2016. The unit of the vertical axis is degree per decade. Error bars are ±1.7 standard deviations [2].
3.3 The degree of widening (Simulations versus simulations and simulations versus observations)
Heaps of studies have been conducted on the extent of the widening of the HC. One crucial goal is to distinguish the difference between the observed changes and the simulated changes. In scenarios of Model Intercomparison Program Phase 5 (CMIP5), simulated results are based on and assessed by the individual factors and their combined impact on the widening trend of the HC. As has been previously mentioned, increasing GHGs, stratospheric ozone depletion, tropospheric ozone, and black carbons all contribute to the widening of the HC, though the impact is different concerning different hemispheres and seasons. Nonetheless, SST may be considered as a factor leading to widening as well, even though its role in the widening mechanism hasn't been thoroughly discussed. Hu and Fu (2007) provided an assumption that linked increasing GHGs with SST. They believed the increasing GHGs results in a warmer tropical SST. Subsequently, the broader HC turns out to be a result together with a higher tropical tropopause height [2]. Although the correlation between GHGs and SST is now clearer, their relationship in real life could be more subtle. The trend of widening tends to be larger for simulations with prescribed observed SST compared with the widening trend generated in CMIP5 scenarios [12]. Another simulation investigates the prescribed observed SST as well, and it argues that compared with GHGs, natural SST variations are more likely to be the reason responsible for the widening trend in the NH cell.
Moreover, the widening trend itself has dissimilarity between the simulation and observation. The outcome of the observed widening trends is much larger than that of the simulated widening trends[13,14]. While the outcome from the CMIP5 historical simulations is about 0.17° per decade, the result from the reanalysis datasets is 6 times larger than the CMIP5 historical simulations. Again, SST might be attributed to the phenomenon. The possible reason behind this could be the non-ideal performances of models in simulating SST temporal-spatial variations [4].
Not only do dissimilarities take place between simulations and observations. Different results might be derived from variable simulations. By applying Fourth Assessment Report (AR4) A2 scenario, Lu et al. managed to gain the relation between latitudinal expansion and temperature change, and the result turned out to be ~0.6° latitude/Kelvin. As for features, simulated results highly resembled the observed HC pattern during 1979-2005, where near equator latitudinal distribution has the lowest local warming and near subtropics there's the highest local warming. In high latitudes of the Northern Hemisphere, there was warming amplification [1]. However, Fu et al. (2006) estimated the HC expansion to be ~2° latitude in 1979-2005. Meanwhile, global temperature rose 0.5°C, so the actual HC widening was ~4° latitude/K [2]. Such a huge difference is mainly due to the factors they respectively took into account. For Lu et al. (2007), they solely listed GHGs forcing into consideration whereas Fu et al. (2006) considered ozone depletion, natural climate variability, and a list of other potential contributors. In effect, both of these outcomes have their values in the field of research. The result of ~0.6° latitude/K is a great example of controlling variables, and the estimation was purely based on the relation between GHGs and widening. The result of ~4° latitude/K, on the contrary, was more realistic because the researchers thoroughly considered the chain effects that might take place as a consequence of the increasing GHGs. This considerate measurement tends to be more suitable to real-life scenarios, despite the mechanisms of the chain effect yet to be explained.
3.4 Whether it's strengthening or weakening?
The conclusion of this topic is yet to be solved because, once again, the simulated results provided contrasting outcomes. Moreover, on a decadal or even larger scale, the future of the Earth system is too hard to be estimated due to its complexity. Therefore, the views on this topic can only be discrete based on the observations and simulations already made.
Using European Centre for Medium-Range Weather Forecasts (ERA40), the reanalysis datasets produced inconsistent results in terms of the HC strength under the background of global warming. Although an outcome is generated, indicating an enormously large widening trend, the existence of an artificial trend was difficult to be eliminated. For example, the trend of tropical precipitation turned out to be of unrealistic result [5].
For simulations conducted by CMIP5, both the historical and the projected simulations tend to follow the pattern of a weakening trend, accompanying its trend of widening [1]. GHGs and ozone are two factors that have been discussed separately. Increasing GHGs tend to produce results suiting the historical and projected simulations, that is, widening and weakening of the HC. Ozone produces different outcomes where SH is more impacted than NH, leading to a weakening trend. Though anthropogenic aerosols are simulated as well, no specific impact is worthy of noticing [4].
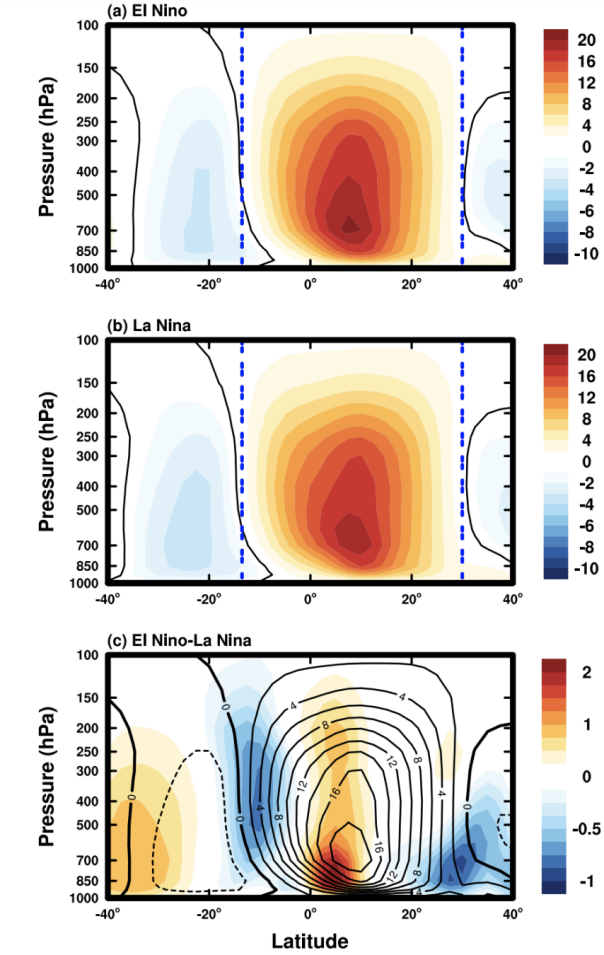
Figure 6. Comparison of the Hadley circulation in DJF between compositions of El Nino and La Nina events. El Nino compositions are the events of 1982/1983, 1987/1988,1992/1993, 1997/1998, 2002/2003. La Nina compositions are the events of 1985/1986,1988/1989, 1999/2000, 2000/2001, 2007/2008, 2010/2011. The mass stream functions are calculated from NCEP2 reanalysis. Solid lines denote clockwise mass stream functions, and dashed lines denote anti-clockwise mass stream functions. In all the plots, the unit is 1.0×10⁹ kg s-1[4].
El Nino and La Nina events could also be triggers to the changes of the HC. As illustrated by Figure.6, in times of El Nino events, the HC tends to be stronger and narrower whereas in periods of La Nina, the opposite result will take place [4]. Piles of work have been done, which supports an anti-relation between the strength and width of the HC.
Radiative forcing has proved to be a factor influencing the simulation results which combine CMIP5 and SST [4]. Though the fact is definite that SST has an impact on the strength and width of the HC, so few studies have been done on this topic, therefore providing no valid explanations for the mechanisms yet.
4. The impact of the change of the hadley circulation
Having discussed the possible trend in terms of width and strength for the HC under the background of increasing GHGs, the last section of this paper is briefly going through the possible outcomes of climatic changes after experiencing the change of the HC.
William and Kim (2015) had already conducted simulations via CMIP5 and managed to find out a correlation between a strengthened HC and global dryness. The strengthened HC manifested in a "deep-tropics squeeze" (DTS) which induces atmospheric moisture divergence and decreases tropospheric relative humidity in regions of tropics and subtropics, in conjunction with a widening and subsiding branches of the HC [15]. The result of suppressed rainfall and a reduction in the tropospheric humidity adds more possibility to global dryness, which is very likely to contribute to prolonged droughts in the forthcoming decade.
To be more microscopic, the change of the HC may leave certain impacts according to the geographical location. Take northeastern China as an example, the strengthened winter HC may lead to interdecadal intensification of snowfalls under the premise of climate change [16]. The northeastern region of China is merely an example that has been and will be affected by the change and potential changes of the HC, but the true case is that every part of the world will become an impact-taker, and the increasing number of climatic anomalies will appear as a result of increasing GHGs and changing HC.
5. Conclusion
To summarize, the fact that the world has been in the quagmire of global warming is undeniable as the dramatically increasing emissions of GHGs, characterized by the typical GHGs--CO2, have already led to an increase in global temperature. The increase in GHGs emissions has further led to the pole-ward expansion of the HC by a rate of approximately ~4° latitude/K, for this rate considerately lists a great number of variables into account. The seasonal variation of the HC widening is discrete in NH and SH in that the factors leading to widening are not the same. SH tends to be impacted more by ozone depletion while for NH, tropospheric ozone and black carbon play more important roles. Despite these differences, one thing that NH and SH share in common is that summer and autumn are the seasons that have the largest widening trends. The degree of widening is controversial, and the same situation is for the intensity of the HC since there's no definite conclusion even nowadays. Globally speaking, the strengthened HC will result in global dryness and prolonged droughts due to the suppressed rainfall and reduced tropospheric humidity, and regionally speaking more and more climatic anomalies might take place soon, eg. The intensified snowfall in the northeastern region of China is a result of strengthened winter HC.
References
[1]. Lu J, Vecchi GA, Reichler T. “Expansion of the Hadley cell under global warming”. Geophysical Research Letters. 2007 Mar;34(6).
[2]. Hu, Y., and Qinjun Fu. "Observed poleward expansion of the Hadley circulation since 1979." Atmospheric Chemistry and Physics 7.19 (2007): 5229-5236.
[3]. Lashof, Daniel A., and Dilip R. Ahuja. "Relative contributions of greenhouse gas emissions to global warming." Nature 344.6266 (1990): 529-531.
[4]. Hu, Yongyun, Han Huang, and Chen Zhou. "Widening and weakening of the Hadley circulation under global warming." Science Bulletin 63.10 (2018): 640-644.
[5]. Hu, Yongyun, Chen Zhou, and Jiping Liu. "Observational evidence for poleward expansion of the Hadley circulation." Advances in Atmospheric Sciences 28 (2011): 33-44.
[6]. Bindoff NL, Stott PA, AchutaRao KM, et al. Detection and Attribution of Climate Change: from Global to Regional. In: Climate Change 2013: The Physical Science Basis. Contribution of Working Group I to the Fifth Assessment Report of the Intergovernmental Panel on Climate Change [Stocker TF, Qin D, Plattner G-K, et al. (eds)]. Cambridge University Press, 2013, Cambridge, United Kingdom and New York, NY, USA.
[7]. Ritchie, Hannah, Max Roser, and Pablo Rosado. "CO₂ and greenhouse gas emissions." Our world in data (2020).
[8]. Arora, Vivek K., et al. "Carbon emission limits required to satisfy future representative concentration pathways of greenhouse gases." Geophysical Research Letters 38.5 (2011).
[9]. https://www.researchgate.net/
[10]. Allen, Robert J., et al. "Recent Northern Hemisphere tropical expansion primarily driven by black carbon and tropospheric ozone." Nature 485.7398 (2012): 350-354.
[11]. Polvani, Lorenzo M., et al. "Stratospheric ozone depletion: The main driver of twentieth-century atmospheric circulation changes in the Southern Hemisphere." Journal of Climate 24.3 (2011): 795-812.
[12]. Tao, Lijun, Yongyun Hu, and Jiping Liu. "Anthropogenic forcing on the Hadley circulation in CMIP5 simulations." Climate Dynamics 46 (2016): 3337-3350.
[13]. Johanson, Celeste M., and Qiang Fu. "Hadley cell widening: Model simulations versus observations." Journal of Climate 22.10 (2009): 2713-2725.
[14]. Hu, Yongyun, Lijun Tao, and Jiping Liu. "Poleward expansion of the Hadley circulation in CMIP5 simulations." Advances in Atmospheric Sciences 30 (2013): 790-795.
[15]. Lau, William KM, and Kyu-Myong Kim. "Robust Hadley circulation changes and increasing global dryness due to CO2 warming from CMIP5 model projections." Proceedings of the National Academy of Sciences 112.12 (2015): 3630-3635.
[16]. Zhou, Botao, Zunya Wang, and Ying Shi. "Possible role of Hadley circulation strengthening in interdecadal intensification of snowfalls over northeastern China under climate change." Journal of Geophysical Research: Atmospheres 122.21 (2017): 11-638.
Cite this article
Liu,Z. (2023). The change of hadley circulation corresponding to the increase of greenhouse gases in the atmosphere, and possible outcomes of precipitation. Theoretical and Natural Science,7,12-20.
Data availability
The datasets used and/or analyzed during the current study will be available from the authors upon reasonable request.
Disclaimer/Publisher's Note
The statements, opinions and data contained in all publications are solely those of the individual author(s) and contributor(s) and not of EWA Publishing and/or the editor(s). EWA Publishing and/or the editor(s) disclaim responsibility for any injury to people or property resulting from any ideas, methods, instructions or products referred to in the content.
About volume
Volume title: Proceedings of the 2023 International Conference on Environmental Geoscience and Earth Ecology
© 2024 by the author(s). Licensee EWA Publishing, Oxford, UK. This article is an open access article distributed under the terms and
conditions of the Creative Commons Attribution (CC BY) license. Authors who
publish this series agree to the following terms:
1. Authors retain copyright and grant the series right of first publication with the work simultaneously licensed under a Creative Commons
Attribution License that allows others to share the work with an acknowledgment of the work's authorship and initial publication in this
series.
2. Authors are able to enter into separate, additional contractual arrangements for the non-exclusive distribution of the series's published
version of the work (e.g., post it to an institutional repository or publish it in a book), with an acknowledgment of its initial
publication in this series.
3. Authors are permitted and encouraged to post their work online (e.g., in institutional repositories or on their website) prior to and
during the submission process, as it can lead to productive exchanges, as well as earlier and greater citation of published work (See
Open access policy for details).
References
[1]. Lu J, Vecchi GA, Reichler T. “Expansion of the Hadley cell under global warming”. Geophysical Research Letters. 2007 Mar;34(6).
[2]. Hu, Y., and Qinjun Fu. "Observed poleward expansion of the Hadley circulation since 1979." Atmospheric Chemistry and Physics 7.19 (2007): 5229-5236.
[3]. Lashof, Daniel A., and Dilip R. Ahuja. "Relative contributions of greenhouse gas emissions to global warming." Nature 344.6266 (1990): 529-531.
[4]. Hu, Yongyun, Han Huang, and Chen Zhou. "Widening and weakening of the Hadley circulation under global warming." Science Bulletin 63.10 (2018): 640-644.
[5]. Hu, Yongyun, Chen Zhou, and Jiping Liu. "Observational evidence for poleward expansion of the Hadley circulation." Advances in Atmospheric Sciences 28 (2011): 33-44.
[6]. Bindoff NL, Stott PA, AchutaRao KM, et al. Detection and Attribution of Climate Change: from Global to Regional. In: Climate Change 2013: The Physical Science Basis. Contribution of Working Group I to the Fifth Assessment Report of the Intergovernmental Panel on Climate Change [Stocker TF, Qin D, Plattner G-K, et al. (eds)]. Cambridge University Press, 2013, Cambridge, United Kingdom and New York, NY, USA.
[7]. Ritchie, Hannah, Max Roser, and Pablo Rosado. "CO₂ and greenhouse gas emissions." Our world in data (2020).
[8]. Arora, Vivek K., et al. "Carbon emission limits required to satisfy future representative concentration pathways of greenhouse gases." Geophysical Research Letters 38.5 (2011).
[9]. https://www.researchgate.net/
[10]. Allen, Robert J., et al. "Recent Northern Hemisphere tropical expansion primarily driven by black carbon and tropospheric ozone." Nature 485.7398 (2012): 350-354.
[11]. Polvani, Lorenzo M., et al. "Stratospheric ozone depletion: The main driver of twentieth-century atmospheric circulation changes in the Southern Hemisphere." Journal of Climate 24.3 (2011): 795-812.
[12]. Tao, Lijun, Yongyun Hu, and Jiping Liu. "Anthropogenic forcing on the Hadley circulation in CMIP5 simulations." Climate Dynamics 46 (2016): 3337-3350.
[13]. Johanson, Celeste M., and Qiang Fu. "Hadley cell widening: Model simulations versus observations." Journal of Climate 22.10 (2009): 2713-2725.
[14]. Hu, Yongyun, Lijun Tao, and Jiping Liu. "Poleward expansion of the Hadley circulation in CMIP5 simulations." Advances in Atmospheric Sciences 30 (2013): 790-795.
[15]. Lau, William KM, and Kyu-Myong Kim. "Robust Hadley circulation changes and increasing global dryness due to CO2 warming from CMIP5 model projections." Proceedings of the National Academy of Sciences 112.12 (2015): 3630-3635.
[16]. Zhou, Botao, Zunya Wang, and Ying Shi. "Possible role of Hadley circulation strengthening in interdecadal intensification of snowfalls over northeastern China under climate change." Journal of Geophysical Research: Atmospheres 122.21 (2017): 11-638.