


1. Introduction
ENSO is recognized as a highly influential internal climate phenomenon that occurs on an interannual scale. It is marked by large changes in sea surface temperatures that typically happen once every four years in the equatorial Pacific region, specifically the eastern and central portions. El Niño, the heated extreme of this phenomena, is distinguished from La Niña, the cold extreme.
The ENSO phenomenon represents a natural oscillation within the ocean-atmosphere system, comprising two constituents: the Southern Oscillation and El Niño. Recent research has demonstrated the intrinsic connection between these two phenomena, indicating that they represent distinct yet interconnected manifestations of the same phenomenon in different domains of the atmosphere and ocean. Rather than being a singular event, ENSO operates as a cyclic process known as the ENSO cycle.
In most cases, the occurrence of an El Niño (or a La Niña) is determined by the monthly sea surface temperature anomaly (SSTA), which is quantified using a sea temperature index for the monitoring area. In other words, El Niños and La Niñas are both cyclical weather patterns. It is determined to be an El Niño (or a La Niña) event when the sea surface temperature anomaly (SSTA) for a minimum of two consecutive quarters either rises above or equals 0.5 degrees Celsius or falls below or equals -0.4 degrees Celsius.
Abnormal SSTA oscillations are El Niño indicators. Long-term fluctuations occur. Kiladis and van Loon (1988) defined an “event” using the standard Southern Oscillation Index (SOI) and the Eastern Tropical Pacific SST anomaly index (160°W to the South American coast, within 4° of the equator). Both indexes span 160°W to the South American coast. The SOI must stay below -1.0 for the same amount of time, and the SST anomaly must be positive and greater than 0.5 degrees Celsius above the mean for at least three seasons.
The Nino 3.4 zone extends into the southern hemisphere and is an important area for the research of ENSO. Its coordinates are 170 degrees west to 120 degrees west and 5 degrees south to 5 degrees north. It is broken up into sub-regions that fall under the Nino3 and Nino4 umbrellas. ENSO events in this region are better classified using a threshold of 0.3 degrees Celsius. The importance of SST was reevaluated at the Climate Prediction Center of the NOAA. In April of 1996, the organization's monthly Climate Diagnostic Bulletin noted the presence of Nino 3.4. This index covers the latitude range of 5°N to 5 °S, as well as 120 °W to 170 °W. When the index value hits 0.4, the occurrence of El Nio is confirmed. The occurrence of a La Nia is depicted in Figure 1 [1]. This occurs when the index value falls below the threshold.
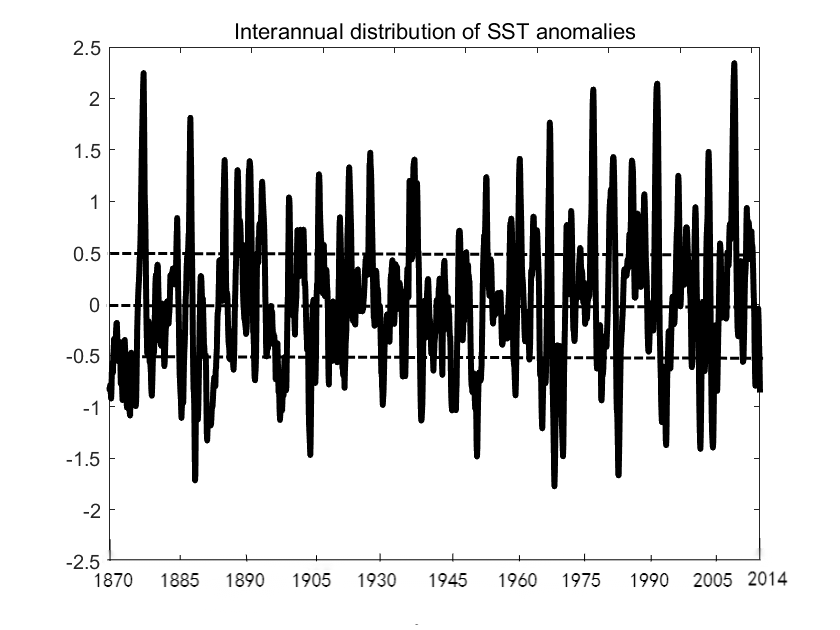
Figure 1. Interannual distribution of SST anomalies.
The occurrence of El Niño is characterized by an abnormal rise in water temperature within the central and eastern areas of the equatorial Pacific Ocean, whereas the occurrence of La Niña demonstrates the opposite trend, as seen in the figure below (Figure 2). Conditions of El Niño can last for up to a year and may transition into conditions of La Nia, which normally last for an average of one to two years. El Niño conditions can remain for up to a year.
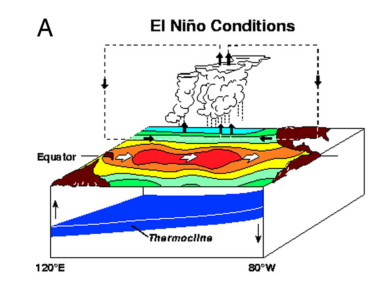
Figure 2. El Niño and La Niña [1].
The study of ENSO holds significant implications for humanity. Numerous research studies have demonstrated that ENSO profoundly influences atmospheric circulation and leads to weather and climate anomalies in various regions worldwide. During ENSO, the eastern equatorial Pacific experiences ongoing warming, which directly impacts tropical atmospheric circulation. The resulting changes in tropical atmospheric circulation also affect global atmospheric circulation, leading to a series of weather and climate anomalies on a global scale. ENSO events not only have a direct influence on the local climate and environment in their immediate vicinity but also affect precipitation and rice yield in India, a region far away from the northern coast of the Indian Ocean, during both La Niña and El Niño occurrences.
Therefore, the study of ENSO is of immense significance for climate prediction and the mitigation of natural disasters.
2. Mechanism
The formation of ENSO is determined by two mechanisms: the production mechanism and the regulation mechanism.
2.1. The production mechanism
The Bjerknes feedback evaluates ENSO event generation [2]. The Bjerknes feedback accelerates initial disturbances, random perturbations that raise eastern Equatorial Pacific sea surface temperatures (SST). Sea surface temperature (SST) deviation breaks the Pacific Ocean's zonal gradient, causing aberrant warming in the east. This disturbs the Walker circulation, lowering Pacific surface pressure and pressure gradient. Zonal wind stress near the equator decreases. The decreased surface wind stress diminishes the thermocline's inclination and hinders eastern cold water upwelling. Positive SST anomalies intensify. As the SST gradient diminishes, a chain of events leads to El Niño. Colder SST increases pressure gradient, zonal wind stress, and Walker circulation. Wind stress increases the SST gradient, causing La Niña through positive feedback.
Currently, another diagnostic equation is employed to determine the development trend of ENSO. Heat budget analysis of temperature trends across the mixed layer of the ocean has been utilized to assess the contribution of different processes to the development of three El Niños. The diagnostic equation can be derived in the following manner:
\( \frac{∂{T^{ \prime }}}{∂t}=-({V^{ \prime }}·∇\overline{T}+\overline{V}·∇{T^{ \prime }}+{V^{ \prime }}·∇{T^{ \prime }})+\frac{{Q_{net}}}{ρ{C_{p}}H}+R \) \( =-[(\frac{{u^{ \prime }}∂\overline{T}}{∂x}+\frac{\overline{u}∂{T^{ \prime }}}{∂x}+\frac{{u^{ \prime }}∂{T^{ \prime }}}{∂x})+(\frac{{v^{ \prime }}∂\overline{T}}{∂y}+\frac{\overline{v}∂{T^{ \prime }}}{∂y}+\frac{{v^{ \prime }}∂{T^{ \prime }}}{∂y})+(\frac{{w^{ \prime }}∂\overline{T}}{∂z}+\frac{\overline{w}∂{T^{ \prime }}}{∂z}+\frac{{w^{ \prime }}∂{T^{ \prime }}}{∂z})]+\frac{{Q_{net}}}{ρ{C_{p}}H}+R \)
① ② ③ ④ ⑤
Among these terms, ①, ③ and ④ represent positive feedback terms for ENSO. When these three terms are significant, ENSO events are likely to be triggered. Conversely, when ② and ⑤ are large, or when ①, ③, and ④ are small, the generation of ENSO events becomes challenging.
2.2. Period
The expansion of ENSO can be explained by the Bjerknes feedback, but understanding its rhythmic phase reversal requires the development of a theoretical framework. In order to sustain oscillations in the ocean-atmosphere linked system, negative feedback mechanisms are crucial. Previous research has identified four feedback mechanisms that counteract the El Niño-Southern Oscillation (ENSO): delayed oscillation, recharge-discharge oscillation, western Pacific oscillation, and flow-reflection oscillation. These mechanisms collectively contribute to the interannual oscillations of ENSO. Wang [2] extensively studied ENSO oscillation patterns using the Zebiak and Cane's coupled ocean-atmosphere model, incorporating both thermodynamic and dynamic aspects. The objective was to construct a comprehensive oscillation model that integrates the fundamental principles observed in previous ENSO models, while recognizing ENSO as a multi-mechanism phenomenon with variable importance over time. Wang's unified oscillation model was developed through an analysis of ENSO interannual anomalies in the Eastern and Western Pacific regions.
\( \frac{dT}{dt}=a{τ_{1}}-{b_{1}}{τ_{1}}(t-η)+{b_{2}}{τ_{2}}(t-δ)-{b_{3}}{τ_{1}}(t-μ)-ε{T^{3}} \) (1)
\( \frac{dh}{dt}=-c{τ_{1}}(t-λ)-{R_{h}}h \) (2)
\( \frac{d{τ_{1}}}{dt}=dT-{R_{τ1}}{τ_{1}} \) (3)
\( \frac{d{τ_{2}}}{dt}=eh-{R_{τ2}}{τ_{2}} \) (4)
Four variables, denoted as T, h, τ1, and τ2, represent distinct quantities in the context of this study. T corresponds to the anomaly in sea surface temperature (SST) in the eastern equatorial Pacific, h represents the anomaly in thermocline depth in the western equatorial Pacific, while τ1 and τ2 denote the anomalies in zonal wind stress in the central and western equatorial Pacific, respectively. It is important to note that all model parameters remain constant throughout. Equations (1-4) demonstrate oscillatory patterns on an interannual time scale for a given set of parameters.
Bjerknes's positive feedback is represented by the right-hand term of equation (1). The subsequent terms in equation (1) demonstrate negative feedback resulting from wave reflection at the western ocean boundary and the impact of wind-driven waves in the western Pacific. Additionally, wave reflection at the eastern ocean limit is accounted for as the fourth component. The relationship between the Western Pacific off-equator thermocline anomaly and the central equatorial Pacific zonal wind stress anomaly is described by equation (2). Equations (3) and (4) indicate that the zonal wind stress anomaly in the central equatorial Pacific is influenced by the eastern Pacific SST anomaly and controlled by the western Pacific thermocline anomaly, respectively [3]. In Figure 3, the simplification and assumptions applied to equation (1-4) are illustrated, highlighting the reduction of the unified oscillation into the four previous ENSO oscillations.
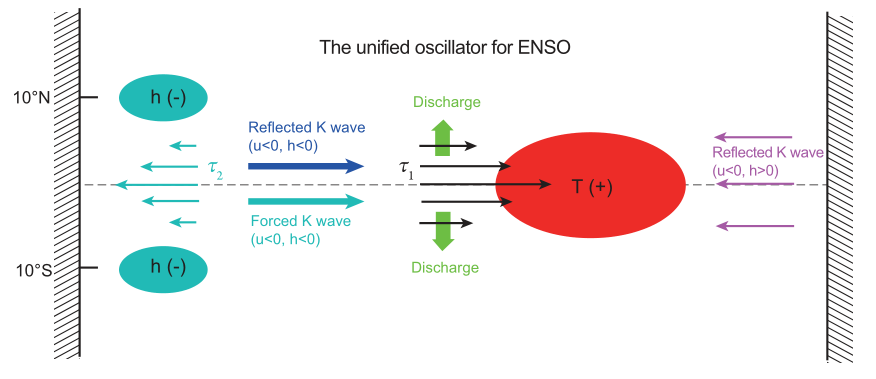
Figure 3. Schematic diagram of the unified oscillator [3].
3. Influence
3.1. Impact on drought and flood events in China
To identify and predict droughts in China, Nino3.4 and the Multivariate ENSO Index (MEI) are useful markers for defining ENSO. Drought conditions in China can spread from the tropical southern regions, including the hilly plains of Fujian, Guangdong, and Guangxi, and the mountainous central Yunnan, extending northward to the cold temperate zones of the country. These findings suggest a noteworthy association between arid and semi-arid regions and the most intense El Niño events, spanning from southeastern coastal regions to the interior of China [4] Therefore, strong El Niño events have the potential to trigger droughts in arid tropical, temperate, and inland arid regions within China. As opposed to that, the impact of weak El Niño events on drought in China is relatively limited in comparison. Arid regions in China display a more pronounced response to the most intense El Niño events, leading to a brief time delay between these events and their influence on China, as observed in the study by Yang et al. [5].
Variations in sea surface temperature (SST) have an impact on the exchange of water vapor, which in turn influences the occurrence of droughts and floods. The most notable pattern is the abrupt transition between dry and wet conditions, characterized by periods of minimal or no precipitation followed by intense rainfall and flooding. This transition event is preceded by a six-month period during which the SST in the western Pacific region warms, while the eastern equatorial Pacific experiences cooling. The center of the SST anomaly is located in the Nino 3.4 zone, spanning from 5 °N to 5 °S and 150 °W to 130 °W. The peak of the SST anomalies is observed two months prior to the abrupt transition event. During the event month, the cool anomaly weakens and shifts eastward towards 110°W. Notably, the intensity of the sudden drought-to-flood occurrences correlates with an increase in the SST anomaly in the eastern equatorial Pacific.
Prior to the occurrence of abrupt drought-to-flood transition events, a large proportion of events (52.83%) in the Nino 3.4 region exhibit abnormally low SST (La Niña and SST outliers lasting for 12 months < 0), while the occurrence of high SST anomalies (El Niño, SST outliers lasting for 12 months > 0) accounts for only 22.22% of the events. This suggests that summer abrupt drought-to-flood transition events typically take place when the SST in the Nino 3.4 zone is persistently unusually low in the middle and lower sections of the Yangtze River basin [6].
The aforementioned findings suggest a possible association between the abrupt changes in drought and flood events during the summer season in the middle and lower regions of the Yangtze River basin and abnormally low sea surface temperatures (SST) in the Nino 3.4 region.
3.2. Impact on monsoon
ENSO, specifically during La Niña and El Niño years, affects the spatial distribution of the Asian monsoon system components. These variations result in a shift from their typical positions. This relationship suggests that the East Asian monsoon is influenced by ENSO dynamics [7].
Impact on summer monsoon. Following El Niño, the summer 500 hPa height field exhibits abnormalities attributed to the elevated sea surface temperature (SST) anomaly in the eastern equatorial Pacific during January to March. In June, Figure 4a highlights a significant positive anomaly region in Asia and the Western Pacific, spanning from 20 °N to 42 °N. The strengthening and westward expansion of the Western Pacific subtropical high can be observed [8]. Additionally, Figure 4b depicts a monthly anomalous trend characterized by a negative anomaly zone stretching from southwest China to northern Japan.
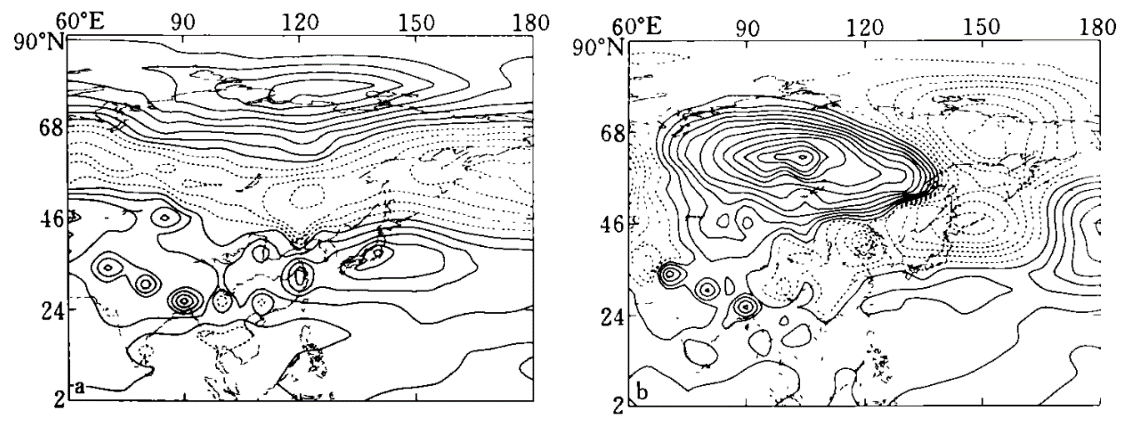
Figure 4. Anomalies in the 500 hPa height field in Asia and the Western Pacific caused by positive SST in the eastern equatorial Pacific during January to March. a and b represent the average conditions in June and July, respectively [8].
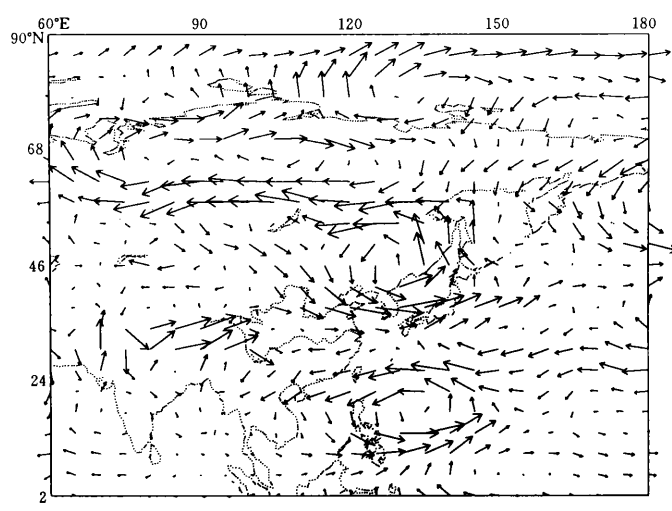
The summer 850 -hPa wind field experiences notable abnormalities due to the sea surface temperature (SST) anomaly in the eastern equatorial Pacific, specifically during the months of January to March [8]. This condition is quite similar to the one that occurs at 500 -hPa. The average distribution of anomalous vector winds is shown in Figure 5 over Asia and the Western Pacific from June to August. This distribution shows that there is an anticyclonic circulation over the Western Pacific and eastern China (22 °N to 38 °N). This demonstrates that both the continental and Western Pacific subtropical highs will strengthen as a result of the influence of cyclonic circulation in the atmosphere.
| Figure 5. Average anomalies in the 850hPa vector wind field over Asia and the Western Pacific in June and August caused by positive SST in the eastern equatorial Pacific during January and March [8]). |
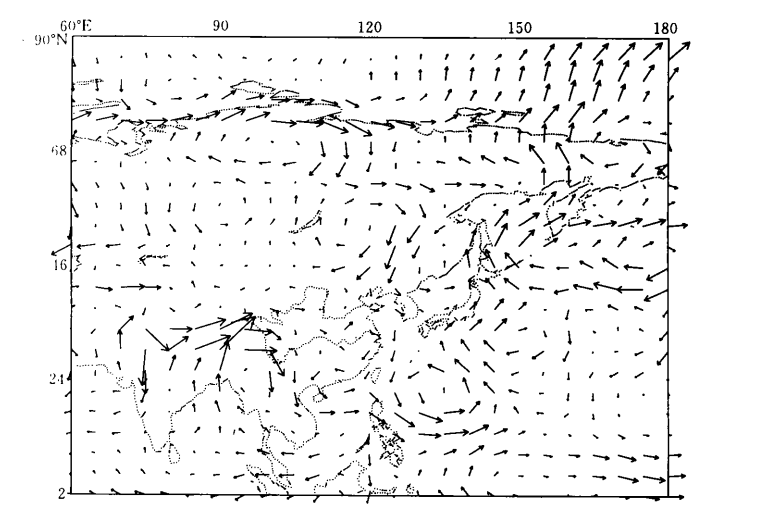
Conversely, in La Niña years, the negative SST anomaly in the eastern equatorial Pacific also significantly impacts atmospheric circulation and climate during East Asian summer. The abnormal pattern is neither completely opposite nor entirely similar to the positive influence. Under the positive SST influence, the 500 hPa height anomaly over Asia and the Western Pacific during summer predominantly exhibits a zonal pattern. Under the negative SST influence, however, the 500 hPa height anomaly over Asia and the Western Pacific during summer mainly displays a northeast-southwest zonal pattern, with positive anomaly zones extending from South China to east Japan. Negative anomaly zones are observed from the Bay of Bengal to Sakhalin Island, and positive anomaly zones stretch from north India to the east of Lake Belga. Figure 6 illustrates the presence of abnormal subtropical high centers in the Jiangnan region of China and the Western Pacific. These abnormal centers are accompanied by a cyclonic vorticity zone in the 850 hPa flow field diagram, spanning from northeast China to the east of the Philippines. Additionally, weak anomalous anticyclones are observed to the west (covering the middle and lower reaches of the Yangtze River in China) and to the east (Figure 6).
| Figure 6. Anomalies in the 850hPa vector wind field over Asia and the Western Pacific caused by negative SST in the eastern equatorial Pacific during January to March [8]. |
Impact on winter monsoon. The impact of SST anomalies in the equatorial eastern Pacific during El Niño persists into the subsequent winter and significantly affects the East Asian winter monsoon activity. Figure 7a illustrates the characteristic anomaly pattern in the 500 hPa height field resulting from the positive SST anomalies in the equatorial eastern Pacific during the months of January to March, which extends into the winter season from December to February. The greatest absolute value of the 500 hPa height anomaly in Asia and the Western Pacific is greater than 50 gpm, and East Asia as a whole is characterized by negative anomalies, which indicates a deepening of the East Asian trough. This is evidenced by the fact that the maximum absolute value of the 500 hPa height anomaly in East Asia is greater than 50 gpm. This indicates that the activity of cold wave phenomena during the winter in East Asia will be more intense [8]. The anomalous scenario that corresponds to this with the vector winds is displayed in Figure 7b. It is obvious that atypical northerly winds are prevalent south of 45 °N in East Asia; this is indicative of a more powerful East Asian winter monsoon in comparison to the conditions that are typical.
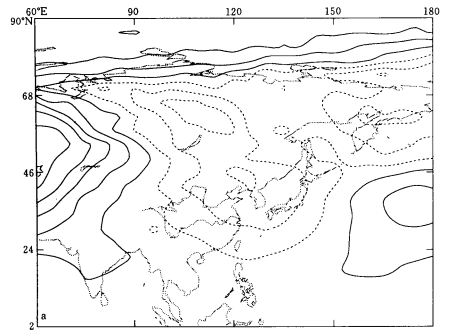
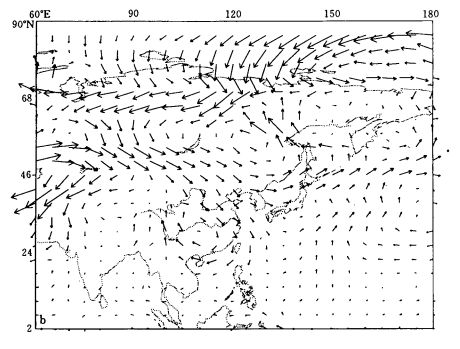
Figure 7. Anomalies in atmospheric circulation over Asia and the Western Pacific in the subsequent winter caused by positive SST in the eastern equatorial Pacific from January to March (a. 500 hPa altitude anomaly; b. 850 hPa vector wind anomaly) [8].
Conversely, during La Niña years, the average anomaly pattern in the 500 hPa height field caused by negative SST in the equatorial eastern Pacific from January to March in the following winter (December to February of the subsequent year) is depicted in Figure 8a. This pattern is mainly characterized by positive anomaly control over the ocean surface from eastern China to east Japan, with a strong negative anomaly area between 150 °E and 180 °. This situation indicates an abnormally eastward position of the East Asian trough and a weaker East Asian cold wave. Simultaneously, the abnormal 850 hPa flow field shows the presence of anticyclonic circulation from eastern China to Japan, with weak winter winds [8].
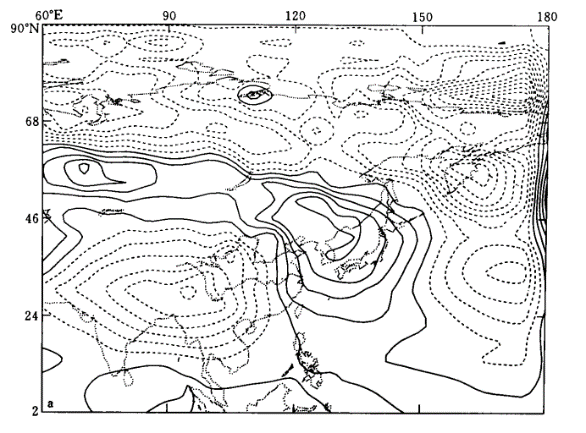
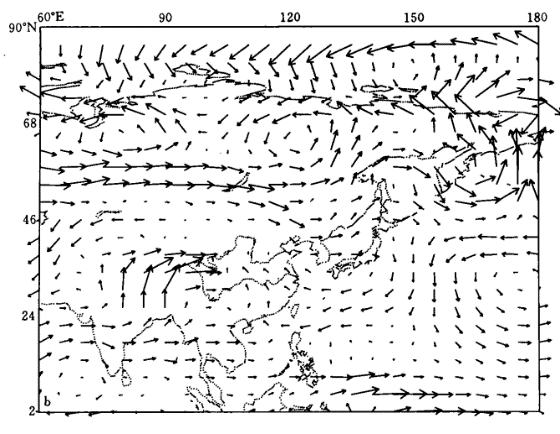
Figure 8. Anomalies in atmospheric circulation over Asia and the Western Pacific in the subsequent winter caused by negative SST in the equatorial eastern Pacific from January to March (a. 500 hPa altitude anomaly; b. 850 hPa vector wind anomaly) [8].
In conclusion, ENSO continues to exert a significant influence on the future activities of the East Asian monsoon. After an El Niño event, the subtropical high in the Western Pacific gets stronger and moves farther north, which causes a decrease in rainfall during the flood season in eastern China, especially during the winter in Northern China that follows an El Niño event. As the trough in East Asia continues to significantly deepen, the winter winds in that region become significantly stronger. There is a decrease in precipitation in the Jianghuai River basin as a result of abnormal circulation cells in the eastern region of China. These cells are linked to the continental subtropical high that occurs in the summer after a La Niña event. During the winter that follows a La Niña, the East Asian trough is less intense, and the East Asian winter monsoon has a more moderate temperature range.
The activities of the East Asian monsoon are influenced by both El Niño and La Niña phenomena. The positive effect of sea surface temperature (SST) anomalies is slightly stronger than the negative effect, indicating that El Niño has a greater impact compared to La Niña. It is noteworthy that the anomalies induced by positive and negative SST anomalies do not exhibit completely opposite phases, suggesting that the influence of La Niña on atmospheric circulation and climate is not entirely distinct from that of El Niño. However, the effects on the East Asian winter monsoon demonstrate an almost inverse relationship between the two phenomena [9].
Impact on cold and warm winters in China. The interannual variation of synoptic-scale winter temperature variability in China is closely linked to ENSO. ENSO exhibits a positive correlation with synoptic-scale winter temperature variability over a wide area in eastern China. As depicted in Figure 9, the synoptic-scale temperature variability in China shows a significant positive correlation with SST in the Middle East Pacific, tropical North Indian Ocean, and Atlantic Ocean, while displaying a noteworthy negative correlation with the Western Pacific Ocean. This indicates a distinct El Niño-like SST distribution overall [10].
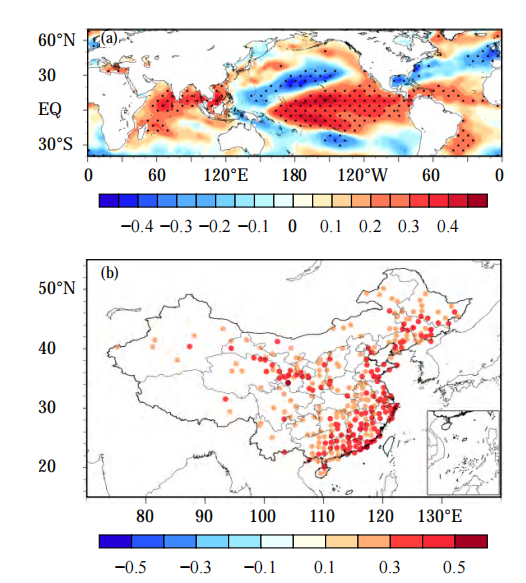
Figure 9. (a) Spatial distribution of correlation coefficients between average synoptic-scale winter temperature variability in China and global SST anomalies during the same period; (b) Winter synoptic-scale temperature variability anomaly regressed against the Nino3.4 index regression in winter [10].
Winter cold air activity in China is primarily associated with synoptic-scale transient vortices (also known as storm axes) in the upstream Eurasian continent. The intensity of synoptic-scale transient vortices can be represented by the filtered variance of the 500 hPa geopotential height field. Alongside the Pacific storm axis, a prominent center of high values exists in the westerly flow over Siberia, known as the Siberian storm axis. This system significantly impacts winter weather in China. Hence, ENSO likely influences synoptic-scale winter temperature variability in China by exerting an influence on the Siberian storm axis [11]. The winter temperature during El Niño (La Niña) occurrences is predominantly higher (lower). The mechanism underlying the influence of ENSO may be that during La Niña events, abnormal cyclonic circulation in the Western Pacific Ocean and abnormal northward winds in the troposphere are stimulated. This corresponds to the strengthening of the North Pacific high pressure in the mid-troposphere, weakening of the West Pacific subtropical high pressure, pronounced meridional circulation in the middle and high latitudes of East Asia, and intensification of winter winds. Consequently, this leads to cold winter temperatures in most parts of China, and vice versa.
4. Discussion
ENSO, with its temperature anomalies in the eastern equatorial Pacific, can impact our nation. Within the East Asian monsoon region, climate anomalies during the decline of El Niño events are primarily influenced by subtropical northwest Pacific anticyclonic anomalies and the teleconnection pattern referred to as the Pacific-Japan Pattern (PJ Pattern). The PJ Pattern serves as a link between the tropical northwest Pacific and East Asia. Moreover, different types of ENSO events have varying effects on the climate.
Studies began categorizing Pacific warming events in the 1980s. ENSO is divided into the conventional Eastern Pacific El Niño and the Central Pacific El Niño. Charge-discharge and delayed oscillation theories apply to EP El Niños but not CP ones. EP El Niños have extensive-scale sea surface temperature and atmospheric responses, unlike CP ones, which maintain central Pacific sea surface and subsurface temperature anomalies throughout their formation, development, and dissipation. EP El Niño events have large thermocline changes and surface wind anomalies, but CP events do not. Unlike EP El Niño, CP El Niño does not have a cyclic relationship with La Niña and is more like an isolated event. Thus, the climate effects of these two ENSO variants can be studied separately [12].
Regarding the Eastern Pacific ENSO, an El Niño event results in a notable weakening of the anticyclonic anomaly in the Northwest Pacific, while a La Niña event leads to a considerable strengthening of the anticyclonic anomaly in the same region, indicating a significant asymmetry. However, in the case of CP ENSO, the response of air circulation anomalies in the Northwest Pacific to w arm or cold events often exhibits symmetry.
However, a lot of research looking at how ENSO affects the East Asian monsoon either concentrate only on EP ENSO or fail to differentiate between the two forms of ENSO. On the one hand, CP ENSO normally has little impact on the East Asian monsoon. For instance, the South Asian high is notably stronger and located further south in EP El Niño years. However, during CP El Niño years, the South Asian high shows just a few abnormalities. On the other hand, these findings suggest that further differentiation between the two types of ENSO is necessary for future research in this field.
5. Conclusion
Within the eastern equatorial Pacific Ocean, a phenomenon known as the El Niño-Southern Oscillation, also abbreviated as ENSO, is characterized by recurrent shifts in the circulation patterns of winds and the temperatures of sea surfaces. At lower latitudes, the interactions that take place between the water and the atmosphere are significantly impacted by this phenomena, which plays an essential part. The study of ENSO is of critical significance for both the practice of climate prediction and the administration of response and recovery efforts following natural disasters.
The formation of ENSO is determined by its production and regulation mechanisms. In terms of the generation mechanism, ENSO events are generally explained by the Bjerknes feedback, which involves the amplification of an initial SST disturbance through positive feedback, eventually leading to the occurrence of ENSO phenomena. While the Bjerknes feedback explains the abnormal growth, there is still a need for a theory to elucidate the phase reversal mechanism of ENSO from one extreme to the other, thereby explaining its oscillatory nature. Several oscillation models have been proposed to account for the ENSO cycle, which encompass the negative feedback regulation mechanism. Based on the thermodynamics and dynamics of the ocean-atmosphere linked model created by Zebiak and Cane, Wang created a unified ENSO oscillation model. The idea was to take into account the physics of earlier models of ENSO oscillations and think of ENSO as a multi-mechanistic phenomena with changing relative importance throughout time. Wang developed a thorough oscillation model that can account for the recurrent recurrence of ENSO events by taking into consideration ENSO interannual anomalies in the western and eastern Pacific.
ENSO also has a notable impact on climate. Research has established a noteworthy correlation between the reaction of dry and semi-arid areas from the southeastern coastal regions to the inland parts of China and the magnitude of the most powerful El Niño occurrences. As a result, a robust El Niño event has the potential to trigger drought conditions in arid tropical, temperate, and inland arid regions within China. Additionally, the SST anomaly in ENSO affects water vapor transport and consequently influences drought and flood events. Among them, the most pronounced effect is the abrupt transition from drought to flood, characterized by little or no precipitation in the initial stage followed by high-intensity precipitation and flooding in short-term meteorological and hydrological events.
The East Asian monsoon is also influenced by ENSO. Following El Niño, the Western Pacific subtropical high intensifies and moves northward, leading to decreased rainfall during the flood season in eastern China. Additionally, the East Asian trough expands, accompanied by intensified East Asian winter winds, particularly in the aftermath of El Niño. Conversely, during a La Niña event, anomalous continental subtropical high circulation cells in eastern China contribute to reduced summer precipitation in the Jianghuai River watershed. Furthermore, the East Asian winter monsoon and trough weaken following a La Niña event. El Niño and La Niña have distinct impacts on the East Asian monsoon, yielding different consequences.
The El Niño-Southern Oscillation (ENSO) strongly influences winter synoptic-scale temperature oscillations in China. ENSO affects China's winter synoptic-scale temperature variability by shifting the Siberian storm track. La Niña episodes induce aberrant Western Pacific Ocean cyclonic circulation and tropospheric northward wind. This strengthens the mid-tropospheric North Pacific high-pressure system, weakens the West Pacific subtropical high-pressure system, creates a north-south circulation in East Asia's middle and high latitudes, and intensifies winter winds. Most of China has frigid winters and vice versa.
References
[1]. Latif, M., & Keenlyside, N. S. (2009). El Niño/Southern Oscillation response to global warming. Proceedings of the National Academy of Sciences, 106(49), 20578-20583.
[2]. Wang, C. (2018). A review of ENSO theories. National Science Review, 5(6), 813-825.
[3]. Alizadeh, O., Qadimi, M., Zolghadrshojaee, M., & Irannejad, P. (2022). Frequency of different types of El Niño events under global warming. International Journal of Climatology, 42(16), 9697-9709.
[4]. Lv, A., Fan, L., & Zhang, W. (2022). Impact of ENSO Events on Droughts in China. Atmosphere, 13(11), 1764.
[5]. Yang, H., Chen, X., Xu, W., & Tan, Q. (2017). Impact of ENSO Events on Droughts in China. Water, 9(3), 151
[6]. Shan, L. J., Zhang, L. P., Zhang, Y. J., She, D. X., & Xia, J. (2018). Characteristics analysis of drought-flood abrupt transition events in the middle and lower reaches of the Yangtze River Basin and their relationship with ENSO. Acta Geographica Sinica, 73(1), 25-40.
[7]. Yu, Q. Q., Xie, D. M., Chen, Y. P., & Zhu, Y. (2022). A preliminary study on the relationship between tropical cyclones affecting the coast of China and ENSO changes from 1979 to 2019. Marine Bulletin.
[8]. Long, Z. X., & Li, C. Y. (1999). GCM simulation study on the influence of ENSO on East Asian monsoon activities. Acta Meteorologica Sinica, 57(6), 651-661.
[9]. Ni, Y. Q., Zou, L., Zhang, X. D., Wang, G. M., Yang, X. Q., & Wu, A. M. (1995). Research on ENSO and its impact on Asian monsoon and climate change in China. Meteorological Science, 15(4), 30-45.
[10]. Ren, M. L., Zhang, W. J., Geng, X., & Liu, C. (2020). Influence of ENSO on the temperature variability of winter weather scales in China and its possible mechanism. Acta Meteorologica Sinica, 78(2), 199-209.
[11]. Wu, H. Y., Pan, W. J., & Wang, T. (2014). Relationship between winter temperature anomalies in South China and ENSO. Meteorology, 40(10), 1230-1239.
[12]. Chen, W., Ding, S. Y., Feng, J., Chen, S. F., Xue, X., & Zhou, Q. (2018). Research progress on the influence and mechanism of different types of ENSO on the East Asian monsoon. Chinese Journal of Atmospheric Sciences, 42(3), 640-655.
Cite this article
Gao,Y. (2023). El Niño southern oscillation’s effects on China. Theoretical and Natural Science,7,39-49.
Data availability
The datasets used and/or analyzed during the current study will be available from the authors upon reasonable request.
Disclaimer/Publisher's Note
The statements, opinions and data contained in all publications are solely those of the individual author(s) and contributor(s) and not of EWA Publishing and/or the editor(s). EWA Publishing and/or the editor(s) disclaim responsibility for any injury to people or property resulting from any ideas, methods, instructions or products referred to in the content.
About volume
Volume title: Proceedings of the 2023 International Conference on Environmental Geoscience and Earth Ecology
© 2024 by the author(s). Licensee EWA Publishing, Oxford, UK. This article is an open access article distributed under the terms and
conditions of the Creative Commons Attribution (CC BY) license. Authors who
publish this series agree to the following terms:
1. Authors retain copyright and grant the series right of first publication with the work simultaneously licensed under a Creative Commons
Attribution License that allows others to share the work with an acknowledgment of the work's authorship and initial publication in this
series.
2. Authors are able to enter into separate, additional contractual arrangements for the non-exclusive distribution of the series's published
version of the work (e.g., post it to an institutional repository or publish it in a book), with an acknowledgment of its initial
publication in this series.
3. Authors are permitted and encouraged to post their work online (e.g., in institutional repositories or on their website) prior to and
during the submission process, as it can lead to productive exchanges, as well as earlier and greater citation of published work (See
Open access policy for details).
References
[1]. Latif, M., & Keenlyside, N. S. (2009). El Niño/Southern Oscillation response to global warming. Proceedings of the National Academy of Sciences, 106(49), 20578-20583.
[2]. Wang, C. (2018). A review of ENSO theories. National Science Review, 5(6), 813-825.
[3]. Alizadeh, O., Qadimi, M., Zolghadrshojaee, M., & Irannejad, P. (2022). Frequency of different types of El Niño events under global warming. International Journal of Climatology, 42(16), 9697-9709.
[4]. Lv, A., Fan, L., & Zhang, W. (2022). Impact of ENSO Events on Droughts in China. Atmosphere, 13(11), 1764.
[5]. Yang, H., Chen, X., Xu, W., & Tan, Q. (2017). Impact of ENSO Events on Droughts in China. Water, 9(3), 151
[6]. Shan, L. J., Zhang, L. P., Zhang, Y. J., She, D. X., & Xia, J. (2018). Characteristics analysis of drought-flood abrupt transition events in the middle and lower reaches of the Yangtze River Basin and their relationship with ENSO. Acta Geographica Sinica, 73(1), 25-40.
[7]. Yu, Q. Q., Xie, D. M., Chen, Y. P., & Zhu, Y. (2022). A preliminary study on the relationship between tropical cyclones affecting the coast of China and ENSO changes from 1979 to 2019. Marine Bulletin.
[8]. Long, Z. X., & Li, C. Y. (1999). GCM simulation study on the influence of ENSO on East Asian monsoon activities. Acta Meteorologica Sinica, 57(6), 651-661.
[9]. Ni, Y. Q., Zou, L., Zhang, X. D., Wang, G. M., Yang, X. Q., & Wu, A. M. (1995). Research on ENSO and its impact on Asian monsoon and climate change in China. Meteorological Science, 15(4), 30-45.
[10]. Ren, M. L., Zhang, W. J., Geng, X., & Liu, C. (2020). Influence of ENSO on the temperature variability of winter weather scales in China and its possible mechanism. Acta Meteorologica Sinica, 78(2), 199-209.
[11]. Wu, H. Y., Pan, W. J., & Wang, T. (2014). Relationship between winter temperature anomalies in South China and ENSO. Meteorology, 40(10), 1230-1239.
[12]. Chen, W., Ding, S. Y., Feng, J., Chen, S. F., Xue, X., & Zhou, Q. (2018). Research progress on the influence and mechanism of different types of ENSO on the East Asian monsoon. Chinese Journal of Atmospheric Sciences, 42(3), 640-655.