


1. Introduction
Approximately 1.0 ℃ of global warming above pre-industrial levels have been attributed to human activity, according to the Intergovernmental Panel on Climate Change, Extreme weather events are growing more frequent due to human activities, which have significantly affected the environment, society, and economy, especially in vulnerable countries [1].
Mid-latitude and moist tropical regions are projected to experience more intense and frequent extreme precipitation events by the end of the century [1]. Rapidly increasing temperatures are leading rising number of frequencies in El Nio Southern Oscillation [2]. The El Nio Southern Oscillation (ENSO) is significantly responsible for interannual climatic changes in the tropics and substantially impacts severe occurrences in South America [3]. This anomie has occurred through Rossby wave trains or westward circulation linked to anomalous tropical warmth, such as the east-west Walker circulation and the Hadley circulation, which are used to prove this impact). Its impact on the part of south America is localized; it primarily affects the northern coastal regions and secondarily impacts subtropical South America. Large areas of the tropics of South America experience climatic fluctuations linked to ENSO. Responsible for climate change, there has been a general rise in the frequency of precipitation anomalies in South America, causing in expanded area in dry conditions in the west and more precipitation in the east region in tropical latitudes [4].
The country of Colombia undergoes the worst weather within South America, with more than eighty-five percent of its residents and eighty-seven of its property situated in areas vulnerable to various disasters, such as the major river basins [5-6]. At the end of 2021, it is statistics that Colombia's population was only 5.5 million, which is fewer than the population of most South American countries in the corresponding year [7]. Compared with other South American countries' economic revenue, Colombia country is belonged to middle-income country with an estimated GNI per capita of US$6,190 [8]. The country is currently suffering from the effects of improper urbanisation planning, with fast population increase in squatter communities, densely populated coastal areas, and metropolitan areas. These have led to more flooding and landslides in Colombia, in addition to the consequences of climate change. Colombia country is susceptible to cyclones, droughts, and earthquakes.
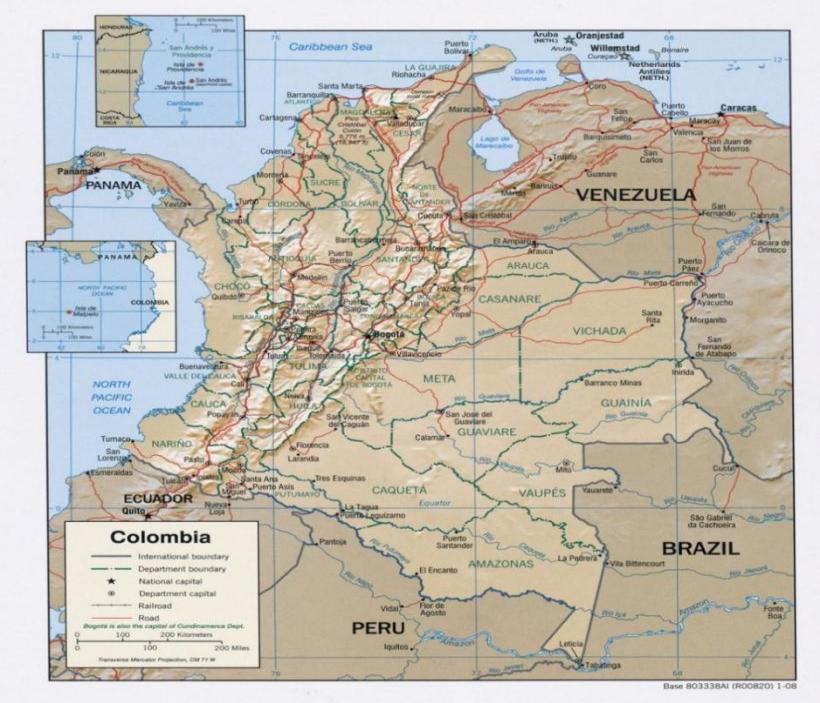
Figure 1. The map of sourth America with geography features including light brown color topography (Colombia), and relative location [9].
Previous research in Colombia region had asserted that raised oscillations of ENSO events might mainly associate with variations in rainfall, streamflow and other hydro-climatic variables, primarily in the mid-north part of regions, resulting in climate anomalies. The interannual precipitation variability was influenced by El Niño, which making warming and droughts [10]. The La Niña events associated with persistent precipitation, even floods. In particular, current research suggested that the climate anomalies in the South America associated with ENSO events are altered when amplification of the oscillations [11]. However, these studies have not considered the paleoclimate knowledge to explore the temperature and precipitation anomalies in the long term. In this study, the author would like to fill the gap in the paleoclimate knowledge, hence, providing framework to explore the dynamics process of Colombia's hydro-climatic variability in interannual and interdecadal timescales. Data sets including the temperature and precipitation factors were used to analysis the extreme climatic events, social responses, and correlations to the ENSO cycle. Hence, combing them with paleoclimate to simulate Halley Cell expansion to discuss South America's seasonality and long-term scale anomalies.
This scientific review also contributed to the development of a framework for environmental management in Colombia, South America, which is considered a climatically vulnerable region of the world and raised the warning of potential risks for scientists and government to implement their operations and mobilize resources, thought to preventing disruption of the region's valuable hydrologic and socio-economic resources in the future. It also suggests implementation of strategies and adaptive schemes to respond to the threat of global environmental change.
2. Methodology
Colombia is located in the western part of South America (Fig. 2), where is close to the Caribbean Sea (4.5709° N, 74.2973° W). The climate type in Colombia infrequently changes throughout the seasons, and it commonly belongs to the tropical climate type [10].
Three to four main climatic zones compose the Colombian region’s climate, formed by the topographic influence, like Andes Mountains (Fig. 1). Nearly 85% of the Colombian region is in the tropical zone, which is at the lowest elevation. Summers in this climatic zone tended to be dry, while the winters tended to be moist. The bulk of Colombia's population resides in the temperate zone, which is at higher altitudes. There are often two humid seasons in this climatic zone. July to September and January to March. Higher up is the cold climate zone, which also features two rainy seasons, running from April to May and September to December. Higher up region belongs to the cold climate zone, featuring two rainy seasons: April to May and September to December [12-13].
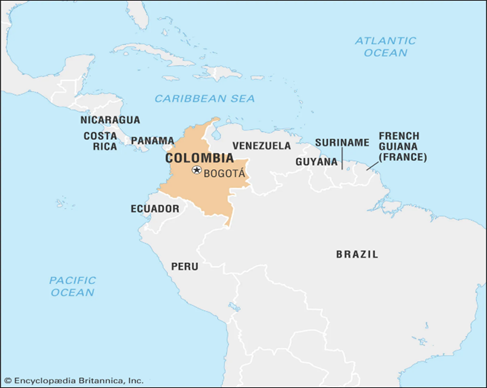
Figure 2. Map of the south part of the south America which indicates the Colombia’s location [14].
This research forces on understanding the hydro-climate dynamics process to assess the climate anomalies in the Colombia South America under the internal climate variability, predictability, and uncertainties in scenarios.
This study explores the reason causing the Interannual climate anomalies in Colombia's country climate model based on the Phase of the Coupled Model Intercomparison Project (CMIP6). CMIP6 is that it has a broader and more inhomogeneous range of climate sensitivity values and provides multiplied present-day climate projections from the diverse scenarios of future emissions [15]. This research simulation data set from Climate Datastore API and WGB [16]. Hence, the author analyzes the climatic characteristics and Potential implications of climate change on Colombia by evaluating expected precipitation and temperature changes during 2020 and the year 2070 according to two emission scenarios—SSP1-2.6 representing the low-emission route, as well as SSP5-8.5 representing high emission pathway (2.23°*3.75°). CPIM6 simulation performs more accurately while simulating both variables in the mouths from December to February and March to May in comparison to the other seasons, resulting in the intertropical Convergence Zone being captured by simulations without fewer errors during these two periods. The average annual temperature of the surface air and average annual precipitation in the period from 2020 to 2070 has been determined with respect model previous periods (1850–1900) in order to illustrate the effects of various emissions and changes in the climate on precipitation and temperatures in Colombia. As additional measures include taking when considering the impact of ENSO-related occurrences on Colombia's precipitation, the annual precipitation and the standardised precipitation factors among ENSO and neutral year occurrences are also being taken under consideration. The annual rainfall anomaly, which may be used to assess whether precipitation fluctuates over time and to identify times of extraordinarily excessive or insufficient precipitation is calculated by subtracting the annual precipitation difference from the standard deviation of rainfall from 1980 to 2020. Regarding the standardised precipitation anomaly, the standard deviation of precipitation during every season during El Nio events and La Nia events is initially statistics or standardised by replacing the mean, hence splitting by standard deviation, which is use of data source during neutral year period. This approach enables potential to observe how ENSO occurrences exert an influence.
3. Results
3.1. Reconstruction precipitation changes during the heinrich event (HS)
Tracing the δ18O analyses from the benthic foraminifera Uvigerina spp [17], it is claimed that the LGM, approximately 19.3 ka BP in MIS2, has the greatest quantity. In contrast, the late Holocene has the smallest amount, around 3.4 ka BP in MIS1. The δ18O range variations from 2.63 to 5.02‰ in Fig. 3. Three significant features occur during the MIS5a to MIS2. At approximately 70 ka BP, the transition between MIS5a to MIS4 indicates the result of the glacial inception. A progressive decline in δ18O levels peaks at 59 ka BP characterises MIS4. Around 47 ka BP, comparatively low levels throughout MIS3 are contemporaneous with HS5. Increased 18O results are steadily trending upwards in MIS2. Two significant, concurrent HS1 declines in δ18O at 18.4 and 11.5 ka BP suggest the most historic deglaciation.
These results further provided evidence to reconstruct the paleoclimate changes in the precipitation during the Heinrich event in the Northern Hemisphere. During the Heinrich event, the climate in northern South America is arid. The climate is wetter than the NE South America region In the Colombia region. The overall quality of paleoclimate Precipitation is fewer than the current one in the South American area. These phenomena might support the hypothesis- poleward migration of the Hadley cell and expansion southward tropical rain belt [18].
However, this result cannot relate with ENSO variability during the Henrich event. To compensate for interannual variability, the data set lacks sufficient temporal resolution. Hence, there is no direct evidence to determine ENSO caused the change of precipitation anomalies during the Henrich period.
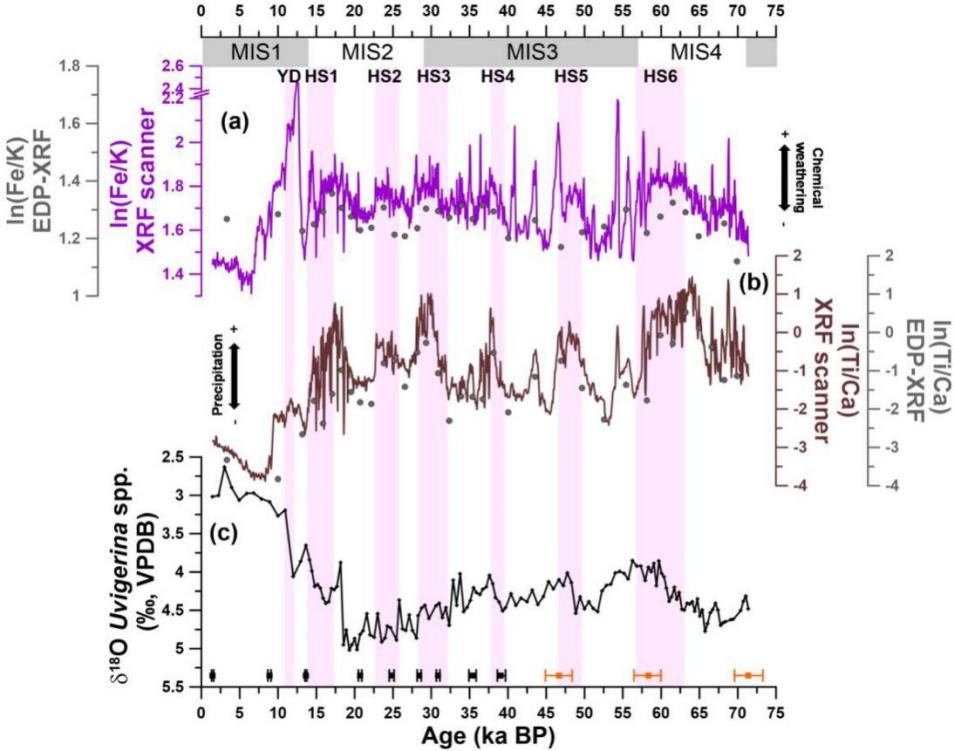
Figure 3. The stable isotope to analysis the paleoclimate in period mis1- mis4 [17].
3.2. Rainfall anomalies in South America
Apart for the northern hemisphere, which claims a large shift in precipitation in the Colombia region, there were positive anomalies across the majority of tropical South America [17]. In summer (NDJFM), the South America area will become arid (Fig.4b). In winter MJJAS region will be moister in total area (Fig.4c). However, During NDJFM episodes, the dipole pattern is limited to eastern South America; however, in the MJJAS event, it moves almost to the equator between 10°N and 10°S. The meridional effect of the Heinrich event-induced precipitation anomalies over South America reduces from north to south.
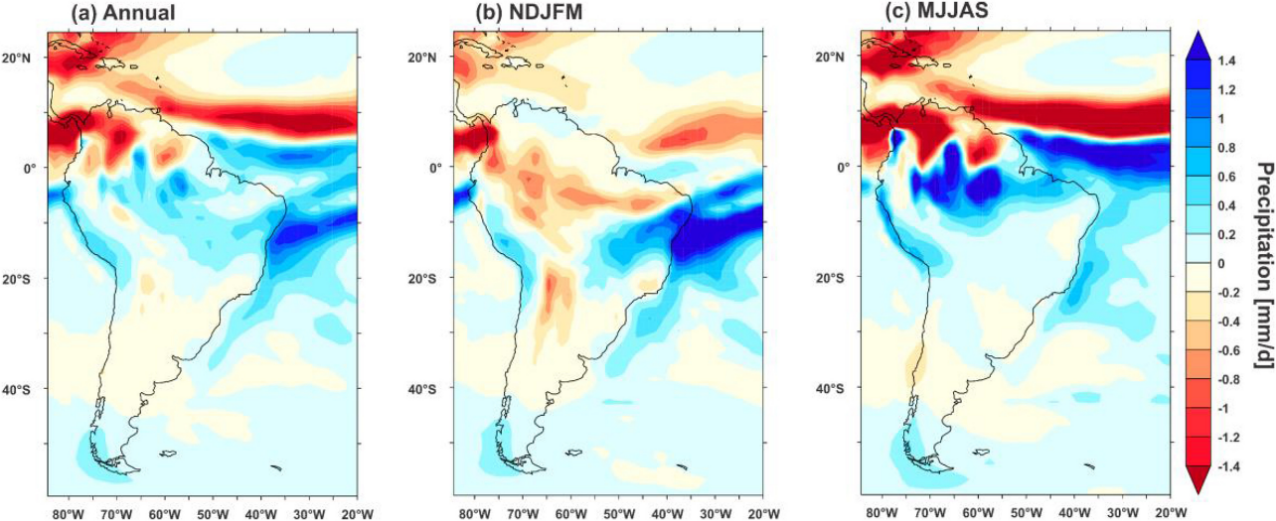
Figure 4. The prepetition (mm/d) of south america from “heinrich stadial precipitation-last glacial maximum precipitation “ndjfm (november march), mjjas(may–september). (this simulation is based on the ccsm3) [17].
3.3. Expansion hadley cell influence the precipitation in South America
The downstream branch of the Hadley Cell, a tropical overturning atmospheric circulation encompassing half the earth, is generally considered connected to the subtropics. This action shifts precipitation patterns and expands the range of drought regions. However, this study did not explore the Hadley Cell influence directly influencing the precipitation patterns due to the tropical region expansion, as evidence for a precise determination of tropical edge needed to be provided.
The extension of the Hadley Cell to the pole is seen in Fig. 5 with a standard tendency rate of around 0.5° to latitude. The Hadley Cell's extension is what caused a shift in ENSO variability. Having spans ranging from almost two to seven years, Niño is characterised by irregular oscillations between its warm (El Niño) and cold (La Niña) stages. The primary cause of interannual variability is caused by temperature and precipitation anomalies connected to ENSO events [19]. Between a decreased land-sea temperature difference and more depression from convection, ENSO mostly affects the winter season (DJF) and reductions in convection in the Colombia region (see 3.2.3). ENSO primarily affects the spring and winter (DJFMA) in the vicinity of the tropical Andes, which slowed convection as a result of an alteration in Hadley Cell rotation.
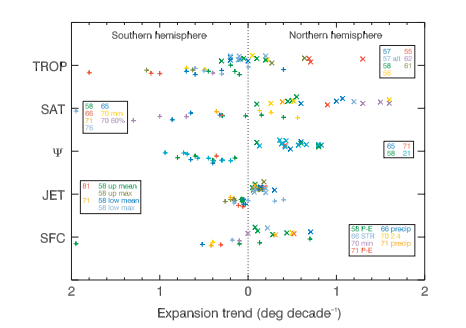
Figure 5. The tropical expansion indicates the expansion of hadley cell. “+” represent southern hemisphere expansion trend (deg decade^-1),“×” indicates northern hemisphere values of tropical expansion [20].
3.4. Regional temperature analyses in Colombia country
The Historical Mean Air Temperature for each period from 1850 through 1900 is displayed in Fig.4 including represent the time intervals: December-February (DJF), March-May (MAM), June-August (JJA), and September-November (SON). Between 18 ℃ to 28 ℃ is the range of the average air temperature for the DJF period (Fig. 6a). The country's western region, which includes part within the Andes Mountains, was colder than its south-eastern regions, with values ranging from 18 to 28 ℃. Similarly, during the MAM period, the western region of Colombia has temperatures between 18 and 24 ℃, while the southern and northern regions of the nation appreciate higher temperatures between 26 and 29 ℃ (Fig. 6b). Throughout that JJA time interval, the western part of the country once more has colder temperatures than the north and south of it, having Mean Air Temperatures of 19 to 23 ℃ and 25 to 28 ℃, respective (Fig. 6c). In SON event, the Mean Air Temperature gradient from throughout the remainder of the year persists (Fig. 6d). While the northern and southern regions of Colombia observe higher overall Mean Air temperatures ranging from 25 and 28 ℃, western Colombia experiences temperatures from 19 to 24 ℃.
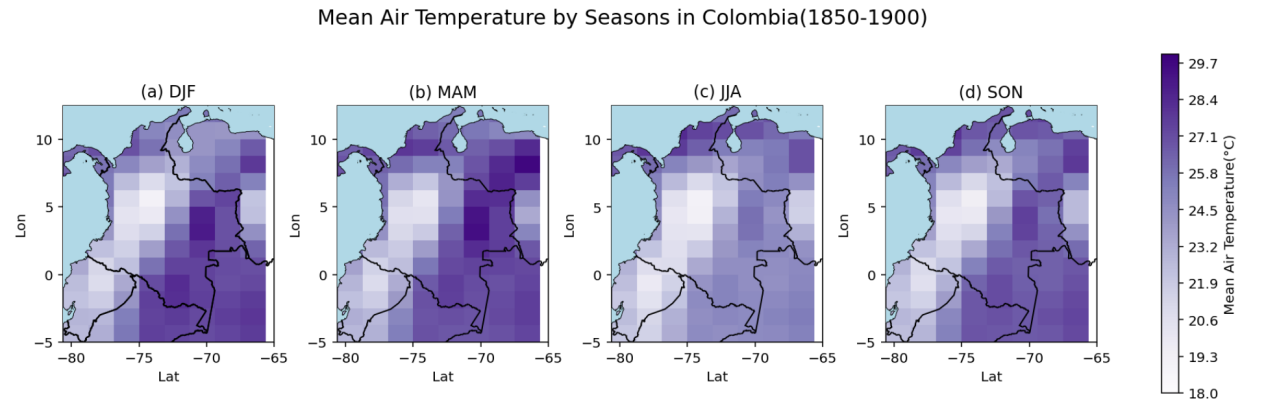
Figure 6. The mean air temperature (℃) by season from 1850 to 1900 in the colombia region (original).
Fig.7 indicates the Mean Air Temperature change based on the SSP1-2.6 and SSP5-8.5 and compared the historical Mean Air Temperature data in Colombia region from 1850 to 1900, the time interval including December-February (DJF), March-May (MAM), June-August (JJA), and September-November (SON). Fig.5 from a) to d) displays projected rises in Colombia's Mean Air Temperature between 2020 and 2070 assuming SSP1-2.6, The country's average temperature rises across all four-time intervals vary from 1 to roughly 3.5 ℃. The DJF and MAM period both obtain significant increases, particularly are the interior south-eastern regions. Fig.7 e-h depicts anticipated increases in Mean Air Temperature based on SSP5-8.5 scenario. Four seasons have risen in temperatures that fluctuate between 2 and 5 ℃, with the southern, eastern, and northern regions of the nation experiencing the highest increases.
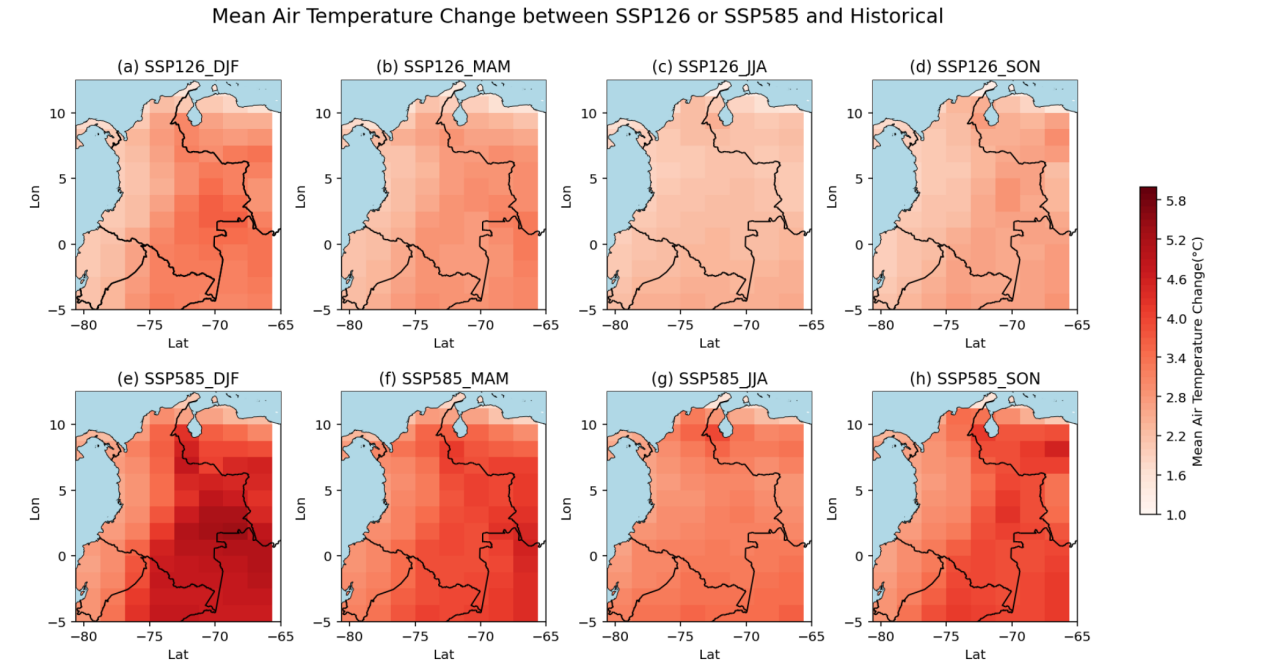
Figure 7. Changes in mean air temperature (℃) for the seasons of ssp1-2.6 from a to d and ssp5-8.5 from e to h from 2020 to 2070, as well as comparisons with historical mean air temperature data (original).
3.5. Regional precipitation analyses in Colombia country
Fig.8 illustrates the historical mean precipitation by CMIP6 models over four seasons between 1850 and 1900. Precipitation is distributed irregularly in the Colombia region, and the precipitation biases associated with topography. For instance, in the Andes region CMIP6 shows the maximum precipitation during the seasons. Precipitation during the DJF period varies from 2 mm to 8 mm each day, with up to 8 mm per day occurring in the plains of the west Pacific. Precipitation in central Colombia varies between 0 to 6 millimetres annually day, which renders it dryer than the south-west. Nevertheless, heading south-west to the centre of Colombia, precipitation varies between 6 mm to 12 mm annually day throughout MAM. The north-eastern region of the Columbia region possesses 0 to 4 mm lower daily precipitation than other regions. The eastern region of Colombia observed the maximum amount of precipitation throughout the JJA, average 16 mm per day, while the remainder of the country experienced little variation in precipitation from MAM. The eastern part of Colombia receives irregular precipitation in SON, average exclusively 4 mm per day, contrasted with central Colombia, that receives 7 mm per day.
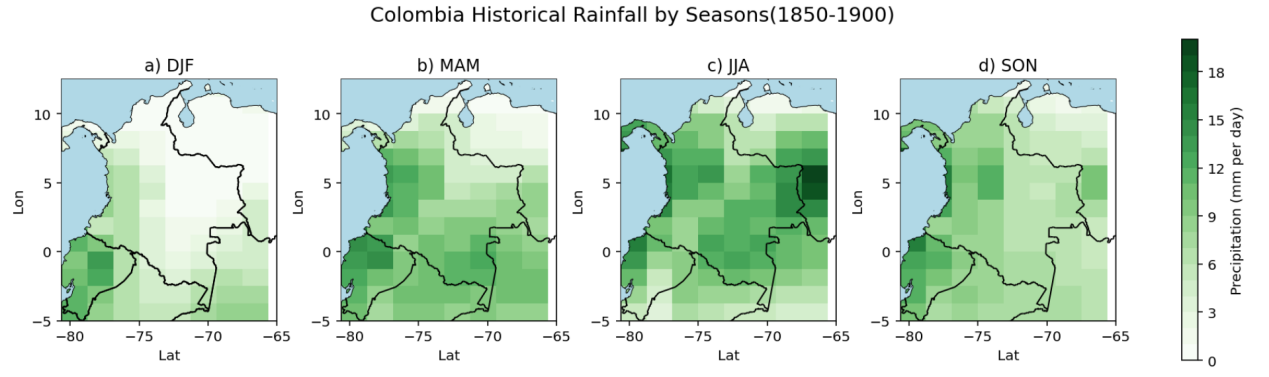
Figure 8. Colombia's seasonal mean precipitation (mm per day) between 1850 and 1900 (original).
Fig. 9 emphasizes the percentage of difference between Colombia's historical precipitation based on SSP1-2.6, SSP5-8.5 two simulation and differed with historical precipitation. Historical precipitation fluctuations range from -25% to 12% (Fig.9a). Despite an overall estimated decrease in precipitation and rising temperatures in the western region, the northeastern region of the country recorded an unusual expand. In Fig.9b, among -16% with 12% was the historical precipitation percentage difference between the SSP1-2.6 occurrence with the SSP5-8.5 instance. Although the region's trend fluctuation appears to be uniform, precipitation reduces or rises frequently. Based on the SSP5-8.5 and SSP1-2.6 simulation, precipitation declined approximately between -23.8% and 3.9% (Fig. 9c). The comparison exemplifies the patterns of the precipitation change between the both scenarios, with SSP5-8.5 exhibiting markedly greater amounts of precipitation in the northern lowlands along with several regions of the Colombia country's center.
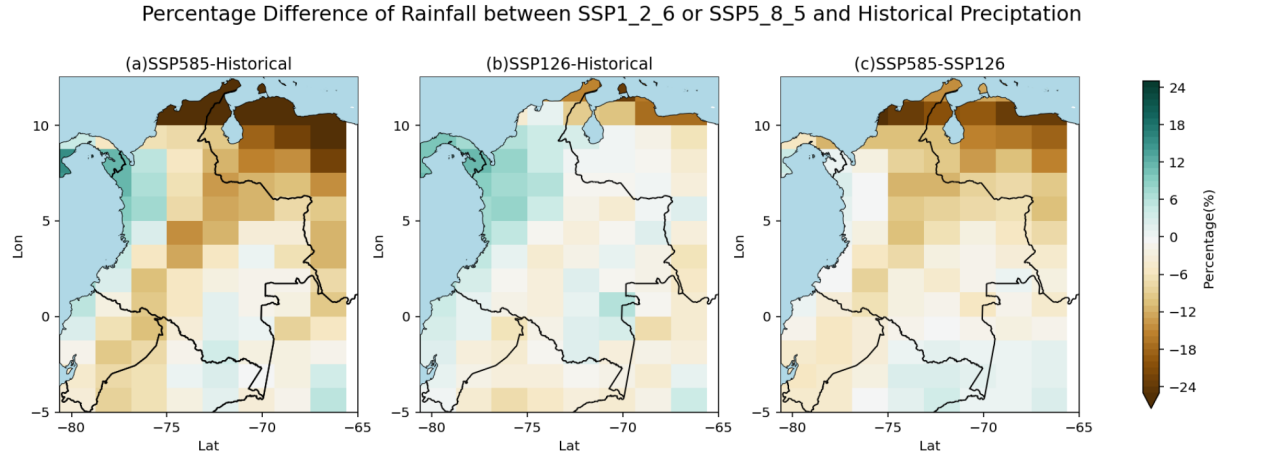
Figure 9. Variation in precipitation (%) using ssp1-2.6 and ssp5-8.5 scenarios, compared with the historical average precipitation. (a) the distinction among historical precipitation and ssp5-8.5 regarding magnitude. (b) the percentage of variance from ssp1-2.6 and historical precipitation. (c) the variation in % between the ssp1-2.6 and ssp5-8.5 (original).
The abnormal precipitation events in Colombia between 1980 and 2020 (Fig.10). The trend has been shown to fluctuate periodically using the ten-year moving average. During 1990 through nearly 2010, the overall precipitation pattern varies, including an increase in precipitation in the years between 1990 and 2010 and a decrease in precipitation in the decades that followed.The most notable abnormalities were found in the following years: 1981, 2008, and 2011, having abnormalities of around 400mm, 420mm, and 500mm, respectively. The smallest adverse abnormalities were recorded in the year 1992, the year 1997, and 2015, with abnormalities ranging from -425mm, -320mm, and -480mm, respectively.
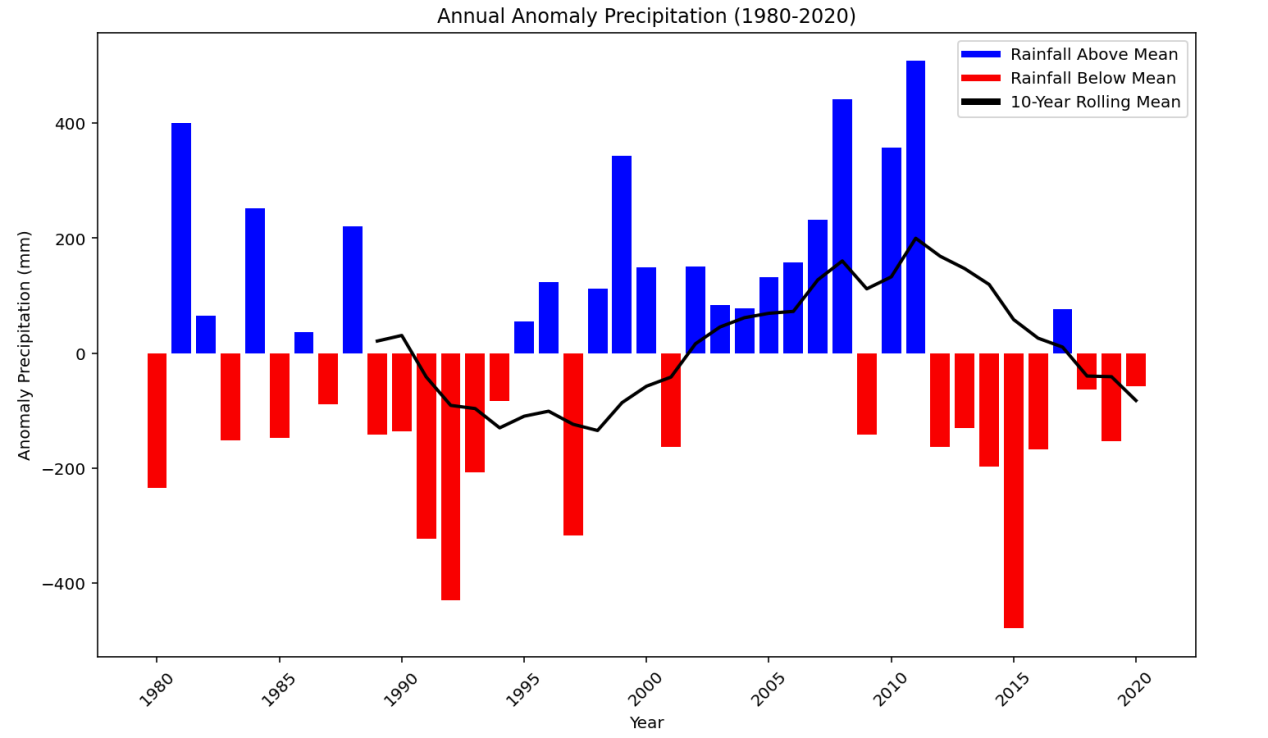
Figure 10. Annual unusual rainfall (mm) from 1980 to 2020 (original).
The variation between the mean precipitation and the per average precipitation between 1900 and 2020 can be observed in the bar chart. Precipitation above the average is depicted by bars above zero (blue), while rainfall below the average is depicted by bars below 0. The 10-year annual mean of the precipitation anomalies is shown with the black line.
3.6. The variability ENSO influence in precipitation over Colombia country
Difference in Colombian precipitation patterns among ENSO and neutral years appears in Fig. 11. Figure 11's panels spanning a to d particularly show during El Niño years. The DJF anomalous is predominantly negative, shown in Fig. 11a, suggesting the current season's climate is likely generally drier than others. Other specific areas of Fig.11b's MAM period, there are several positive anomalies while in some, they are negative abnormalities. JJA(Fig.11c), displays negative anomalies, suggesting less precipitation throughout the year long. whereas, the SON in Fig.11d demonstrates a primarily positive anomaly, implying that this season will have more precipitation than typical. Fig.11 from e to h show the variations in precipitation that occur throughout La Niño years. DJF event anomalies indicate an inconsistent tendency, with certain areas observing positive and other experiencing negative anomalies. Positive anomalies are common throughout the MAM period, as illustrated in Fig. 9f. Due to a largely positive anomaly, Fig. 11g demonstrates that summer is frequently wetter. JJA-SON (Fig. 11h) displays a pattern with positive abnormalities in some places and negative abnormalities in others.
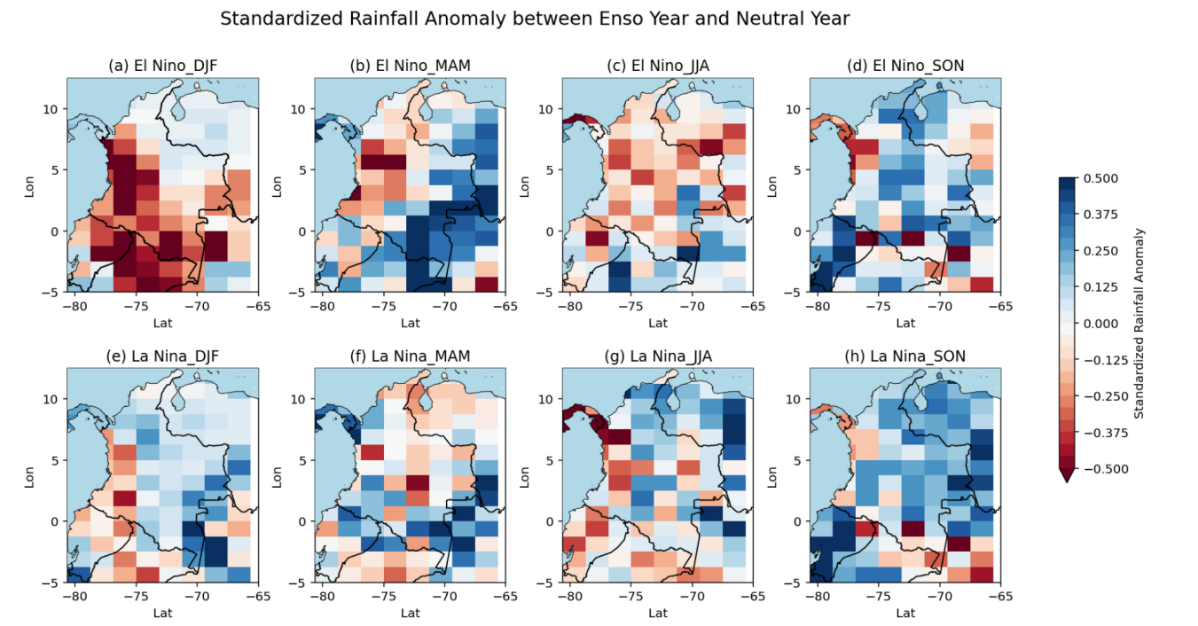
Figure 11. Standardized rainfall anomaly during four seasons between enso years and neutral year (1989-1990). el niño years (1968–1969) compared to neutral year from a to d. comparing the neutral year (1976) to the la niño year (1975–1976) from e to h.
4. Discussion
The paleoclimate in Northern South America shows positive precipitation in the Heinrich event from the Tropical South American archives record [21]. Before the Quaternary period, precipitation likewise underwent a transition from positive to negative anomalies. The Inter-Tropical Convergence Zone (ITCZ), which is the belt of lowest pressure and the extreme low-level convergence of the trade winds over the equatorial seas, has shifted southward, which represents one of the causes. The precipitation in the northern Amazonia area reduced significantly when the ITCZ shifted to the South Hemisphere due to the heightened Northeast trade winds. They encourage the development of source surrounding dunes as a result and might influence the current climate in the Northern part of South America region [22]. Northeastern Brazil has a rainy season when the ITCZ traverses the tropical Atlantic area during neutral and La Nio periods and travels to the equator. By the anticyclonic low-level flow around their centres at roughly 5°N over the eastern Pacific resides, the Hadley Cell is a semi-permanent high-pressure cell that is now in existence. According to Yang et al., the Hadley Cell's growth affects the movement of the ITCZ and the meridian temperature gradient, which alters the amount of precipitation in the South American area [23]. However, the precipitation change is relatively minor due to the slow expansion rate. Back to the late quaternary period, precipitation anomalies are significant for the Eastern-Pacific then Central-Pacific types of ENSO (Fig.11), These variations are explained by an accelerated downward motion and negative precipitation anomalies in the northeast during El Niño occurrences, which causes the Walker circulation to move more pronouncedly eastward and leading more negative precipitation in the Northeast part of the Colombia country.
Precipitation over extratropical South America exhibits a marked zonal asymmetry, with very wet conditions to the west of the Andes Cordillera. (Fig.8). One viewpoint present that the change of the precipitation caused by geographical dependence [24]. In addition to the mean north-to-south oscillations, the Andes' existence, differences in the breadth of the continent, and the boundary conditions imposed by a cool southeast Pacific and a warm southwest Atlantic cause large east-west asymmetries across the continent. Therefore, arid and instead cold climates occur at tropical and subtropical latitudes along the Pacific coastline and the small region of territory to the east of the Andes. Besides, Tropical precipitation on the continent experiences a distinct seasonal cycle. During the Northern Hemisphere summer, the most significant continental precipitation area is located north of the equator, almost coinciding with the oceanic ITCZ. At the same time, the central part of the continent experiences a dry season. Towards the end of October, convection shifts rapidly southwards, thus extending widespread heavy precipitation from the southern half of the Amazon basin to northern Argentina during the Northern Hemisphere winter. Heavy precipitation gradually reverts to northern South America in the southern hemisphere autumn.
The climatic effects in South America are directly impacted by ENSO diversity. Due to convection and anomalous Sea Surface temperature, Eastern-Pacific ENSO often have a bigger impact than Central-Pacific ENSO. Events associated with La Niña also displays consequences with spatial patterns differing from those associated with El Niño, with Central-Pacific ENSO events often having higher intensities than their Eastern-Pacific counterparts.
The leading cause of interannual variability across South America is caused by precipitation and temperature changes is linked to ENSO event. Arid weather is more common during El Niño years, which falls consistent with previous research, revealing seasonal precipitation anomalies tend to be negative. Lower evapotranspiration decreased recycled precipitation, fewer river discharges, and less cloud cover are all effects of El Niño. These factors allow for more splendid isolation and higher temperatures in the immediate region. According to Ambrizzi et al., this behaviour results from the subsidence brought on by anomalous Walker and Hadley circulations [25]. Wet weather extremes are more likely to occur in neutral or La Niño years. A nearly positive linear equation for dry weather extremes is shown when examining the interannual variability of severe precipitation variations from 1995 year to 2012 year, as illustrated in Fig.10. For rainy weather extremes, for instance, there is nearly downward linear tendency and the neutral or La Niño years are when the most intense precipitation occurs.
The tropical areas of the Atlantic and Pacific Oceans enormously impact Colombia's ENSO-related precipitation anomalies. According to research conducted by Andréoli and Kayano, the Atlantic Multidecadal Oscillation (AMO) and the ENSO collaborate to amplify the influence of precipitation fluctuations in South America [3]. Precipitation anomalies associated with ENSO are more coherent when the two phenomena are in opposing phases (Fig.11), according to prior studies which merged the AMO and ENSO. El Niño years during the AMO's cold phase are frequently more substantial than those throughout its warm phase. Significant El Niño episodes are brought by negative inter-Pacific-Atlantic Sea surface temperature during the cold AMO phase. According to results (Fig. 8&9), negative surface water temperature anomalies in the equatorial Atlantic enhance the tropical Pacific El Niño years through an abnormal Atlantic Walker circulation and its considerable influence on Colombia's precipitation patterns (see 3.1.3). In addition, the strength of the association between ENSO and regional climate has shown considerable variability in the 20th century. The consequences of ENSO-driven different anomalies are amplified while ENSO and PDO were synchronised, although the broader impact of the Pacific Decadal Oscillation (PDO) on the ENSO cycle wasn't taken into consideration by the present research [26]. The consequences of ENSO-driven different anomalies are amplified while ENSO and PDO were synchronised, although the broader impact of the Pacific Decadal Oscillation (PDO) on the ENSO cycle wasn't taken into consideration by the present research [26].
Colombia has been grappling with the consequences of climate change, which manifest in frequent occurrences of extreme weather events such as relentless rainfall, droughts, floods, landslides, land subsidence, and various other climatic phenomena [27]. One region significantly impacted by these changes is La Mojana, an inland delta covering an expansive area of 6000 km2 in Northern Colombia, where heavy precipitation and subsequent flooding occur with alarming regularity [28]. A noteworthy observation is the substantial increase in water levels during floods in 2022 compared to those experienced in 2021. Reports suggest that the floodwaters rose by approximately 35 cm, reaching depths ranging from 2 to 3 meters and surpassing previous records in terms of altitude [28]. While it is crucial to acknowledge that certain human activities such as deforestation and construction also contribute directly to the issues faced in La Mojana, it is evident that climate change plays a significant role in exacerbating the challenges [5].
Colombia's environmental vulnerability is primarily manifested through the adverse impacts of climate change, natural disasters, water scarcity, and pollution on its delicate ecosystems [29]. Over the past two decades, the country has witnessed a significant rise in temperatures, with an increase of at least 1.5 ℃, resulting in the escalating prevalence of extreme heat conditions [30]. However, our analysis reveals an even more alarming temperature rise of at least 2.5 ℃. Alterations in precipitation patterns and temperature can have profound effects on the growth and survival of plant species, ultimately leading to a decline in biodiversity [31]. Additionally, these changes can trigger the onset of droughts, particularly during the DJF period in eastern regions of Colombia. Reduced precipitation coupled with heightened evaporation can result in drought conditions, causing detrimental consequences such as soil erosion and the withering of plants [32].
During periods of extreme weather events, certain population groups, particularly those who are vulnerable, face an increased risk of mortality due to heat-related stress. Moreover, rising temperatures expand the geographic range within which vector-borne diseases can spread, posing additional health risks [30]. Furthermore, flooding amplifies the potential for the transmission of water-borne diseases [30]. To address the challenges posed by floods, Colombia's National Disaster Risk Management Unit, a governmental organization, plays a pivotal role in coordinating response efforts. These include deploying teams of emergency personnel, establishing temporary shelters, maintaining victim registries, and providing humanitarian aid. Collaborating with various governmental and non-governmental organizations such as UNICEF and international Red Cross groups, comprehensive humanitarian assistance is provided, encompassing financial support, sanitation and medical care, as well as the distribution of essential items like food kits, hygiene kits, and kitchen kits. Despite efforts to mitigate and respond to flooding events, the increasing intensity and frequency of these occurrences strain the emergency response budget, often leading to financial limitations [13].
5. Conclusion
This studies provides an essential warning for scientists and policy makers; it concentrates on the current climate abnormalities in South America and, using Columbia as a typical example, aims to take initiatives to engage resources and thoughts to save natural resources and environmental management in the context of rapidly changing climatic conditions, a situation that needs to be addressed from the political and institutional spheres, but also from the science of protecting the current environment and provide hydroclimatic risk prediction models to address it. The implementation of structural and non-structural actions, legislations, preservation programs and projects are necessary on the basis of the scientific research on the ecological system of the region, other trace gas budgets, nitro-carbon cycles. Similarly, there is a demand for research on the interactions between natural and social ecosystems as well as the increasingly relevant issue of compensating for ecosystem benefits as respond to climate vulnerability. These tasks must be aligned with scientific plans to apply decision-making instruments and systems and initiatives that are informed with knowledge to confront environmental challenges as effectively as public policies.
References
[1]. Intergovernmental Panel on Climate Change (2018) IPCC 2018: Summary for policymakers, In: Masson-Delmotte V et al (eds) Global Warming of 1.5 ℃., pp. 1–24. Available at: https://doi.org/10.1017/9781009157940.001.
[2]. Marengo, J. A. et al. (2011) “Development of regional future climate change scenarios in South America using the ETA CPTEC/HadCM3 Climate Change Projections: Climatology and regional analyses for the Amazon, São Francisco and the Paraná River basins,” Climate Dynamics, 38(9-10), pp. 1829–1848. Available at: https://doi.org/10.1007/s00382-011-1155-5.
[3]. Andreoli, R.V. et al. (2016) “The influence of different El Niño types on the South American rainfall,” International Journal of Climatology, 37(3), pp. 1374–1390. Available at: https://doi.org/10.1002/joc.4783.
[4]. Garreaud, R. D. et al. (2009) “Present-day South American climate,” Palaeogeography, Palaeoclimatology, Palaeoecology, 281(3-4), pp. 180–195. Available at: https://doi.org/10.1016/j.palaeo.2007.10.032.
[5]. Duque, R. and Ordoñez, J. I. (2013) Lessons on the Management of Flood Risk in Colombia, South America. [pdf] Proceedings of 2013 IAHR World Congress. Chengdu: Tsinghua University Press. Available at: https://www.iahr.org/library/infor?pid=15080 [Accessed 12 March 2023].
[6]. Few, R. et al. (2021) “Moving with risk: Forced displacement and vulnerability to hazards in Colombia,” World Development, 144, p. 105482. Available at: https://doi.org/10.1016/j.worlddev.2021.105482.
[7]. Our World in Data (n.d.) Population, 10,000 BCE to 2021. Available at: https://ourworldindata.org/grapher/population?tab=chart&country=COL [Accessed 12 March 2023].
[8]. World Bank Group (n.d.) GNI per capita, Atlas method (current US$) – Colombia. Available at: https://data.worldbank.org/indicator/NY.GNP.PCAP.CD?locations=CO [Accessed 12 March 2023].
[9]. U.S. Central Intelligence Agency (2008) Colombia (Shaded Relief). Available through: https://maps.lib.utexas.edu/maps/colombia.html [Accessed 8 April 2023].
[10]. International Committee of the Red Cross Climate Centre (2021) Colombia. [pdf] [no place]: International Committee of the Red Cross. Available at: https://www.climatecentre.org/wp-content/uploads/RCCC-ICRC-Country-profiles-Colombia.pdf [Accessed 4 March 2023].
[11]. Shimizu, M. H., Ambrizzi, T. and Liebmann, B. (2016) “Extreme precipitation events and their relationship with Enso and MJO phases over northern South America,” International Journal of Climatology, 37(6), pp. 2977–2989. Available at: https://doi.org/10.1002/joc.4893.
[12]. World Bank Group (n.d.) Colombia: Current Climate – Climatology. Available at: https://climateknowledgeportal.worldbank.org/country/colombia/climate-data-historical [Accessed 4 March 2023].
[13]. International Federation of Red Cross and Red Crescent Societies (2022) Colombia: Floods - DREF Plan of Action (EPoA), Operation n° MDRCO021. [pdf] [no place]: International Federation of Red Cross and Red Crescent Societies. Available: https://reliefweb.int/attachments/fe760772-fc5d-434c-9518-e030b8a62a66/MDRCO021do.pdf [Accessed 12 March 2023].
[14]. Colombia Encyclopædia Britannica. Encyclopædia Britannica, inc. Available at: https://www.britannica.com/place/Colombia [Accessed: March 30, 2023].
[15]. O'Neill, B. C. et al. (2016) The scenario model intercomparison project (scenariomip) for CMIP6, Geoscientific Model Development. Copernicus GmbH. Available at: https://gmd.copernicus.org/articles/9/3461/2016/ [Accessed 30 March 2023].
[16]. Copernicus Climate Data Store (2023) Copernicus Climate Data Store |. Available at: https://cds.climate.copernicus.eu/#!/home (Accessed: 20 June 2023).
[17]. Campos, M. C., Chiessi, C. M., Prange, M., Mulitza, S., Kuhnert, H., Paul, A., Venancio, I. M., Albuquerque, A. L., Cruz, F. W., & Bahr, A. (2019). A new mechanism for millennial scale positive precipitation anomalies over tropical South America. Quaternary Science Reviews, 225, 105990. https://doi.org/10.1016/j.quascirev.2019.105990
[18]. Lu, J., Vecchi, G. A., & Reichler, T. (2007). Expansion of the Hadley cell under Global Warming. Geophysical Research Letters, 34(6). doi:10.1029/2006gl028443
[19]. Poveda, G., Jaramillo, A., Gil, M. M., Quiceno, N., & Mantilla, R. I. (2001). Seasonally in enso-related precipitation, river discharges, soil moisture, and vegetation index in Colombia. Water Resources Research, 37(8), 2169–2178. doi:10.1029/2000wr900395
[20]. Lucas, C., Timbal, B., & Nguyen, H. (2013). The expanding tropics: A critical assessment of the observational and Modeling Studies. WIREs Climate Change, 5(1), 89–112. doi:10.1002/wcc.251
[21]. Zular, A., Sawakuchi, A. O., Chiessi, C. M., d’Horta, F. M., Cruz, F. W., Demattê, J. A., … Soares, E. A. (2019). The role of abrupt climate change in the formation of an open vegetation enclave in northern Amazonia during the late quaternary. Global and Planetary Change, 172, 140–149. doi:10.1016/j.gloplacha.2018.09.006
[22]. Cremon, É. H., Rossetti, D. de, Sawakuchi, A. de, & Cohen, M. C. (2016). The role of tectonics and climate in the late quaternary evolution of a northern Amazonian River. Geomorphology, 271, 22–39. doi:10.1016/j.geomorph.2016.07.030
[23]. Yang, H., Lohmann, G., Shi, X., & Müller, J. (2023). Evaluating the mechanism of tropical expansion using idealized numerical experiments. Ocean-Land-Atmosphere Research, 2. doi:10.34133/olar.0004
[24]. Caviedes, C. N. (2007). Impacts of el niño-southern oscillation on natural and human systems. The Physical Geography of South America. doi:10.1093/oso/9780195313413.003.0028
[25]. Ambrizzi, T., Souza, E.B., Pulwarty, R. S. (2004) The Hadley and walker regional circulations and associated ENSO impacts on South American seasonal rainfall. In The Hadley Circulation: Present, Past and Future, HF Diaz, RS Bradley (eds). Kluwer Publishers: Dordrecht, The Netherlands, 203– 235.
[26]. Pohl, B. et al. (2010) “Relationships between the Antarctic oscillation, the madden–julian oscillation, and Enso, and consequences for rainfall analysis,” Journal of Climate, 23(2), pp. 238–254. Available at: https://doi.org/10.1175/2009jcli2443.1.
[27]. Van Aalst, M. K. (2006). The impacts of climate change on the risk of natural disasters. Disasters, 30(1), 5–18. https://doi.org/10.1111/j.1467-9523.2006.00303.x
[28]. Camargo, A. (2021) Chapter 3: Stagnation. In: Krause, F and Harris, M., eds. DELTA LIFE: Exploring Dynamic Environments where Rivers Meet the Sea. Available at: https://www.berghahnbooks.com/title/KrauseDelta [Accessed 12 March 2023].
[29]. Campbell-Gale, H. K., Fletcher, A. J., and Reed, M. G. (2023) “A heart attack away from boarding up Main Street”: How neoliberalization of farming shapes adaptive capacity to climate change in rural and small-town Saskatchewan, Canada. Journal of Rural Studies, 97(1), 365–374. https://doi.org/10.1016/j.jrurstud.2022.12.031
[30]. Zermoglio, F. and Dove, M. (2021) Climate Risk Country Profile: Colombia. [pdf] Washington, DC: World Bank Publications. Available at: https://climateknowledgeportal.worldbank.org/sites/default/files/2021-07/15520-WB_Colombia%20Country%20Profile-WEB%20%283%29.pdf [Accessed 1 April 2023].
[31]. Fernández, F. (2011) THE GREATEST IMPEDIMENT TO THE STUDY OF BIODIVERSITY IN COLOMBIA. Caldasia, 33(2), iii–v. Retrieved from https://www.jstor.org/stable/23642018?casa_token=JMnKtneOMYMAAAAA%3AWi4GlgFxEh-pRRWvovy80UJbT7h5m1Z5OBFmzDx3DFsUObuoSdrsNs5JrcX86ak_m2N2_ah9VF83cV4nqs1a15udWDcoetXO1cpOdBZN913Oru7WwA
[32]. Castro, B. (2019) Chapter 6 - The shifting limits of drought adaptation in rural Colombia (E. Mapedza, D. Tsegai, M. Bruntrup, & R. Mcleman, Eds.). Retrieved April 27, 2023, from ScienceDirect website: https://www.sciencedirect.com/science/article/abs/pii/B9780128148204000067?casa_token=p8tEvkrMCYMAAAAA:LhWgQB_k5shaIwQX0w8B33WoQKZE-bXLddo55PVQefk4SoHEaFYHElb6pdCyQMKwvnosp548
Cite this article
Chen,S. (2023). Hydro-climatic variability anomalies over south America with El Niño-southern oscillation: Precipitation Anomalies and their socio-economic impact in the Colombia country. Theoretical and Natural Science,7,50-62.
Data availability
The datasets used and/or analyzed during the current study will be available from the authors upon reasonable request.
Disclaimer/Publisher's Note
The statements, opinions and data contained in all publications are solely those of the individual author(s) and contributor(s) and not of EWA Publishing and/or the editor(s). EWA Publishing and/or the editor(s) disclaim responsibility for any injury to people or property resulting from any ideas, methods, instructions or products referred to in the content.
About volume
Volume title: Proceedings of the 2023 International Conference on Environmental Geoscience and Earth Ecology
© 2024 by the author(s). Licensee EWA Publishing, Oxford, UK. This article is an open access article distributed under the terms and
conditions of the Creative Commons Attribution (CC BY) license. Authors who
publish this series agree to the following terms:
1. Authors retain copyright and grant the series right of first publication with the work simultaneously licensed under a Creative Commons
Attribution License that allows others to share the work with an acknowledgment of the work's authorship and initial publication in this
series.
2. Authors are able to enter into separate, additional contractual arrangements for the non-exclusive distribution of the series's published
version of the work (e.g., post it to an institutional repository or publish it in a book), with an acknowledgment of its initial
publication in this series.
3. Authors are permitted and encouraged to post their work online (e.g., in institutional repositories or on their website) prior to and
during the submission process, as it can lead to productive exchanges, as well as earlier and greater citation of published work (See
Open access policy for details).
References
[1]. Intergovernmental Panel on Climate Change (2018) IPCC 2018: Summary for policymakers, In: Masson-Delmotte V et al (eds) Global Warming of 1.5 ℃., pp. 1–24. Available at: https://doi.org/10.1017/9781009157940.001.
[2]. Marengo, J. A. et al. (2011) “Development of regional future climate change scenarios in South America using the ETA CPTEC/HadCM3 Climate Change Projections: Climatology and regional analyses for the Amazon, São Francisco and the Paraná River basins,” Climate Dynamics, 38(9-10), pp. 1829–1848. Available at: https://doi.org/10.1007/s00382-011-1155-5.
[3]. Andreoli, R.V. et al. (2016) “The influence of different El Niño types on the South American rainfall,” International Journal of Climatology, 37(3), pp. 1374–1390. Available at: https://doi.org/10.1002/joc.4783.
[4]. Garreaud, R. D. et al. (2009) “Present-day South American climate,” Palaeogeography, Palaeoclimatology, Palaeoecology, 281(3-4), pp. 180–195. Available at: https://doi.org/10.1016/j.palaeo.2007.10.032.
[5]. Duque, R. and Ordoñez, J. I. (2013) Lessons on the Management of Flood Risk in Colombia, South America. [pdf] Proceedings of 2013 IAHR World Congress. Chengdu: Tsinghua University Press. Available at: https://www.iahr.org/library/infor?pid=15080 [Accessed 12 March 2023].
[6]. Few, R. et al. (2021) “Moving with risk: Forced displacement and vulnerability to hazards in Colombia,” World Development, 144, p. 105482. Available at: https://doi.org/10.1016/j.worlddev.2021.105482.
[7]. Our World in Data (n.d.) Population, 10,000 BCE to 2021. Available at: https://ourworldindata.org/grapher/population?tab=chart&country=COL [Accessed 12 March 2023].
[8]. World Bank Group (n.d.) GNI per capita, Atlas method (current US$) – Colombia. Available at: https://data.worldbank.org/indicator/NY.GNP.PCAP.CD?locations=CO [Accessed 12 March 2023].
[9]. U.S. Central Intelligence Agency (2008) Colombia (Shaded Relief). Available through: https://maps.lib.utexas.edu/maps/colombia.html [Accessed 8 April 2023].
[10]. International Committee of the Red Cross Climate Centre (2021) Colombia. [pdf] [no place]: International Committee of the Red Cross. Available at: https://www.climatecentre.org/wp-content/uploads/RCCC-ICRC-Country-profiles-Colombia.pdf [Accessed 4 March 2023].
[11]. Shimizu, M. H., Ambrizzi, T. and Liebmann, B. (2016) “Extreme precipitation events and their relationship with Enso and MJO phases over northern South America,” International Journal of Climatology, 37(6), pp. 2977–2989. Available at: https://doi.org/10.1002/joc.4893.
[12]. World Bank Group (n.d.) Colombia: Current Climate – Climatology. Available at: https://climateknowledgeportal.worldbank.org/country/colombia/climate-data-historical [Accessed 4 March 2023].
[13]. International Federation of Red Cross and Red Crescent Societies (2022) Colombia: Floods - DREF Plan of Action (EPoA), Operation n° MDRCO021. [pdf] [no place]: International Federation of Red Cross and Red Crescent Societies. Available: https://reliefweb.int/attachments/fe760772-fc5d-434c-9518-e030b8a62a66/MDRCO021do.pdf [Accessed 12 March 2023].
[14]. Colombia Encyclopædia Britannica. Encyclopædia Britannica, inc. Available at: https://www.britannica.com/place/Colombia [Accessed: March 30, 2023].
[15]. O'Neill, B. C. et al. (2016) The scenario model intercomparison project (scenariomip) for CMIP6, Geoscientific Model Development. Copernicus GmbH. Available at: https://gmd.copernicus.org/articles/9/3461/2016/ [Accessed 30 March 2023].
[16]. Copernicus Climate Data Store (2023) Copernicus Climate Data Store |. Available at: https://cds.climate.copernicus.eu/#!/home (Accessed: 20 June 2023).
[17]. Campos, M. C., Chiessi, C. M., Prange, M., Mulitza, S., Kuhnert, H., Paul, A., Venancio, I. M., Albuquerque, A. L., Cruz, F. W., & Bahr, A. (2019). A new mechanism for millennial scale positive precipitation anomalies over tropical South America. Quaternary Science Reviews, 225, 105990. https://doi.org/10.1016/j.quascirev.2019.105990
[18]. Lu, J., Vecchi, G. A., & Reichler, T. (2007). Expansion of the Hadley cell under Global Warming. Geophysical Research Letters, 34(6). doi:10.1029/2006gl028443
[19]. Poveda, G., Jaramillo, A., Gil, M. M., Quiceno, N., & Mantilla, R. I. (2001). Seasonally in enso-related precipitation, river discharges, soil moisture, and vegetation index in Colombia. Water Resources Research, 37(8), 2169–2178. doi:10.1029/2000wr900395
[20]. Lucas, C., Timbal, B., & Nguyen, H. (2013). The expanding tropics: A critical assessment of the observational and Modeling Studies. WIREs Climate Change, 5(1), 89–112. doi:10.1002/wcc.251
[21]. Zular, A., Sawakuchi, A. O., Chiessi, C. M., d’Horta, F. M., Cruz, F. W., Demattê, J. A., … Soares, E. A. (2019). The role of abrupt climate change in the formation of an open vegetation enclave in northern Amazonia during the late quaternary. Global and Planetary Change, 172, 140–149. doi:10.1016/j.gloplacha.2018.09.006
[22]. Cremon, É. H., Rossetti, D. de, Sawakuchi, A. de, & Cohen, M. C. (2016). The role of tectonics and climate in the late quaternary evolution of a northern Amazonian River. Geomorphology, 271, 22–39. doi:10.1016/j.geomorph.2016.07.030
[23]. Yang, H., Lohmann, G., Shi, X., & Müller, J. (2023). Evaluating the mechanism of tropical expansion using idealized numerical experiments. Ocean-Land-Atmosphere Research, 2. doi:10.34133/olar.0004
[24]. Caviedes, C. N. (2007). Impacts of el niño-southern oscillation on natural and human systems. The Physical Geography of South America. doi:10.1093/oso/9780195313413.003.0028
[25]. Ambrizzi, T., Souza, E.B., Pulwarty, R. S. (2004) The Hadley and walker regional circulations and associated ENSO impacts on South American seasonal rainfall. In The Hadley Circulation: Present, Past and Future, HF Diaz, RS Bradley (eds). Kluwer Publishers: Dordrecht, The Netherlands, 203– 235.
[26]. Pohl, B. et al. (2010) “Relationships between the Antarctic oscillation, the madden–julian oscillation, and Enso, and consequences for rainfall analysis,” Journal of Climate, 23(2), pp. 238–254. Available at: https://doi.org/10.1175/2009jcli2443.1.
[27]. Van Aalst, M. K. (2006). The impacts of climate change on the risk of natural disasters. Disasters, 30(1), 5–18. https://doi.org/10.1111/j.1467-9523.2006.00303.x
[28]. Camargo, A. (2021) Chapter 3: Stagnation. In: Krause, F and Harris, M., eds. DELTA LIFE: Exploring Dynamic Environments where Rivers Meet the Sea. Available at: https://www.berghahnbooks.com/title/KrauseDelta [Accessed 12 March 2023].
[29]. Campbell-Gale, H. K., Fletcher, A. J., and Reed, M. G. (2023) “A heart attack away from boarding up Main Street”: How neoliberalization of farming shapes adaptive capacity to climate change in rural and small-town Saskatchewan, Canada. Journal of Rural Studies, 97(1), 365–374. https://doi.org/10.1016/j.jrurstud.2022.12.031
[30]. Zermoglio, F. and Dove, M. (2021) Climate Risk Country Profile: Colombia. [pdf] Washington, DC: World Bank Publications. Available at: https://climateknowledgeportal.worldbank.org/sites/default/files/2021-07/15520-WB_Colombia%20Country%20Profile-WEB%20%283%29.pdf [Accessed 1 April 2023].
[31]. Fernández, F. (2011) THE GREATEST IMPEDIMENT TO THE STUDY OF BIODIVERSITY IN COLOMBIA. Caldasia, 33(2), iii–v. Retrieved from https://www.jstor.org/stable/23642018?casa_token=JMnKtneOMYMAAAAA%3AWi4GlgFxEh-pRRWvovy80UJbT7h5m1Z5OBFmzDx3DFsUObuoSdrsNs5JrcX86ak_m2N2_ah9VF83cV4nqs1a15udWDcoetXO1cpOdBZN913Oru7WwA
[32]. Castro, B. (2019) Chapter 6 - The shifting limits of drought adaptation in rural Colombia (E. Mapedza, D. Tsegai, M. Bruntrup, & R. Mcleman, Eds.). Retrieved April 27, 2023, from ScienceDirect website: https://www.sciencedirect.com/science/article/abs/pii/B9780128148204000067?casa_token=p8tEvkrMCYMAAAAA:LhWgQB_k5shaIwQX0w8B33WoQKZE-bXLddo55PVQefk4SoHEaFYHElb6pdCyQMKwvnosp548