


1. Introduction
The importance of the brain for human beings is similar to the CPU for computers, the brain is the CPU of human beings, so brain diseases are the most fatal for human beings This human CPU determines every aspect of the human race. For example, cognitive function, when a person gradually into old age, just like a computer used for too long, the brain as the central processor will have problems, in China, the elderly, suffering from mild cognitive impairment is 15.5% [1]. The brain has a part to play in depression, for example, the most common form of depression among modern young people. Cancer progression killed more than 100,000 RCC patients each year [2-4]. The most devastating damage to the brain is brain cancer, which accounts for only 2% of all types of cancer, but is difficult to cure and has a high mortality rate [5].
Among all types of brain cancer, glioblastoma accounts for 80 percent of intracranial tumors [6]. The survival rate for glioblastoma patients is a limited 12 to 14 months, and just 3 to 5 percent of patients survive beyond three years [7-9].
90-95% of tumor cases are related to the microenvironment in which they occur [10], and tumor progression has been considered an evolutionary and ecological process [11] that involves dynamic and continuous interactions between cancer cells and the tumor. In GBM, the tumor microenvironment controls tumor progression and invasion, and the study of its microenvironment has become a key element in the treatment process [12]. This is precisely the reason why it is so essential to fully understand the GBM tumor microenvironment, and the significant genes that function in the microenvironment. However, the GBM tumor microenvironment is still understudied.
Therefore, the authors employed the TCGA transcriptome data as well as two datasets, stromal score and immune score, to screen genes that are important in the microenvironment of glioblastomas.
2. Methods
2.1. Data source
Transcriptomic data and GBM-related clinical patient data were obtained from the TCGA database (http://portal.gdc.cancer.gov/). Immune score data and stromal score data for GBM were acquired from ESTIMATE [13] (http://bioinformatics.mdanderson.org/estimate/ disease.html). The samples in our study were only those with stromal scores or immune scores.
2.2. Identification of differentially expressed genes
The tertiary samples were classified into two groups: a group with high immune scores and the other group with low immune scores. The limma [14] R package was used to ascertain the genes differentially expressed in these two groups. In addition, in order not to screen out meaningful genes, the screening thresholds were |log2fold change (log2FC)| >0.585, with a false discovery rate (FDR) of smaller than 0.05. Hence, genes with 1.5-fold or more expression variations can be selected. The same procedure was used to select stromal high and stromal low subgroups for differentially expressed genes in the substrate subgroups with high and low scores. Differential genes with immune scores and stromal scores were then subject to intersections.
2.3. Establishment of protein interaction networks(PPI)
Common differential genes for immune score and stromal score were put in the STRING database (https://string-db.org/) [15]. Ctyoscape [16] (3.9.1) software was used to visualize and quantify the degree of interactions for each gene. The results were compared to the Ctyoscape results .
2.4. KEGG and GO functional enrichment analysis
The author conducted KEGG(Kyoto Encyclopedia of Genes and Genomes) and GO (gene ontology) analyses by means of the clusterProfiler [17] package. GO includes CC(cellular components), BP(biological process), and MF(molecular functions). To prevent loss of meaningful features, the FDR of KEGG pathways was set to be smaller than 0.1.
2.5. Analysis of differential expression and potential prognostic genes
Thirty differentially expressed genes with the highest weight of interactions were then screened for latent independent prognostic genes through Cox univariate analysis using the 'limma’, ‘survminer', and ‘survival’ R packages. To filter the clinical relevance of these genes with independent prognostic, a Kaplan-Meier survival analysis was also carried out.
2.6. Identification of LncRNAs associated with GBM microenvironmental genes
LncRNAs and the expression profiles of 87 intersecting genes were subject to a co-expression correlation analysis by aid of the limma package whose cor is bigger than 0.6 and p is smaller than 0.001. Co-expression results are presented in a Sankey diagram.
3. Results
3.1. Basic information analysis of patient samples
Despite the emergence of more and more treatment and diagnostic modalities [18-22], GBM is still the deadliest primary brain tumor, with the average survival time of patients having increased from 14.6 months to 20.5 months [23-27]. So we tested whether our patient sample were in line with the previous statistical reports, screened out the cases that had died and performed the statistics, and the results are presented in Table 1. The total number of cases that have died is 103. The samples that have died totaled 103 cases, of which 69 survived less than 15 months accounting for 67% of the total sample size, 34 survived between 15 and 90 months accounting for 33% of the total sample, and 3 patients survived more than 5 years accounting for only 2.9% of the deaths, and when the surviving and deceased patients were combined again and the cases with unknown survival times were removed, the cases that survived more than five years.
Table 1. Statistics of GBM cases.
Characteristics | Number of case (%) |
Cases that have died | |
<15 months | 69(67%) |
>15 months | 34(33%) |
> 5 years | 3(2.9%) |
All case samples | |
> 5 years | 20(3.4%) |
3.2. Identification of differential genes in the two groups with high and low immune scores and in the two group with high and low stromal scores
To sort out differentially expressed genes with immune scores and stromal scores, median immune scores were used to classify samples with immune scores into two groups: the group with high immune scores and the group with low immune scores. According to this classification, 76 cases and 77 cases fall into the high score and low score groups, respectively. Samples with stromal scores grouped in the same way, with 73 cases and 80 cases falling into the high stromal score group and the low stromal score group, respectively. Furthermore, the author adopted the limma R package to search for differentially expressed genes in the two groups with high and low immune scores and the two groups with high and low stromal scores, as shown in the two heatmaps in Figures 1A and 1B. Among the differential genes in the two groups of high and low immune scores, 137 are identified, and among the differential genes in the two groups of high and low stromal scores, 107 are discovered. The two sets of differential genes taken to intersect are shown in Figure C Wayne plots, and 87 genes are obtained.
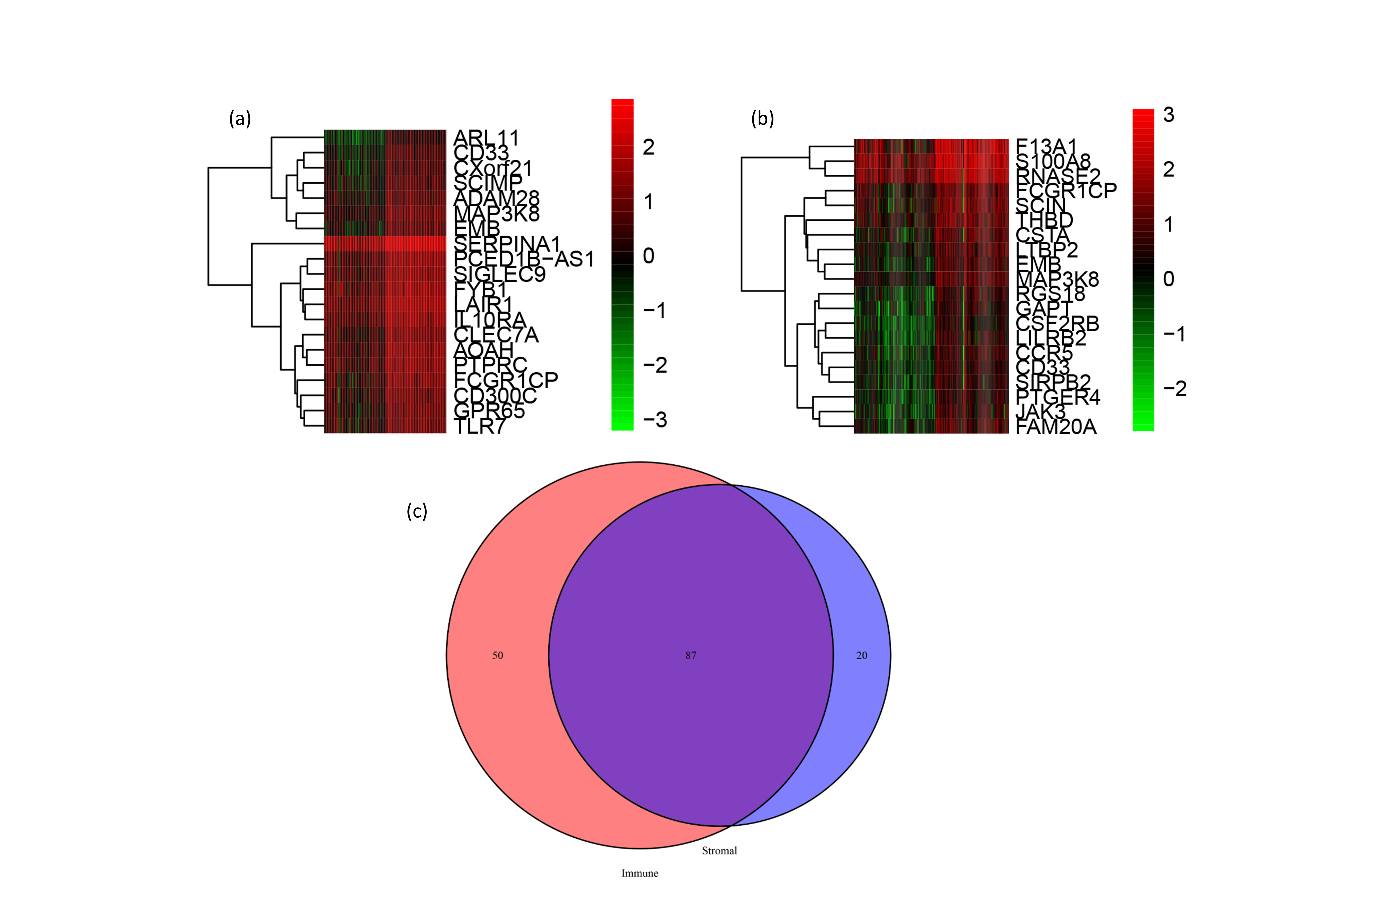
Figure 1. Differential genes in high and low subgroups of immune score and stromal score. (a)Differential genes in high and low subgroups of immune score. (b) Differential genes in high and low subgroups of stromal score. (c) Wayne plots relfecting the intersection of differential genes in the immune score group and the stromal score group.
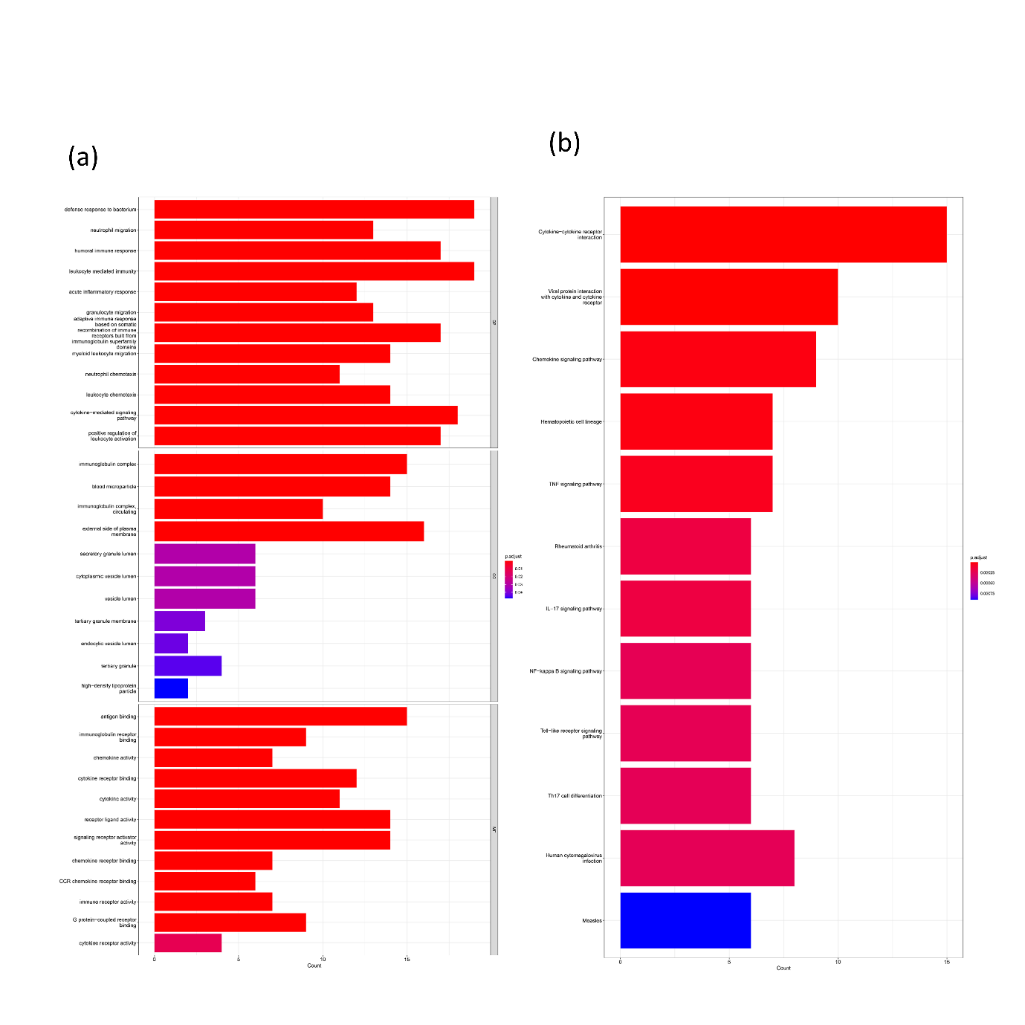
Figure 2. Functional enrichment analysis of intersecting genes. (a) Top 12 molecular functions (MF) terms, cellular components (CC) terms, and biological process (BP) terms, (b) Top 12 Kyoto Encyclopedia of Genes and Genomes (KEGG).
3.3. Functional enrichment analysis of 87 genes
For investigating the biological function of the 87 intersecting genes, this study conducted GO enrichment analysis to demonstrate the first 12 categories of BP,CC,MF as demonstrated in Figure 2A. KEGG was used to demonstrate the signaling pathways in which these genes are involved as shown in Figure 2B just like the GO enrichment analysis, we also show the first 12 terms. Under the entry for biological processes these genes are primarily involved in some of the procedures of immunization, such as neutrophil migration, humoral immune response and acute inflammatory response, and so forth. Neutrophil migration bioprocess is important for the treatment of glioblastoma, and this neutrophil has a very important role in glioblastoma migration. It can directly drive the migration of tumor cells, or indirectly promote the migration of tumor cells in glioblastoma by recruiting macrophages [28]. The molecular function of these genes is concentrated in the immune-related structures such as immune receptor activity, immunoglobulin receptor binding, and antigen binding. KEGG results were concentrated in two pathways, B and Cytokine-cytokine receptor interaction. Particularly Chemokine signaling pathway is very important for targeting cancer, such as CCL2 and its receptor CCR2, a signaling axis [29].
3.4. Protein-protein interaction analysis to screen core genes
The result of STRING has 67 nodes and 297 edge results as shown in Figure 3A for Cytoscape visualization. The interaction weights of each node were calculated as shown in Figure 3B, which is somewhat from the Cytoscape results, since most people would choose the Cytoscape results hence we opted for the top 30 genes in the Cytoscape results for the subsequent analysis. After KM survival analysis on the 30 genes, the results manifested that very poor prognosis was attributed to the effect of seven genes, i.e. SAA1, TREM1, LILRB2, FCGR2B, CXCL5, MRC1, CCL18, of which SAA1 was the most significant, it had a P-value of log-rank test=0.01032, as shown in Figure 3C. SAA1 indeed has a very influential role in both glioblast expansion metastasis invasion [30-34], the remaining six genes in Figure 4.
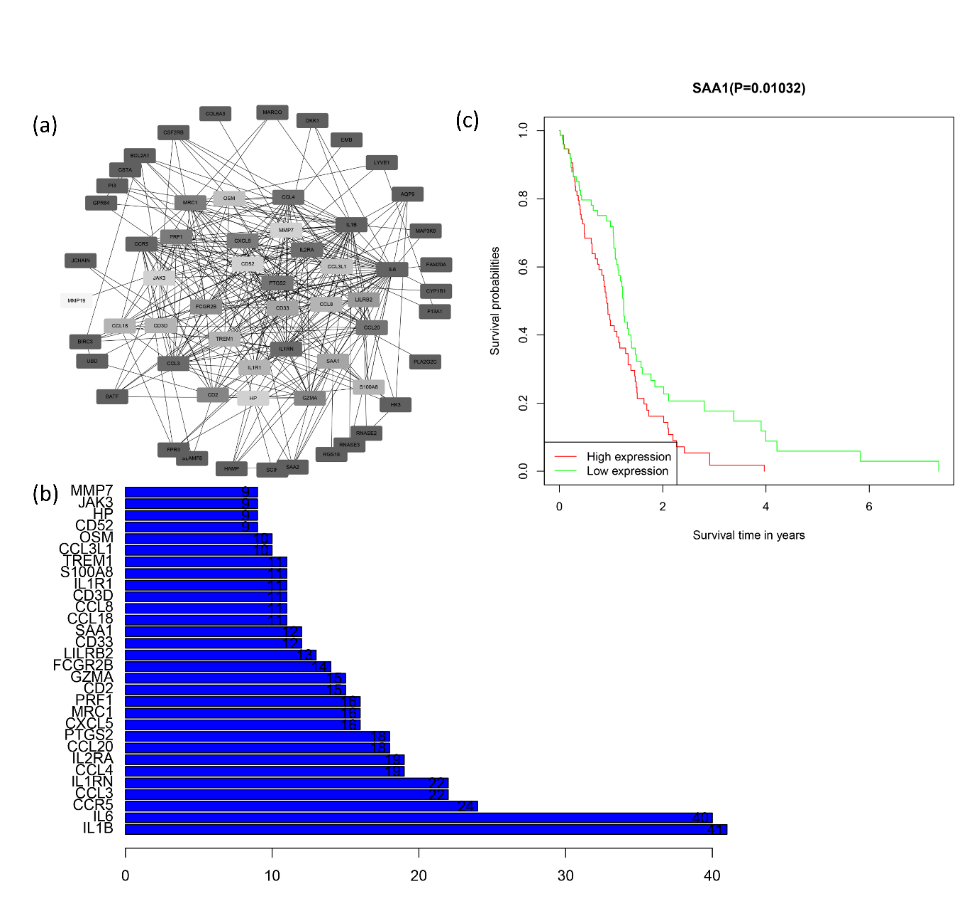
Figure 3. Protein-protein interaction network analysis and identification of core genes. (a) PPI network analysis of 87 intersecting genes. (b) Top 30 genes with the most interactions (c) Kaplan-Meier curve of SAA1. There is a specific relationship between SAA1 high expression and the poor overall survival of gliblastma.
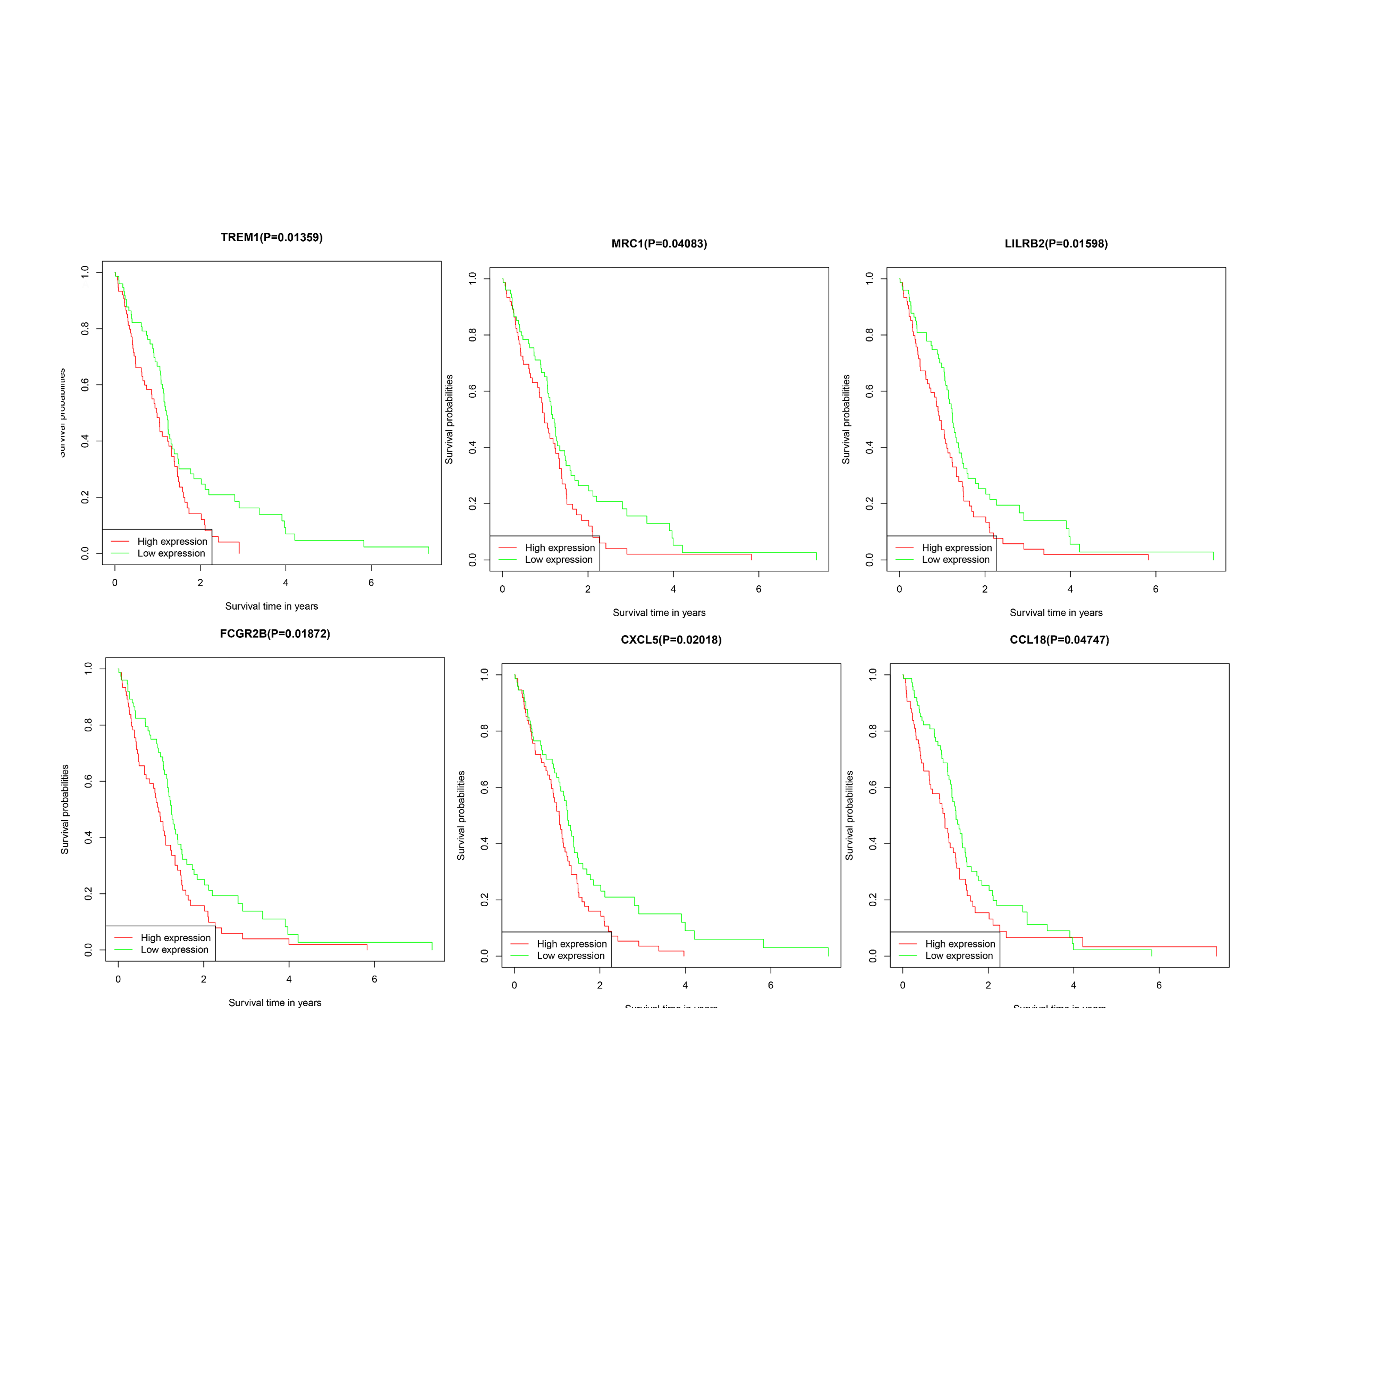
Figure 4. Kaplan-Meier curve of TREM1, MRC1, LILRB2, FCGR2B, CXCL5, CCL8.
3.5. Functional enrichment analysis of core genes
To determine the biological functions performed by these 30 core genes after the precise range, this study conducted gene enrichment analysis including KEGG and GO analysis on these 30 genes. Figure 5A illustrates the PPI interaction network relationships of these 30 core genes. whereas Figures B and C are showing the GO outcome KEGG results respectively. Through this enrichment precision screen, the genes are roughly enriched in immune-related signaling pathways and biological processes.
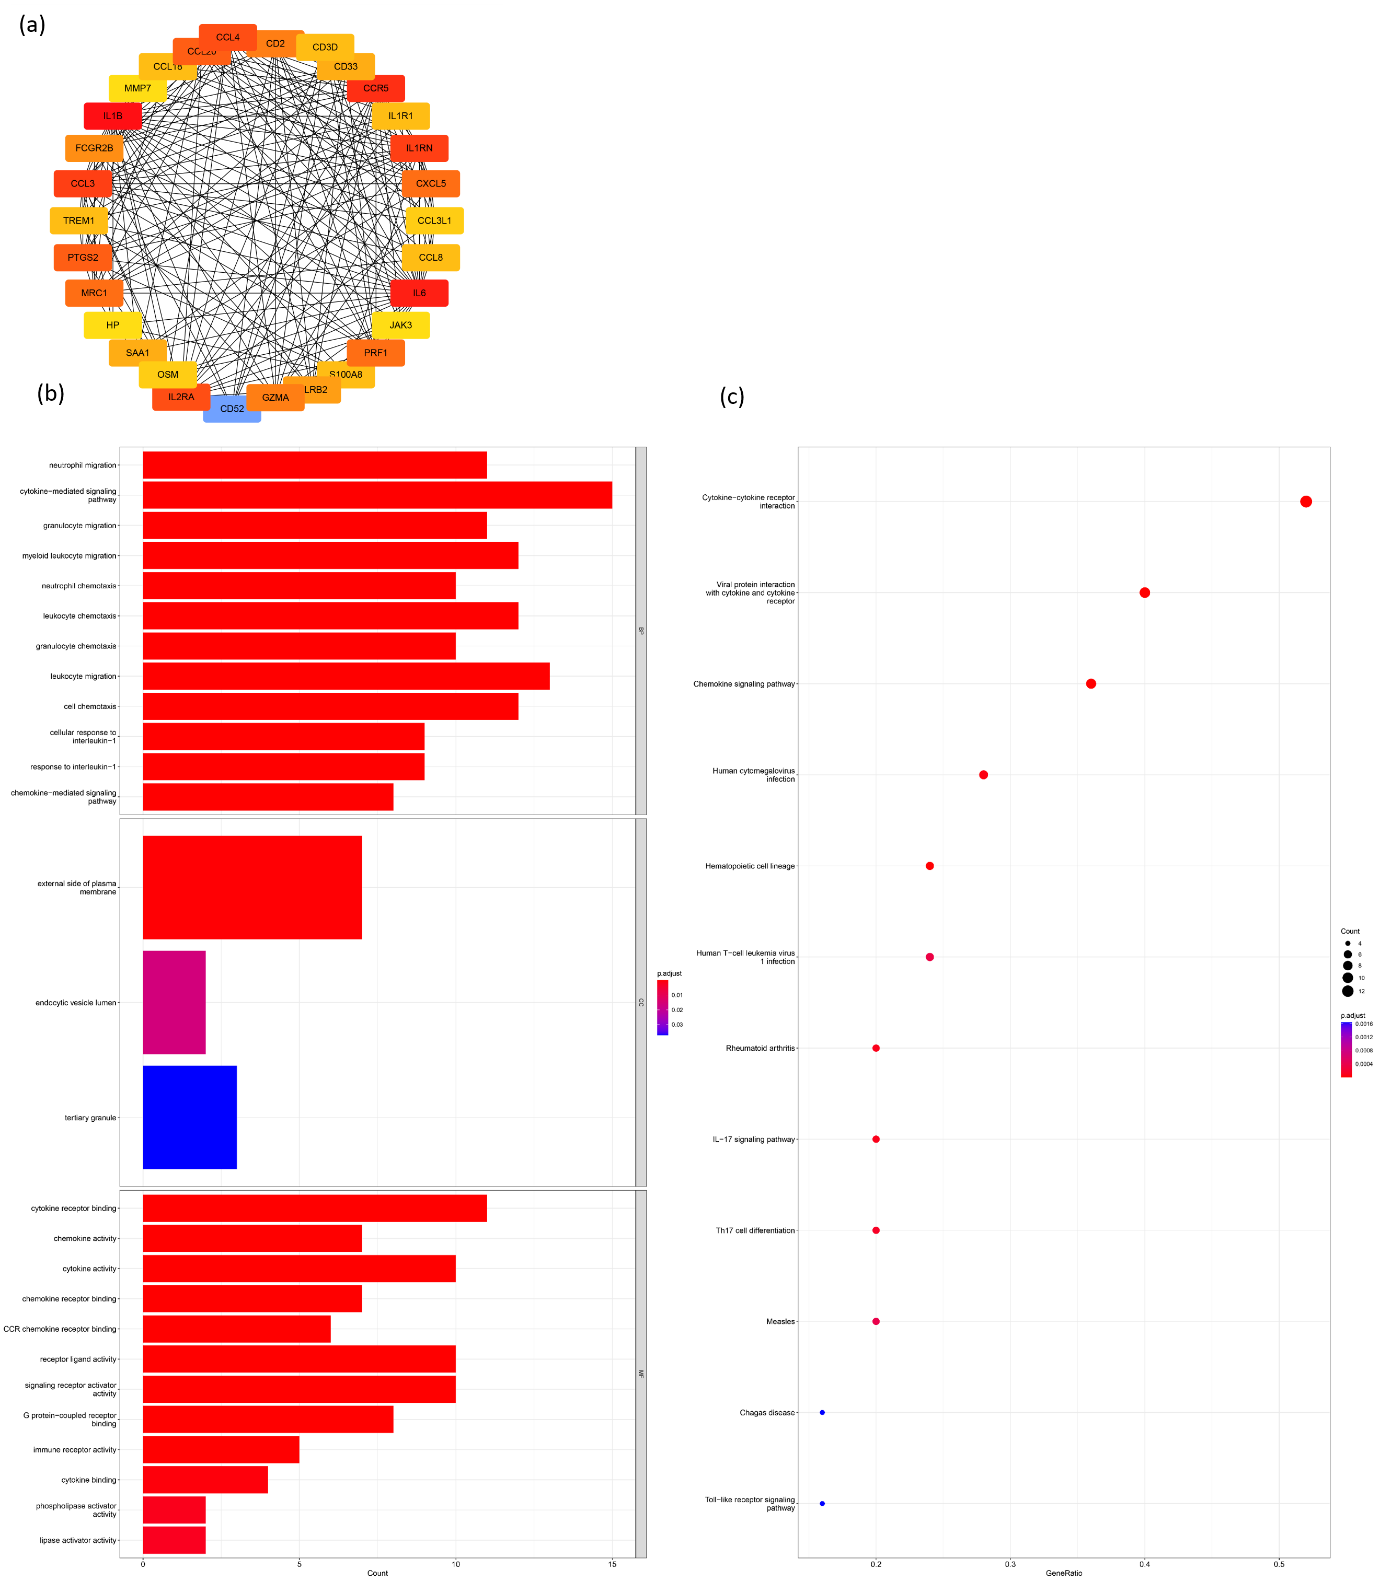
Figure 5. Analysis of PPI networks and functional enrichment of core genes. (a) PPI network of hub genes. (b) Top 12 molecular functions (MF) terms, cellular components (CC) terms, and biological process (BP) terms. (c) Top 12 enriched Kyoto Encyclopedia of Genes and Genomes (KEGG) pathways.
3.6. Analysis of independent potential prognostic hub genes
Since these genes have more interactions with each other, the following task is to identify the genes that can be considered as independent prognostic markers, using Cox univariate analysis, as reflected in Figure 6, the risk factor is greater than 1 and the higher it is, the higher the risk of this gene is, among which the three genes, TREM1, FCGR2B, and CXCL5, are both one of the seven genes in the above analysis and also belong to the independent prognostic markers. Myeloid cells with high expression of TREM1 are a cause of glioblastoma heterogeneity, which has been validated by previous studies, implying that TREM1 has a prominent effect on the immune microenvironment of glioblastoma [35]. FCGR2B is specifically enriched in dendritic cells and tumor-related macrophages, which may be related to GBM recurrence [36]. CXCL5 has been proven to be involved in the progression of GBM in a mouse model [37] and Figure 6 is the flow chart of the whole process.
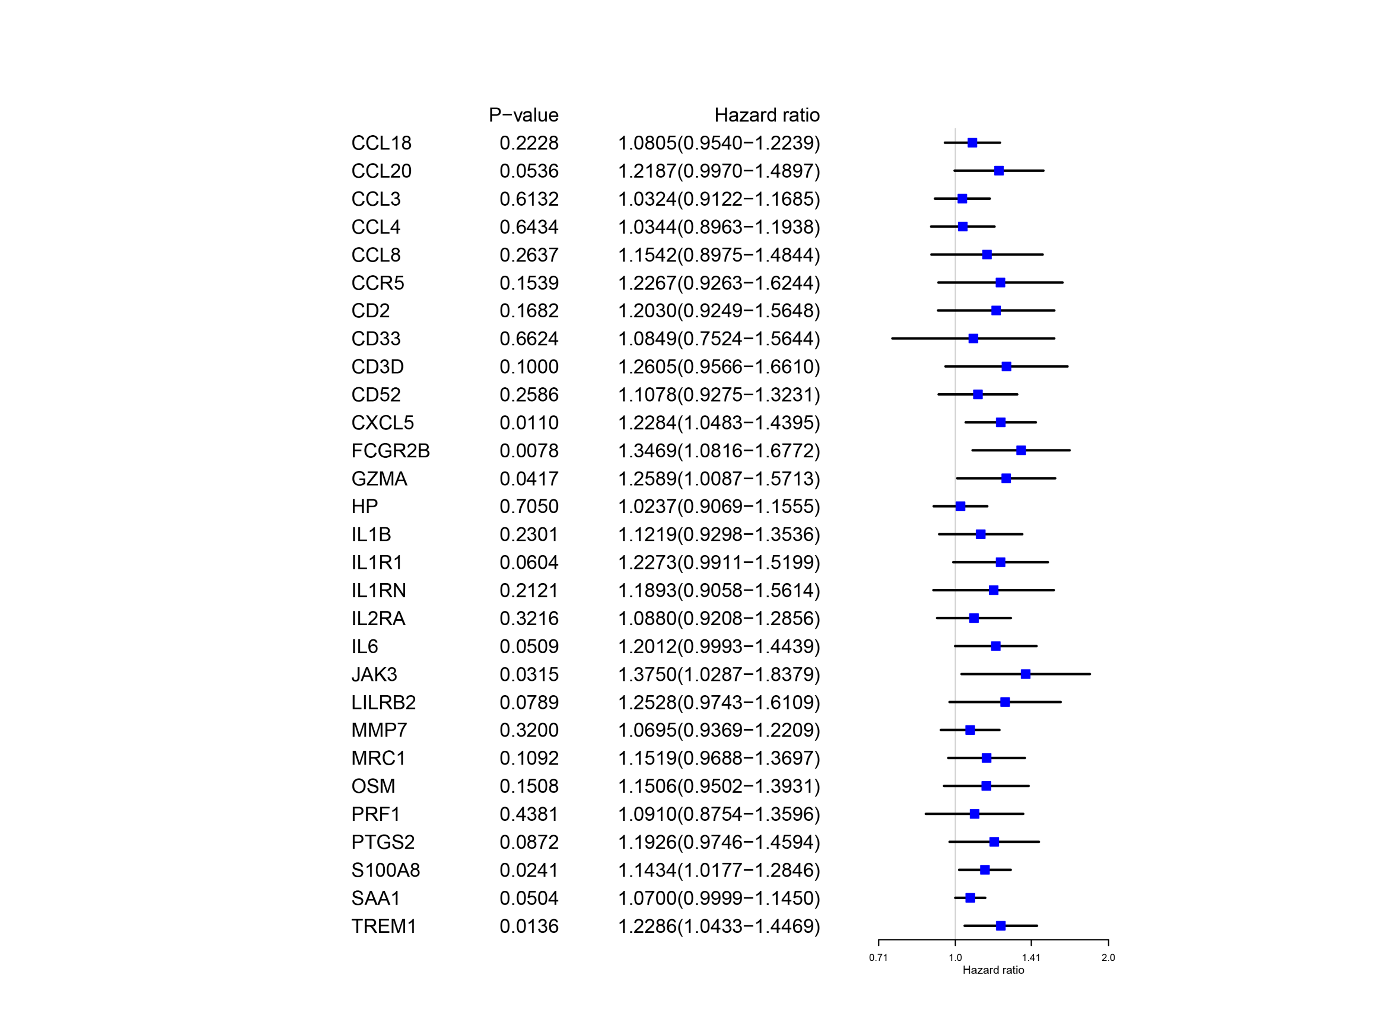
Figure 6. Identification of independent prognostic genes results of the univariate Cox regression analysis.
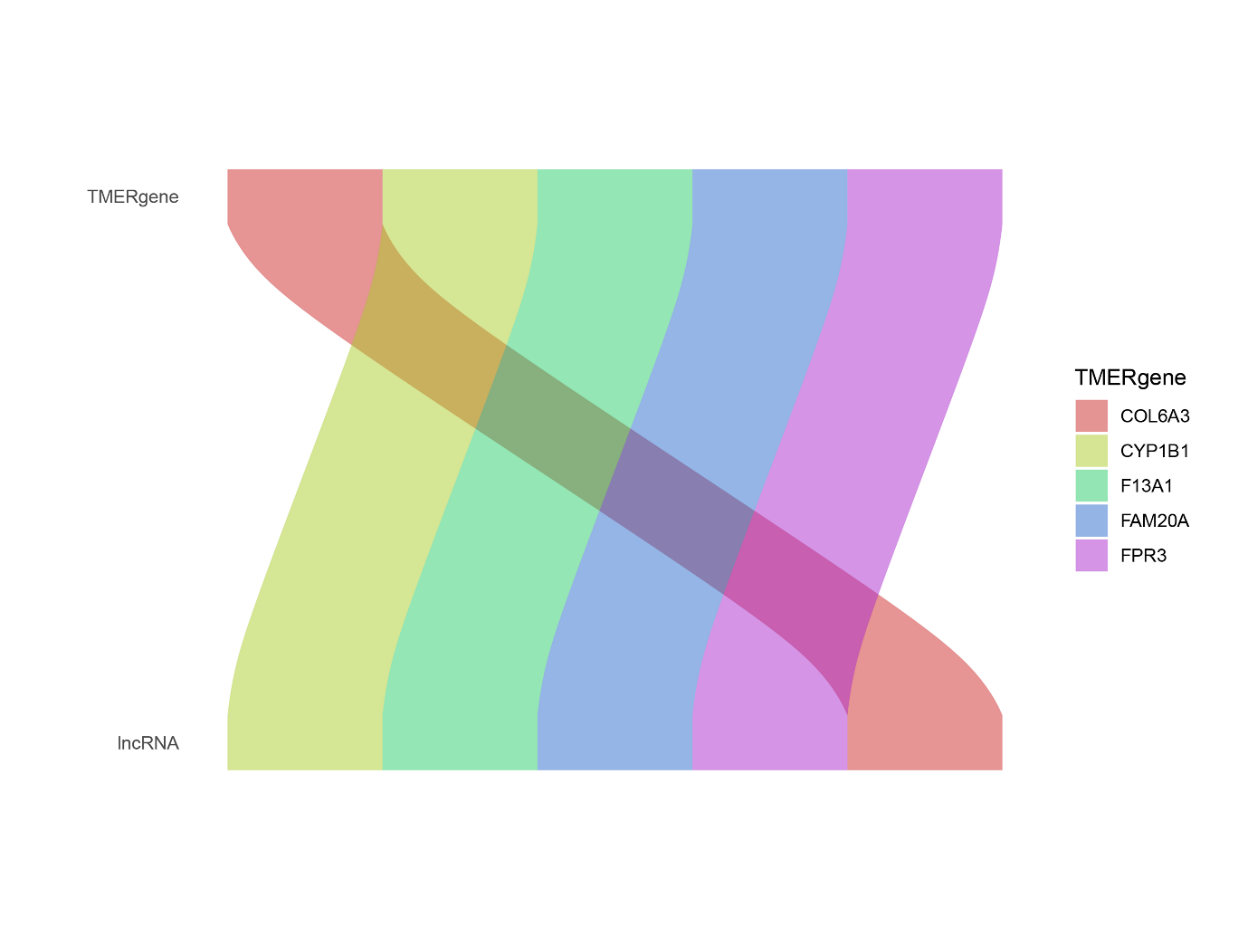
Figure 7. Co-expression analysis of genes and LncRNAs.
The Sankey diagram demonstrates the co-expression of genes with LncRNAs, and the genes listed on the right are among the 87 immune-related genes that have strong co-expression with LncRNAs.
3.7. Identification of co-expressed LncRNAs for immune-related genes
To ascertain LncRNAs related to immune microenvironment-associated genes, the co-expression analysis was conducted by aid of the TCGA transcriptome expression profiles of 87 immune microenvironment-associated genes and the LncRNA expression profiles of GBM, and the results of the Sankey diagram demonstrate the co-expression relationship between the genes shown on the right side and the LncRNA as illustrated in Figure 7. Some details of the results are presented in Table 2.
Table 2. Co-expression relationships between immune microenvironment-related genes and LncRNAs.
TMERgene | lncRNA | cor | pvalue | Regulation |
FPR3 | AP002954.1 | 0.634932 | 1.43E-20 | postive |
CYP1B1 | AC096921.2 | 0.661944 | 8.54E-23 | postive |
F13A1 | AC096921.2 | 0.60136 | 4.28E-18 | postive |
FAM20A | AC096921.2 | 0.619084 | 2.30E-19 | postive |
COL6A3 | LYPLAL1-AS1 | 0.765104 | 6.10E-34 | postive |
4. Discussion
In this paper, we searched for immune-associated differential genes by grouping samples with high and low immune scores and stromal scores, and obtained independent prognostic genes through layers of fine screening, which is in line with the existing results [38]. However, the filter process is more streamlined, and the genes we selected do actually have a crucial function for prognosis and are connected with the immune microenvironment, which again validates the previous studies. For example, LILRB2 is excessively expressed in human GBM and has a specific relationship with GBM tumor immunosuppression, and LILRB2 is a macrophage-associated GBM prognostic gene [39].
Once these genes have been identified, the emphasis of further analysis should be on which cells these genes are highly expressed, what pathways they are involved in, and whether they are immune-related and can be considered as independent prognostic factors, as well as on immune-associated LncRNAs or MicroRNAs. LncRNAs, as a kind of non-coding RNAs with no more than 200 nucleotides [40], have become more and more influential in the investigation of GBM. For example, exosomes play an important role in promoting GBM tumor cells to communicate with tumor-related macrophages, while LncRNAs can transmit from tumor cells to other immune microenvironment-associated cells through exosomes, thus promoting GBM tumors [41], while for instance, lncRNA NEAT1 can contribute to the progression of GBM tumors by means of the EGFR/NEAT1/EZH2/β-catenin axis [42]. MicroRNAs, a kind of single-stranded, non-coding RNAs having 21-25 nucleotides, also function in GBM tumor progression. For example, the forced expression of miR-7, miR-34a, miR-124, miR-128, miR-137, as well as miR-181 family suppresses the progression of GBM tumors [43, 44].
Furthermore, LncRNAs or MicroRNAs related to the GBM immune microenvironment can be further sieved, and subsequent experimental validation can be performed to explore their specific mechanisms.
5. Conclusions
Overall we identified a large quantity of genes associated with the GBM immune microenvironment using a facile screening approach and consistent with previous studies. We also identified five LncRNAs co-expressed with immune-related genes: AP002954.1, AC096921.2, AC096921.2, AC096921.2 and LYPLAL1-AS1. These LncRNAs and genes perhaps can be utilized to structure the prognostic model of GBM may also be promising therapeutic targets for the development of corresponding targeted drugs, however further animal or cellular experiments are yet to be carried out to verify the results.
Data availability statement
All the original contributions shown in this paper are contained in the article and supplementary Materials. It is suggested to connect the corresponding authors or further inquiries.
References
[1]. Jia L, et al Prevalence, risk factors, and management of dementia and mild cognitive impairment in adults aged 60 years or older in China: a cross-sectional study. 2020 Lancet Public Health 5 e661-e71
[2]. Rini BI, Campbell SCand Escudier B Renal cell carcinoma. 2009 Lancet 373 1119-32
[3]. Lan MJ, Rizk MM, Pantazatos SP, Rubin-Falcone H, Miller JM, Sublette ME, Oquendo MA, Keilp JGand Mann JJ Resting-state amplitude of low-frequency fluctuation is associated with suicidal ideation. 2019 Depress Anxiety 36 433-41
[4]. Cao J, et al Resting-state functional MRI of abnormal baseline brain activity in young depressed patients with and without suicidal behavior. 2016 J Affect Disord 205 252-63
[5]. Khazaei Z, et al The association between incidence and mortality of brain cancer and human development index (HDI): an ecological study. 2020 BMC Public Health 20 1696
[6]. Schwartzbaum JA, Fisher JL, Aldape KDand Wrensch M Epidemiology and molecular pathology of glioma. 2006 Nat Clin Pract Neurol 2
[7]. Brandes AA, et al Temozolomide as a second-line systemic regimen in recurrent high-grade glioma: a phase II study. 2001 Ann Oncol 12 255-7
[8]. Krex D, et al Long-term survival with glioblastoma multiforme. 2007 Brain 130 2596-606
[9]. Omuro Aand DeAngelis LM Glioblastoma and other malignant gliomas: a clinical review. 2013 JAMA 310 1842-50
[10]. Anand P, Kunnumakkara AB, Sundaram C, Harikumar KB, Tharakan ST, Lai OS, Sung Band Aggarwal BB Cancer is a preventable disease that requires major lifestyle changes. 2008 Pharm Res 25 2097-116
[11]. Merlo LMF, Pepper JW, Reid BJand Maley CC Cancer as an evolutionary and ecological process. 2006 Nat Rev Cancer 6 924-35
[12]. Tantillo E, Vannini E, Cerri C, Spalletti C, Colistra A, Mazzanti CM, Costa Mand Caleo M Differential roles of pyramidal and fast-spiking, GABAergic neurons in the control of glioma cell proliferation. 2020 Neurobiol Dis 141 104942
[13]. Yoshihara K, et al Inferring tumour purity and stromal and immune cell admixture from expression data. 2013 Nat Commun 4 2612
[14]. Ritchie ME, Phipson B, Wu D, Hu Y, Law CW, Shi Wand Smyth GK limma powers differential expression analyses for RNA-sequencing and microarray studies. 2015 Nucleic Acids Res 43 e47
[15]. Szklarczyk D, et al STRING v11: protein-protein association networks with increased coverage, supporting functional discovery in genome-wide experimental datasets. 2019 Nucleic Acids Res 47 D607-D13
[16]. Shannon P, Markiel A, Ozier O, Baliga NS, Wang JT, Ramage D, Amin N, Schwikowski Band Ideker T Cytoscape: a software environment for integrated models of biomolecular interaction networks. 2003 Genome Res 13 2498-504
[17]. Yu G, Wang L-G, Han Yand He Q-Y clusterProfiler: an R package for comparing biological themes among gene clusters. 2012 OMICS 16 284-7
[18]. Weller M, et al Glioma. 2015 Nat Rev Dis Primers 1 15017
[19]. Louis DN, et al The 2016 World Health Organization Classification of Tumors of the Central Nervous System: a summary. 2016 Acta Neuropathol 131 803-20
[20]. Verhaak RGW, et al Integrated genomic analysis identifies clinically relevant subtypes of glioblastoma characterized by abnormalities in PDGFRA, IDH1, EGFR, and NF1. 2010 Cancer Cell 17
[21]. Lenting K, Verhaak R, Ter Laan M, Wesseling Pand Leenders W Glioma: experimental models and reality. 2017 Acta Neuropathol 133 263-82
[22]. Tan AC, Ashley DM, López GY, Malinzak M, Friedman HSand Khasraw M Management of glioblastoma: State of the art and future directions. 2020 CA Cancer J Clin 70 299-312
[23]. Gilbert MR, et al Dose-dense temozolomide for newly diagnosed glioblastoma: a randomized phase III clinical trial. 2013 J Clin Oncol 31 4085-91
[24]. Chinot OL, et al Bevacizumab plus radiotherapy-temozolomide for newly diagnosed glioblastoma. 2014 N Engl J Med 370 709-22
[25]. Gilbert MR, et al A randomized trial of bevacizumab for newly diagnosed glioblastoma. 2014 N Engl J Med 370 699-708
[26]. Wen PYand Reardon DA Neuro-oncology in 2015: Progress in glioma diagnosis, classification and treatment. 2016 Nat Rev Neurol 12 69-70
[27]. Stupp R, et al Effect of Tumor-Treating Fields Plus Maintenance Temozolomide vs Maintenance Temozolomide Alone on Survival in Patients With Glioblastoma: A Randomized Clinical Trial. 2017 JAMA 318 2306-16
[28]. Chen N, Alieva M, van der Most T, Klazen JAZ, Vollmann-Zwerenz A, Hau Pand Vrisekoop N Neutrophils Promote Glioblastoma Tumor Cell Migration after Biopsy. 2022 Cells 11
[29]. Xu M, Wang Y, Xia R, Wei Yand Wei X Role of the CCL2-CCR2 signalling axis in cancer: Mechanisms and therapeutic targeting. 2021 Cell Prolif 54 e13115
[30]. Knebel FH, Uno M, Galatro TF, Bellé LP, Oba-Shinjo SM, Marie SKNand Campa A Serum amyloid A1 is upregulated in human glioblastoma. 2017 J Neurooncol 132 383-91
[31]. Lin C-Y, et al Serum amyloid A1 in combination with integrin αVβ3 increases glioblastoma cells mobility and progression. 2018 Mol Oncol 12 756-71
[32]. Zhang H, et al SAA1 knockdown promotes the apoptosis of glioblastoma cells via downregulation of AKT signaling. 2021 J Cancer 12 2756-67
[33]. Cao K, Jiang X, Wang B, Ni Zand Chen Y SAA1 Expression as a Potential Prognostic Marker of the Tumor Microenvironment in Glioblastoma. 2022 Front Neurol 13 905561
[34]. Cui Gand Xiao Y Identification of SAA1 as a prognostic biomarker associated with immune infiltration in glioblastoma. 2022 Autoimmunity 55 418-27
[35]. Filippova N, Grimes JM, Leavenworth JW, Namkoong D, Yang X, King PH, Crowley M, Crossman DKand Nabors LB Targeting the TREM1-positive myeloid microenvironment in glioblastoma. 2022 Neurooncol Adv 4 vdac149
[36]. Jin X, et al Fc gamma receptor IIb in tumor-associated macrophages and dendritic cells drives poor prognosis of recurrent glioblastoma through immune-associated signaling pathways. 2022 Front Genet 13 1046008
[37]. Mao P, Wang T, Du C-W, Yu Xand Wang M-D CXCL5 promotes tumorigenesis and angiogenesis of glioblastoma via JAK-STAT/NF-κb signaling pathways. 2023 Mol Biol Rep
[38]. Ji H, Liu Z, Wang F, Sun H, Wang N, Liu Y, Hu Sand You C Novel macrophage-related gene prognostic index for glioblastoma associated with M2 macrophages and T cell dysfunction. 2022 Front Immunol 13 941556
[39]. Wu P, Guo Y, Xiao L, Yuan J, Tang C, Dong Jand Qian Z LILRB2-containing small extracellular vesicles from glioblastoma promote tumor progression by promoting the formation and expansion of myeloid-derived suppressor cells. 2023 Cancer Immunol Immunother 72 2179-93
[40]. Peng WX, Koirala Pand Mo YY LncRNA-mediated regulation of cell signaling in cancer. 2017 Oncogene 36 5661-7
[41]. Li Z, et al Glioblastoma Cell-Derived lncRNA-Containing Exosomes Induce Microglia to Produce Complement C5, Promoting Chemotherapy Resistance. 2021 Cancer Immunol Res 9 1383-99
[42]. Chen Q, et al Long Noncoding RNA NEAT1, Regulated by the EGFR Pathway, Contributes to Glioblastoma Progression Through the WNT/β-Catenin Pathway by Scaffolding EZH2. 2018 Clin Cancer Res 24 684-95
[43]. Banelli B, Forlani A, Allemanni G, Morabito A, Pistillo MPand Romani M MicroRNA in Glioblastoma: An Overview. 2017 Int J Genomics 2017 7639084
[44]. Yang L, Ma Y, Xin Y, Han R, Li Rand Hao X Role of the microRNA 181 family in glioma development. 2018 Mol Med Rep 17 322-9
Cite this article
Xu,Z. (2023). Identification of key genes for glioblastoma microenvironment. Theoretical and Natural Science,8,28-39.
Data availability
The datasets used and/or analyzed during the current study will be available from the authors upon reasonable request.
Disclaimer/Publisher's Note
The statements, opinions and data contained in all publications are solely those of the individual author(s) and contributor(s) and not of EWA Publishing and/or the editor(s). EWA Publishing and/or the editor(s) disclaim responsibility for any injury to people or property resulting from any ideas, methods, instructions or products referred to in the content.
About volume
Volume title: Proceedings of the 2nd International Conference on Modern Medicine and Global Health
© 2024 by the author(s). Licensee EWA Publishing, Oxford, UK. This article is an open access article distributed under the terms and
conditions of the Creative Commons Attribution (CC BY) license. Authors who
publish this series agree to the following terms:
1. Authors retain copyright and grant the series right of first publication with the work simultaneously licensed under a Creative Commons
Attribution License that allows others to share the work with an acknowledgment of the work's authorship and initial publication in this
series.
2. Authors are able to enter into separate, additional contractual arrangements for the non-exclusive distribution of the series's published
version of the work (e.g., post it to an institutional repository or publish it in a book), with an acknowledgment of its initial
publication in this series.
3. Authors are permitted and encouraged to post their work online (e.g., in institutional repositories or on their website) prior to and
during the submission process, as it can lead to productive exchanges, as well as earlier and greater citation of published work (See
Open access policy for details).
References
[1]. Jia L, et al Prevalence, risk factors, and management of dementia and mild cognitive impairment in adults aged 60 years or older in China: a cross-sectional study. 2020 Lancet Public Health 5 e661-e71
[2]. Rini BI, Campbell SCand Escudier B Renal cell carcinoma. 2009 Lancet 373 1119-32
[3]. Lan MJ, Rizk MM, Pantazatos SP, Rubin-Falcone H, Miller JM, Sublette ME, Oquendo MA, Keilp JGand Mann JJ Resting-state amplitude of low-frequency fluctuation is associated with suicidal ideation. 2019 Depress Anxiety 36 433-41
[4]. Cao J, et al Resting-state functional MRI of abnormal baseline brain activity in young depressed patients with and without suicidal behavior. 2016 J Affect Disord 205 252-63
[5]. Khazaei Z, et al The association between incidence and mortality of brain cancer and human development index (HDI): an ecological study. 2020 BMC Public Health 20 1696
[6]. Schwartzbaum JA, Fisher JL, Aldape KDand Wrensch M Epidemiology and molecular pathology of glioma. 2006 Nat Clin Pract Neurol 2
[7]. Brandes AA, et al Temozolomide as a second-line systemic regimen in recurrent high-grade glioma: a phase II study. 2001 Ann Oncol 12 255-7
[8]. Krex D, et al Long-term survival with glioblastoma multiforme. 2007 Brain 130 2596-606
[9]. Omuro Aand DeAngelis LM Glioblastoma and other malignant gliomas: a clinical review. 2013 JAMA 310 1842-50
[10]. Anand P, Kunnumakkara AB, Sundaram C, Harikumar KB, Tharakan ST, Lai OS, Sung Band Aggarwal BB Cancer is a preventable disease that requires major lifestyle changes. 2008 Pharm Res 25 2097-116
[11]. Merlo LMF, Pepper JW, Reid BJand Maley CC Cancer as an evolutionary and ecological process. 2006 Nat Rev Cancer 6 924-35
[12]. Tantillo E, Vannini E, Cerri C, Spalletti C, Colistra A, Mazzanti CM, Costa Mand Caleo M Differential roles of pyramidal and fast-spiking, GABAergic neurons in the control of glioma cell proliferation. 2020 Neurobiol Dis 141 104942
[13]. Yoshihara K, et al Inferring tumour purity and stromal and immune cell admixture from expression data. 2013 Nat Commun 4 2612
[14]. Ritchie ME, Phipson B, Wu D, Hu Y, Law CW, Shi Wand Smyth GK limma powers differential expression analyses for RNA-sequencing and microarray studies. 2015 Nucleic Acids Res 43 e47
[15]. Szklarczyk D, et al STRING v11: protein-protein association networks with increased coverage, supporting functional discovery in genome-wide experimental datasets. 2019 Nucleic Acids Res 47 D607-D13
[16]. Shannon P, Markiel A, Ozier O, Baliga NS, Wang JT, Ramage D, Amin N, Schwikowski Band Ideker T Cytoscape: a software environment for integrated models of biomolecular interaction networks. 2003 Genome Res 13 2498-504
[17]. Yu G, Wang L-G, Han Yand He Q-Y clusterProfiler: an R package for comparing biological themes among gene clusters. 2012 OMICS 16 284-7
[18]. Weller M, et al Glioma. 2015 Nat Rev Dis Primers 1 15017
[19]. Louis DN, et al The 2016 World Health Organization Classification of Tumors of the Central Nervous System: a summary. 2016 Acta Neuropathol 131 803-20
[20]. Verhaak RGW, et al Integrated genomic analysis identifies clinically relevant subtypes of glioblastoma characterized by abnormalities in PDGFRA, IDH1, EGFR, and NF1. 2010 Cancer Cell 17
[21]. Lenting K, Verhaak R, Ter Laan M, Wesseling Pand Leenders W Glioma: experimental models and reality. 2017 Acta Neuropathol 133 263-82
[22]. Tan AC, Ashley DM, López GY, Malinzak M, Friedman HSand Khasraw M Management of glioblastoma: State of the art and future directions. 2020 CA Cancer J Clin 70 299-312
[23]. Gilbert MR, et al Dose-dense temozolomide for newly diagnosed glioblastoma: a randomized phase III clinical trial. 2013 J Clin Oncol 31 4085-91
[24]. Chinot OL, et al Bevacizumab plus radiotherapy-temozolomide for newly diagnosed glioblastoma. 2014 N Engl J Med 370 709-22
[25]. Gilbert MR, et al A randomized trial of bevacizumab for newly diagnosed glioblastoma. 2014 N Engl J Med 370 699-708
[26]. Wen PYand Reardon DA Neuro-oncology in 2015: Progress in glioma diagnosis, classification and treatment. 2016 Nat Rev Neurol 12 69-70
[27]. Stupp R, et al Effect of Tumor-Treating Fields Plus Maintenance Temozolomide vs Maintenance Temozolomide Alone on Survival in Patients With Glioblastoma: A Randomized Clinical Trial. 2017 JAMA 318 2306-16
[28]. Chen N, Alieva M, van der Most T, Klazen JAZ, Vollmann-Zwerenz A, Hau Pand Vrisekoop N Neutrophils Promote Glioblastoma Tumor Cell Migration after Biopsy. 2022 Cells 11
[29]. Xu M, Wang Y, Xia R, Wei Yand Wei X Role of the CCL2-CCR2 signalling axis in cancer: Mechanisms and therapeutic targeting. 2021 Cell Prolif 54 e13115
[30]. Knebel FH, Uno M, Galatro TF, Bellé LP, Oba-Shinjo SM, Marie SKNand Campa A Serum amyloid A1 is upregulated in human glioblastoma. 2017 J Neurooncol 132 383-91
[31]. Lin C-Y, et al Serum amyloid A1 in combination with integrin αVβ3 increases glioblastoma cells mobility and progression. 2018 Mol Oncol 12 756-71
[32]. Zhang H, et al SAA1 knockdown promotes the apoptosis of glioblastoma cells via downregulation of AKT signaling. 2021 J Cancer 12 2756-67
[33]. Cao K, Jiang X, Wang B, Ni Zand Chen Y SAA1 Expression as a Potential Prognostic Marker of the Tumor Microenvironment in Glioblastoma. 2022 Front Neurol 13 905561
[34]. Cui Gand Xiao Y Identification of SAA1 as a prognostic biomarker associated with immune infiltration in glioblastoma. 2022 Autoimmunity 55 418-27
[35]. Filippova N, Grimes JM, Leavenworth JW, Namkoong D, Yang X, King PH, Crowley M, Crossman DKand Nabors LB Targeting the TREM1-positive myeloid microenvironment in glioblastoma. 2022 Neurooncol Adv 4 vdac149
[36]. Jin X, et al Fc gamma receptor IIb in tumor-associated macrophages and dendritic cells drives poor prognosis of recurrent glioblastoma through immune-associated signaling pathways. 2022 Front Genet 13 1046008
[37]. Mao P, Wang T, Du C-W, Yu Xand Wang M-D CXCL5 promotes tumorigenesis and angiogenesis of glioblastoma via JAK-STAT/NF-κb signaling pathways. 2023 Mol Biol Rep
[38]. Ji H, Liu Z, Wang F, Sun H, Wang N, Liu Y, Hu Sand You C Novel macrophage-related gene prognostic index for glioblastoma associated with M2 macrophages and T cell dysfunction. 2022 Front Immunol 13 941556
[39]. Wu P, Guo Y, Xiao L, Yuan J, Tang C, Dong Jand Qian Z LILRB2-containing small extracellular vesicles from glioblastoma promote tumor progression by promoting the formation and expansion of myeloid-derived suppressor cells. 2023 Cancer Immunol Immunother 72 2179-93
[40]. Peng WX, Koirala Pand Mo YY LncRNA-mediated regulation of cell signaling in cancer. 2017 Oncogene 36 5661-7
[41]. Li Z, et al Glioblastoma Cell-Derived lncRNA-Containing Exosomes Induce Microglia to Produce Complement C5, Promoting Chemotherapy Resistance. 2021 Cancer Immunol Res 9 1383-99
[42]. Chen Q, et al Long Noncoding RNA NEAT1, Regulated by the EGFR Pathway, Contributes to Glioblastoma Progression Through the WNT/β-Catenin Pathway by Scaffolding EZH2. 2018 Clin Cancer Res 24 684-95
[43]. Banelli B, Forlani A, Allemanni G, Morabito A, Pistillo MPand Romani M MicroRNA in Glioblastoma: An Overview. 2017 Int J Genomics 2017 7639084
[44]. Yang L, Ma Y, Xin Y, Han R, Li Rand Hao X Role of the microRNA 181 family in glioma development. 2018 Mol Med Rep 17 322-9