


1. Introduction
Due to the severe population congestion and the unique conditions of underground spaces, most subway systems in Chinese metropolises are faced with numerous potential risks during operation. The occurrence of incidents (or even accidents) in subway systems has been increasing worldwide, posing a threat to the safety and security of subway operations. Nevertheless, subway travel offers significant advantages in terms of punctuality, efficiency, convenience, and affordability, making it the preferred mode of transportation for ordinary residents, especially in large cities where subway travel has a great advantage over driving or taking buses in dealing with congested road conditions. In order to prevent overcrowding of trains and platforms during peak hours, subway stations in China have installed queue barriers outside crowded stations. As a result, a certain percentage of station entrances are closed, forcing commuters to detour around the barriers to enter the station during peak hours. This leads to passengers spending more time entering the station and many passengers hobbling alone or taking detours to enter the station during peak hours. It has become a common phenomenon in the operation of subway stations in major Chinese cities such as Beijing, Shanghai, and Guangzhou (as shown in Figure 1). Furthermore, due to safety concerns and increasing complaints from commuters, the optimization effects of these measures are relatively unsatisfactory. The methods commonly used in Beijing, Shanghai, Guangzhou, and other places usually involve restricting the entry and exit of passengers in a similar manner, thereby alleviating the pressure of subway traffic. The aforementioned passenger restriction measures are designed by station staff based on their own experience. However, how to develop appropriate strategies and determine the optimal capacity of specific facilities for a given station based on passenger behavior, and what should be the appropriate capacity limit for specific facilities to avoid stampede incidents caused by overcrowding, as these are highly significant issues that require immediate attention and resolution. To tackle above-mentioned issues, this paper is based on the situation during the evening peak hours of Guangzhou Metro Line 3, considering both the layout of transfer stations and the mobility patterns of passengers during peak periods. The following key aspects are discussed: (1) fundamental network infrastructure for station layout; (2) alternative route selection for subway stations when facilities are insufficient. These preliminary efforts provide a framework for developing a method to alleviate congestion during peak hours in subway stations. This paper, based on the previous work, utilizes existing cases and data to model and develop a decision point selection model that effectively mitigates congestion during peak hours at subway stations. This method can be used to design passenger flow restriction plans for subway management personnel and transfer station staff during peak periods.
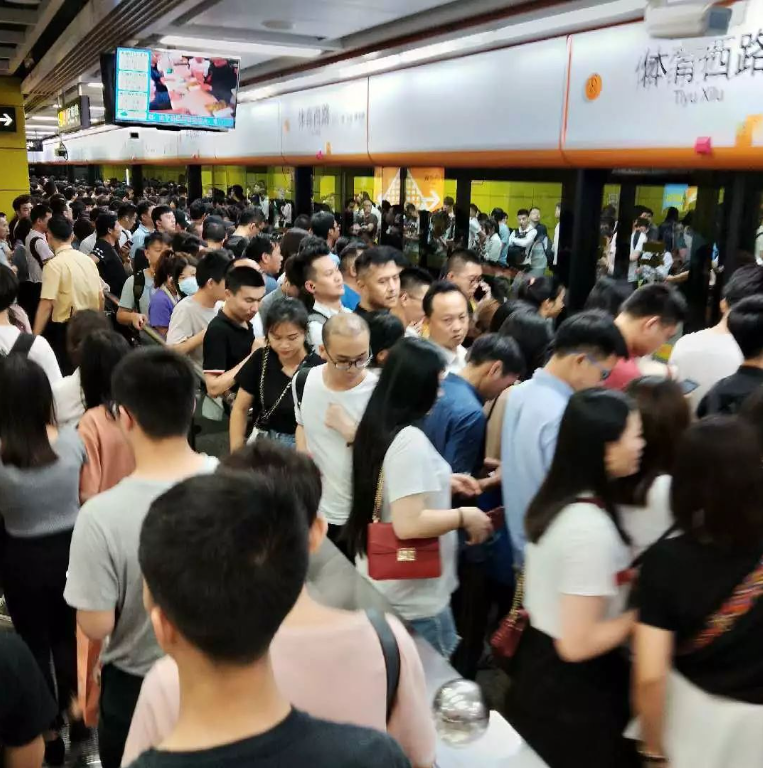

Figure 1. The overcrowding phenomenon of Line 3 of Guangzhou Metro (captured at Sports West Road Station in September 2022).
2. Relevant Academic Research
2.1. Research on hardware regulation
The current approach to solving peak-hour congestion typically involves changing the layout of subway stations to increase walking time and distance, aiming to alleviate peak-hour crowding. Since April 2011, Beijing Metro Company has implemented such restriction measures at seven stations. Some of these stations have installed outdoor queue barriers to extend passenger entry time and reduce passenger flow during peak hours. Similarly, Shanghai Metro Company has introduced measures to prevent passenger overcrowding, with these measures being implemented at over 30 stations since 2010. Furthermore, these actions were implemented by Guangzhou Metro Company in November 2011. Daamen et al. [1] addressed peak-hour congestion in subway systems by evenly distributing transferring passengers along different routes within the station. They considered walking time (including delay time before and on escalators) and walking distance, as well as the increased effort required for passengers to climb stairs, thus partially alleviating overcrowding. Li Yuheng [2] developed an optimal passenger flow distribution model based on passenger distribution characteristics, operational efficiency of subway stations, and fairness considerations, and validated the effectiveness of such model through simulation and modeling. Zong Huixi [3] focused on the empirical data and modeling of pedestrian route choice, studying the factors affecting route selection in subway stations, including network characteristics, route features, and pedestrian characteristics. This led to the formulation of a coordinated flow restriction strategy with multiple entrance gates and verification of its effectiveness.
2.2. Research on strategic optimization
Scholars have conducted research on modeling approaches, such as the developed pedestrian behavior intention model, which is used to evaluate the pedestrian flow aggregation in various facilities such as railways and subway stations. Generally, pedestrian movement modeling methods can be categorized into two main types: micro-level models and macro-level models. Micro-level studies primarily focus on individual behavior, considering factors that may interfere with pedestrians during their walking process. Regression analysis has been employed to investigate the relationship between unidirectional pedestrian speed and density. Prominent models in this field include the lattice gas cellular automaton model [4] and the social force model [5]. A crowd is perceived as a self-organizing system with cellular automata, composed of numerous individuals who follow certain rules, movements, and decisions within the station facility network, both in normal and emergency situations. The reliability of subway stations and the effectiveness of facility designs have been evaluated. Tong Yue [6] proposed a model for station space and passengers and used simulation tools to simulate passenger distribution on the platform. By constructing pedestrian dynamics models and crowd modeling systems, the design of subway stations in terms of passages, sidewalks, and stairs was evaluated at three levels. Then, the movement and distribution of matter in complex spaces were simulated, the behavior of passengers in the station during peak hours was discussed, and the direction and methods for optimizing the above-ground and underground spaces of subway stations were proposed. Xie Zhen [7] established a passenger delay model for station stairs and escalators based on queuing theory and formulated a passenger delay index formula. The relationship between pedestrian flow and facilities was obtained, and travel time functions based on different pedestrian facilities were calibrated. The route selection behavior of passengers inside the station was discussed, and the inversion of passenger travel itinerary and the reproduction of spatiotemporal travel trajectories were realized. Li Sirang et al. [8] studied the model of subway dwell time to to change the crowded situation of peak-hour passenger flow. The study conducted by Song et al. [9] aimed to investigate the effectiveness of adjusting subway ticket prices during peak hours to alleviate congestion. They utilized a regression analysis model to examine the response of different passenger types to price changes. The findings indicated that the impact of price adjustments on peak-hour travel behavior varied among different passenger groups. For long-distance commuters, altering peak-hour ticket prices did not significantly influence their choice to travel during those hours. This situation exists for passengers who frequently take the subway or do not own a vehicle. Conversely, this approach proved effective in reducing the intention of infrequent subway users and car owners to travel during peak hours, thus partially alleviating congestion. Additionally, the study revealed that implementing fare increases based on statistical pricing was more effective than adopting a flat-rate fare increase approach.
To summarize, there has been a considerable amount of research focused on addressing overcrowding during peak hours in subway systems. In this paper, the approach chosen to optimize congestion during the evening rush hour on Guangzhou Metro Line 3 involves modifying the network nodes within the subway stations and constructing a minimal utility function. Consequently, the proposed method aims to alleviate overcrowding by strategically managing passenger flow and optimizing the overall efficiency of the subway system during busy periods.
3. Methods
3.1. The basic situation of Line 3 of the Guangzhou Metro
The overview of Line 3 of the Guangzhou Metro: The Guangzhou Metro Line 3 roughly follows a north-south "Y" shape. The main line starts at Tianhe Coach Terminal and ends at Panyu Square, spanning through Tianhe District, Haizhu District, and Panyu District, connecting the central business district (CBD) - Zhujiang New Town and large residential areas. It has a total length of 32.9 kilometers. The northern extension of Guangzhou Metro Line 3 runs from Airport South Station to Tiyu West Station, covering a distance of 32.2 kilometers. It passes through 13 metro stations, linking the three major urban areas of Tianhe District, Baiyun District, and Huadu District. It primarily serves as a connection between commercial and office areas and residential neighborhoods. It is the busiest and most crowded metro line in Guangzhou and even across China. The distribution of the line is illustrated in Figure 2.
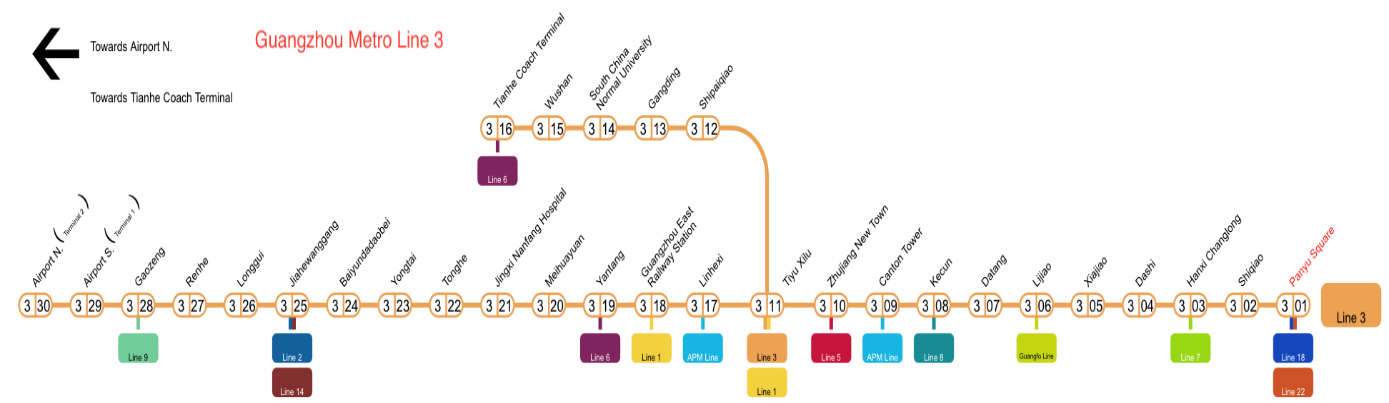
Figure 2. Distribution of Guangzhou Metro Line 3.
Select the actual data of Guangzhou Metro Line 3 in 202 as the analysis and research object. As shown in Table 1, the average daily passenger flow of Line 3 in 2021 can reach 1.0567 million person-trips, which is an increase of about 15% compared to the passenger flow data in 2020. After the Spring Festival, the weekly network passenger flow increased on average by 8.8%, with several days in a month exceeding 2 million person-trips.
Table 1. The daily average passenger traffic changes of various metro lines in Guangzhou in 2021 (unit: Ten Thousand Person-Times).
Line | Average daily passenger flow in 2021 | Average daily passenger flow in 2020 | Increase compared to 2020 |
Line 1 | 75.9 | 66.54 | 14.07% |
Line 2 | 101.91 | 92.98 | 9.6% |
Line 3 | 105.67 | 91.92 | 14.96% |
Line 3 North | 68.9 | 61.46 | 12.11% |
Line 4 | 38.48 | 31.81 | 20.97% |
Line 5 | 96.02 | 85.76 | 11.96% |
Line 6 | 73.62 | 63.94 | 15.14% |
Line 7 | 21.75 | 17.43 | 24.78% |
Line 8 | 75.75 | 52.29 | 44.87% |
Line 9 | 9.92 | 8.56 | 15.89% |
Line 10 | 11.2 | 9.66 | 15.94% |
Line 14 | 19.65 | 15.93 | 23.35% |
Line 18 | 7.56 | —— | —— |
Line 21 | 23.91 | 17.57 | 36.08% |
APM Line | 3.72 | 3.02 | 23.18% |
Guangfo Line | 48.08 | 40.29 | 19.33% |
Total | 776.45 | 659.16 | 17.79% |
Data source: Guangzhou Metro app.
3.2. Detailed approach
3.2.1. Path selection function. When passengers traverse facilities, the choice cost of the facilities is represented as utility. The utility function can be estimated by considering walking time, waiting time, and overlap coefficients on different types of facilities. Due to the constraints imposed by the dimensions of neighboring facility nodes, congestion is apt to arise as a result of the restricted availability of routes and route capacity. Therefore, the AFC entry point is considered a decision point along with nodes such as corridors (halls), escalators (stairs), and halls (corridors). For points, the width at the connection is adjusted to reduce capacity and decrease the number of passengers entering the facility, thus reducing congestion. Path selection is considered a dynamic process involving several concepts related to this method. First, the mathematical definitions of these concepts are as follows:
The set of facilities denoted as \( {S_{k}}= \lbrace {N_{k}},{E_{k}}\rbrace \) represents the available options within the 𝑘-route selection phase at the station. The set of nodes denoted as \( {N_{k}}∈N \) represents the selectable nodes in the next phase. The set of edges denoted as \( {E_{k}}∈E \) represents the selectable edges in the subsequent phase.
Definition 1: The utility function for selecting node variable \( {A_{k}}(i, j, {t_{j}}) \) is to select the utility function for node 𝑗 at that node. 𝑡𝑗 represents the passenger waiting time caused by congestion on the nodes preceding node 𝑗. It can be assumed to be:
\( {A_{k}}=μ\sum {D_{i, {t_{j}}}}\ \ \ (1) \)
Where \( {D_{i, { t_{j}}}} \) represents the time spent selecting node j at node i; \( μ \) is the correction coefficient.
However, passengers in the opposite direction may lead to a decrease in facility capacity, and bidirectional facilities have an impact on track selection. Therefore, this paper considers transfer passages and stairs as conflicting nodes.
Definition 2: The conflict point 𝑐𝑝 is the bidirectional facilities within the subway station, in that pedestrians walking on the facilities during peak hours will experience interference from each other. There are numerous conflict nodes in the transfer station hall, concourse, and platforms. In other words, it can be stated that if the passage or staircase is bidirectional, the conflict point is considered as 1; otherwise, it is considered as 0.
Definition 3: The control coefficient is evaluated as a function when the cumulative passenger volume reaches the maximum facility capacity. Measures should be taken to reduce the rate of passenger influx when the passenger density within the facility exceeds the capacity threshold. Accordingly, the coefficient 𝑗 for controlling passenger capacity on the track is defined as:
\( {C_{j}}=\begin{cases} \begin{array}{c} 0, {p_{j}}≤{p_{\acute{c}}} \\ 1, {p_{j}}≤{p_{\dot{c}}} \end{array} \end{cases}\ \ \ (2) \)
Obviously, when \( {C_{j}}=1 \) , The utility function above (1) will increase.
The walking time within the station's walking facilities is related to the density of passenger flow. In other words, congestion is often considered an important factor in pedestrians' route choices. Passengers tend to choose paths with lower pedestrian density. The travel time function based on the walking facilities can be described using the BPR function as follows:
\( t(V)={t_{0}}+B×{(\frac{V}{C})^{n}}\ \ \ (3) \)
In this context, C represents the capacity of pedestrian facilities (unit: ped /m/min); V denotes pedestrian flow or density (unit: peds/m2); 𝑡(V) indicates the travel time during passenger movement (unit: s), 𝑡0 represents the free-flow travel time (unit: s); B and 𝑛 are parameters to be estimated. Through on-site surveys, relevant travel times and pedestrian flows were obtained. The results for different facilities were converted into velocity/flow rate relationships to calibrate the travel time function for each pedestrian facility. Six subway stations on Line 3 of the Guangzhou Metro were selected for the calibration of parameters B and 𝑛. Data on pedestrian facility capacities were obtained for various types of facilities through network data during two working months and listed in Table 2.
Table 2. Travel time function for pedestrian facilities.
pedestrian facilities | sample size | determining factor | facility capacity (ped /m/min) | walking speed (m/min) | R2 | |
B | n | |||||
escalator (lifting) | 548 | 0.2502 | 1.1732 | 120 | 54.01 | 0.7642 |
stairs (ascending) | 698 | 1.1405 | 2.9158 | 70 | 51.36 | 0.8057 |
stairs (descending) | 662 | 14.24 | 1.742 | 80 | 58.28 | 0.7874 |
corridor | 718 | 26.5277 | 0.5985 | 92 | 83.02 | 0.7676 |
Definition 4: The utility function for the walking efficiency of selected facility \( {W_{k}}({n_{i}}, {n_{j}}, {e_{{k_{m}}}}) \) is the utility function from node to facility \( {e_{{k_{m}}}} \) chosen by 𝑗. In subway stations, the route length or walking time plays a significant role in the route selection process. Therefore, Equation (3) is used to depict the walking utility function. During peak hours, the utility value of walking function is a dynamic variable determined by facility capacity, passenger density, speed, and conflict points. Hence, the facility walking utility function can be represented as;
\( {W_{k}}({n_{i}}, {n_{j}}, {e_{{k_{m}}}})=α∙{t_{k}}({n_{i}},{n_{j}},{e_{{k_{m}}}})+θ{c_{p}}+δ{C_{{e_{{k_{m}}}}}}\ \ \ (4) \)
According to the research conducted by Zhao Min [10], the estimated maximum value is denoted as \( θ=10,δ=1000 \) . Therefore, the following equation applies:
\( {W_{k}}({n_{i}}, {n_{j}},{e_{{k_{m}}}})=α∙{t_{k}}({n_{i}}, {n_{j}}, {e_{{k_{m}}}})+10{c_{p}}+1000{C_{{e_{{k_{m}}}}}}\ \ \ (5) \)
Based on the data from Guangzhou Metro Line 3, a polynomial path-size logit model is used to propose a utility function that considers walking time, route overlap factors, and sthe impact of horizontal changes in the route. Therefore, the utility function to be estimated includes walking time and overlap coefficients on different types of infrastructure, as follows:
\( {U_{r}}=-0.130T_{r}^{l}-0.242T_{r}^{st}-0.167T_{r}^{esc}-0.1787T_{r}^{ramp}+3.181P{S_{r}}\ \ \ (6) \)
Among them, \( {U_{r}} \) is the utility function of router r; \( T_{r}^{l} \) is the walking time for passengers on route r at the infrastructure level; \( T_{r}^{st} \) is the walking time of passengers on route r on the stairs; \( T_{r}^{esc} \) is the walking time of passengers on route r on the escalator; \( T_{r}^{ramp} \) is the walking time of passengers on route r on the glide path; \( P{S_{r}} \) is the path size of route r.
Meanwhile, the utility function of route 𝑅𝑘 is represented as:
\( {U_{{R_{k}}}}(O,D,{R_{k}})=\sum _{i=1}^{{N_{k}}}{A_{k}}(i,j)+\sum _{{e_{{k_{m}}}}=1}^{{E_{k}}}{W_{k}}({n_{i}},{n_{j}},{e_{{k_{m}}}})\ \ \ (7) \)
Within them, O=1, D=Nk, thus, it can be concluded,
\( {U_{{R_{k}}}}(O,D,{R_{k}})=\sum _{i=1}^{{N_{k}}}{A_{k}}(i,j)-\sum _{{k_{m}}∈E}( \begin{array}{c} 0.130T_{{k_{m}}}^{l}+0.242T_{{k_{m}}}^{st}+0.167T_{{k_{m}}}^{esc}+0.1787T_{{k_{m}}}^{ramp} \\ -3.181P{S_{{k_{m}}}}-10{c_{p}}-1000{C_{{e_{{k_{m}}}}}} \end{array} )\ \ \ (8) \)
Furthermore, due to the excessive crowding on platforms, serious accidents such as passenger stampedes or falls onto the tracks may occur. Therefore, in order to reduce pedestrian density on platforms, the capacity of facilities is restricted, resulting in longer walking times inside the station. As a result, subway staff will choose routes with the largest pathway dimensions to minimize the flow of passengers arriving at the platform during peak hours.
The formula for determining limiting factors is as follows:
\( Z=minimise\sum _{k=1}^{n}{U_{{R_{k}}}}(O,D,{R_{k}})\ \ \ (9) \)
In other words, when passenger flow becomes too crowded, it becomes imperative to close or reduce the usage of routes with the minimum utility function in order to increase the utility or waiting time of the routes, thereby reducing passenger density on platforms. Hence, it is essential to select restricted routes based on the utility function and subsequently determine decision points, which involve designating facilities and adjusting capacity.
3.2.2. The method for determining decision points. First of all, the following concepts are defined: 1. sep represents a sequential set of stations where the passenger traffic volume is prone to exceed the capacity threshold; 2. ses represents a group set composed of elements sep; 3. seq represents the set of decision nodes.
There are several passenger flow lines in the transit station, such as input lines, output lines, and transfer lines. Due to changes in station passenger flow, the decision points of the aforementioned routes need to be modified. In other words, alternative routes are determined based on the given passenger volumes of different types (such as entering passengers, exiting passengers, and transferring passengers). Then, passengers are allocated to the initial restricted routes. The passenger volumes of each facility are evaluated, and if the passenger volume exceeds the capacity threshold of the facility, the utility of decision points should be increased or additional decision points should be added based on the passenger volume. The specific steps for determining the decision points are shown in Figure 3:
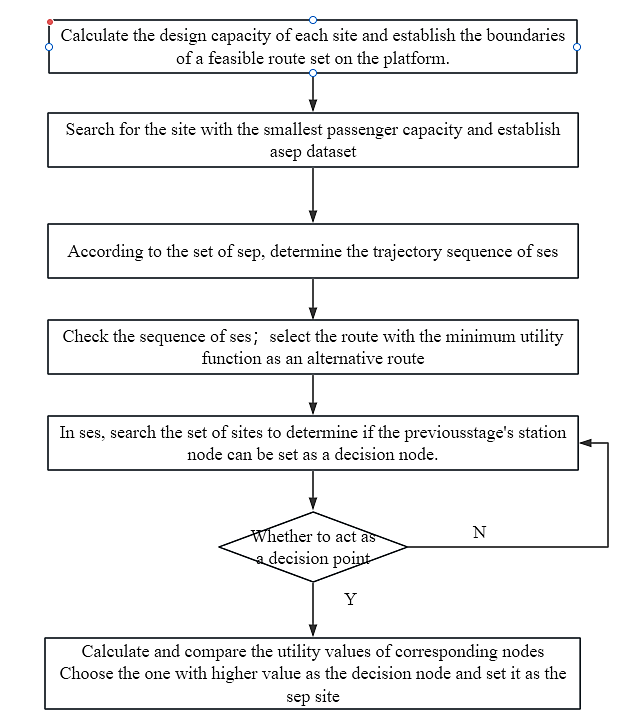
Figure 3. Process diagram of determining decision nodes.
As shown in Figure 3, the general steps are as follows:
1. Calculate the design capacity of each site and establish the feasible route set boundary for the platform. Search for the site with the minimum passenger capacity and establish the sep data set.
2. Determine the trajectory sequence of ses based on the sep set.
3. Check the trajectory sequence of ses; select the route with the minimum utility function as the alternative route. If the corresponding node in sep can be set as a decision node, proceed to step 5; otherwise, proceed to step 4.
4. Search for a collection of stations in ses, determine if the station nodes from the previous stage can be set as decision nodes; proceed to step 5; otherwise, repeat step 4.
5. If there are any connectivity issues between the access nodes, the decision node on that particular route should be eliminated. If one decision node is the inbound route decision node and the other decision node is the transfer route decision node, then passenger volume restrictions will be implemented on the inbound route. If both decision nodes are on the transmission route, calculate and compare the utility values of the corresponding nodes \( {U_{{R_{k}}}}(O,D,{R_{k}}) \) . Choose the higher one as the decision node and set it as the sep station.
Therefore, by setting the decision point before the station with the smallest capacity in the minimum utility function route, passengers will spend more time entering the station. If the capacity of each decision point is adjusted appropriately, it can ensure that the number of passengers does not exceed the platform capacity during peak hours.
4. Case Study
4.1. Data definition
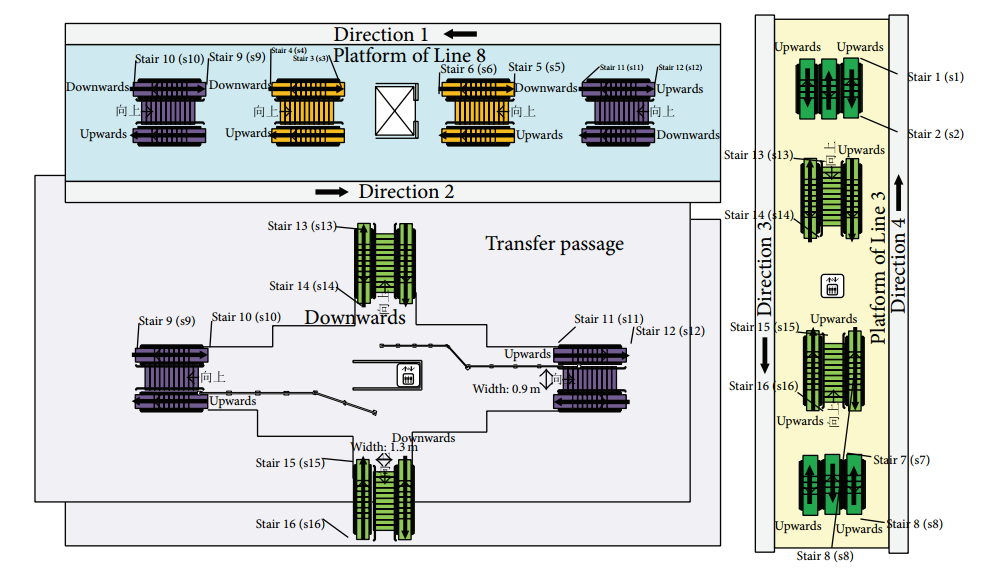
Figure 4. Transfer Structure Diagram of Kecun Station.
In Figure 4, Stair (1-16)represents the escalators for going up and down in the subway station; Platform of line 3 and 8 respectively represent the line assignments for Kecun Station on Line 3 and Line 8; Direction 1 and 2 respectively represent the directions of the up and down trains of Line 8 subway; Direction 3 and 4 represent the operating directions of Line 3 of the subway.
Taking the example of Kecun Station on Metro Line 3, the layout and dimensions of the station are illustrated in Figure 4. There are four routes from the entrance to the platform for Line 3 and two routes for Line 8. The facility parameters are shown in Table 3, with the effective platform area of Line 3 and Line 8 being 568.8 m2 and 635.6 m2 respectively. The rated passenger capacity of the train is 1860 people per train, and it operates at a frequency of 3 minutes during peak hours. There is an influx of passengers entering the station every 15 minutes. As a result, the entrance flow density will be calculated and recorded in Table 3. The flow velocity and travel time are calculated using Equation (3).
Table 3. Passenger flow at the station.
Time Interval | Effective Area (m2) | 17:15-17:30 | 17:30-17:45 | 17:45-18:00 | 18:00-18:15 | 18:15-18:30 | 18:30-18:45 | 18:45-19:00 | 19:00-19:15 |
Line 3 | 535.6 | 468 | 566 | 588 | 518 | 425 | 361 | 451 | 467 |
Line 8 | 468.8 | 417 | 773 | 1148 | 1007 | 907 | 756 | 706 | 689 |
Data source: Guangzhou Metro app.
Table 4. Average inbound passenger flow density at the subway station during peak hours after work (m2/peds).
Time Interval | 17:15-17:30 | 17:30-17:45 | 17:45-18:00 | 18:00-18:15 | 18:15-18:30 | 18:30-18:45 | 18:45-19:00 | 19:00-19:15 |
Line 3 | 0.64 | 0.93 | 1.48 | 1.62 | 1.51 | 1.43 | 1.29 | 0.97 |
Line 8 | 0.819 | 1.168 | 1.82 | 2.37 | 2.47 | 2.60 | 2.30 | 1.61 |
According to literature [11], it has been found that the critical density threshold for platforms is 0.5 m2/peds. During the evening rush hour, there is congestion at the Kecun station on Lines 3 and 8. Therefore, restrictions should be placed on the inflow of passengers at this station.
Due to the key role of escalators, stairs, and passageways in affecting passenger capacity at subway stations, passengers on the platform are more crowded than those in the passageways. Because of excessive congestion during the evening rush hour, passengers are forced to stop. The waiting times for different time intervals during peak hours are shown in Table 5.
Table 5. Waiting time during different time periods of the evening rush hour.
Time Interval | 17:15-17:30 | 17:30-17:45 | 17:45-18:00 | 18:00-18:15 | 18:15-18:30 | 18:30-18:45 | 18:45-19:00 | 19:00-19:15 |
esc1,esc8(𝐷) | 20 | 22 | 22 | 22 | 22 | 22 | 22 | 14 |
esc3,esc5(𝐷) | 19 | 22 | 23 | 23 | 23 | 22 | 22 | 15 |
In Table 5, “esc1, esc8(𝐷)” represents the waiting time at nodes esc1, esc8 (starting point of Line 3 escalator) From node esc1 downwards to node esc2. “esc3, esc5(𝐷)” respectively represents the waiting time at nodes esc3, esc5 (starting point of Line 8 escalator) from node esc3 downwards to node esc5 and from esc5 downwards to node esc6 .
4.2. Discussion of results
Due to the relatively crowded passenger flow entering the platform of Line 3, this process first calculates the travel time under different passenger densities using (3), and selects the route with the minimum utility function. According to formulas (1), (8), and (9), the utility function for the time interval 17:45-18:45 can be calculated as shown in Table 6. Therefore, the route with the minimum utility function is 𝑒4→esc5→esc6→𝑃8; After selecting the route, restrictions will be implemented on nodes 𝑒4 and esc5 within the time interval of 17:45-18:45. The utility function of the escalators (esc5-esc6) is minimized, as indicated by formula (8). Therefore, the decision point is set before the automatic escalators. The automatic escalators (esc5 - esc6) will be disabled to increase the utility value of the entrance-to-platform route. If the automatic escalators are disabled, passengers may choose another escalator instead of the stairs to access the platform. The waiting time before the automatic escalators will double, leading to a slight decrease in passenger capacity. Furthermore, all the automatic escalators are closed, and passengers will have to choose the stairs, resulting in further increases in waiting time. The passenger flow on the platform will be further reduced. During the time period from 17:00 to 19:15, the estimated passenger flow remains below 800, thereby reducing peak-hour congestion on the line.
Table 6. Route utility function table.
Route | Waiting time(s) | Walking time(s) | Utility function |
𝑒3→esc3→esc4→𝑃8 | 23 | 113.97 | 135.97 |
𝑒3→esc5→esc6→𝑃8 | 104.69 | 127.69 | |
𝑒4→esc3→esc4→𝑃8 | 116.08 | 138.08 | |
𝑒4→esc5→esc6→𝑃8 | 23 | 65.26 | 88.26 |
𝑒3→𝑠3→𝑠4→𝑃8 | 110.45 | 145.23 | |
𝑒3→𝑠5→𝑠6→𝑃8 | 112.34 | 148.28 | |
𝑒4→𝑠3→𝑠4→𝑃8 | 109.36 | 140.90 | |
𝑒4→𝑠5→𝑠6→𝑃8 | 110.23 | 142.59 |
Date source: Guangzhou Metro app.
5. Conclusion
This paper focuses on the optimization of crowded subway during peak hours and proposes an optimal solution model along with a route selection model that uses the minimization of values as the objective function. Firstly, the characteristics and general patterns of passenger flow during peak hours are explained from the perspective of walking time. Then, the mechanism and principles of pedestrian route selection at transfer stations are analyzed. Based on the requirements of peak hour control, an abstract structure of pedestrian flow at stations is established. Considering the characteristics of peak hour passenger flow, this article proposes model assumptions. Based on these assumptions, a passenger route control model during peak hours is established, and the objective function for passenger route selection control is determined. The factors influencing passenger route selection at transfer stations are studied. Subsequently, based on the structure and layout of transfer stations, a facility network for transfer stations is established, taking into account bottleneck identification and peak passenger flow. Finally, a route planning model for passenger transportation during peak hours is established. According to the research results, by establishing models for passenger congestion and facility flow distribution, it is possible to optimize the layout of subway stations and reduce the degree of congestion, thus providing new insights for solving the current issue of subway congestion during peak hours. This helps alleviate passenger dissatisfaction and enhances their willingness to choose subway travel.
References
[1]. W. Daamen, S. P. Hoogendoorn. Level difference impacts in passenger route choice modelling[J]. in Proceedings of the TRAIL Conference Proceedings,2004(11):103–127.
[2]. Li, Yuheng. Research on Network Coordinated Control of Metro Passenger Flow during Peak Hours— A Case Study of Guangzhou Metro[D]. South China University of Technology, 2021.
[3]. Zong Huixi. Research on the Model and Algorithm of Coordinated Flow Restriction for Multiple Entrance Stations during the Peak Period of Subway[D]. Beijing Jiaotong University, 2020.
[4]. X. Guo, J. Chen, S. You, J. Wei. Modeling of pedestrian evacuation under fire emergency based on an extended heterogeneous lattice gas model[J]. Physica A: Statistical Mechanics and its Applications,2013,392(9):1994–2006.
[5]. H. Cheng, X. Yang. Emergency evacuation capacity of subway stations[J]. Procedia—Social and Behavioral Sciences, 2012(43):339–348.
[6]. Tong Yue. Research on the spatial effect of station area in Hefei rail transit— A case study of Hefei Metro Line 1 and Line 2 [D]. Hefei University of Technology, 2018.
[7]. Xie Zhen. Research on Passenger Trip Inversion Method of Urban Rail Transit During Peak Period Based on AFC Data [D]. Beijing Jiaotong University, 2021.
[8]. Li Si rang, Luo Xuyang, and Fu Rao. Analysis of the optimal stopping time during peak hours of Beijing subway— taking Huixinxi Street South Station on Line 10 as an example [J]. Famous Teacher Online, 2016 (08): 11-13.
[9]. Song Jiaxuan,Zhang Ning. Can the price increase during peak hours of Beijing subway solve the congestion problem[J]. Integrated Transport, 2014.
[10]. Zhao Min. Research on Methods and Simulation of Passenger Flow Control at Urban Rail Transit Transfer Stations [D]. Southwest Jiaotong University, 2020.
[11]. Y. Bi and S. Jiang. On the indicator system of rail transit station platform space service[J]. Urban Rail Transit Research, 2013(10):7–10.
Cite this article
Luo,Z. (2023). The optimization method for alleviating the congestion during peak hours of Guangzhou metro line 3 is based on thorough research and analysis. Theoretical and Natural Science,9,226-237.
Data availability
The datasets used and/or analyzed during the current study will be available from the authors upon reasonable request.
Disclaimer/Publisher's Note
The statements, opinions and data contained in all publications are solely those of the individual author(s) and contributor(s) and not of EWA Publishing and/or the editor(s). EWA Publishing and/or the editor(s) disclaim responsibility for any injury to people or property resulting from any ideas, methods, instructions or products referred to in the content.
About volume
Volume title: Proceedings of the 3rd International Conference on Computing Innovation and Applied Physics
© 2024 by the author(s). Licensee EWA Publishing, Oxford, UK. This article is an open access article distributed under the terms and
conditions of the Creative Commons Attribution (CC BY) license. Authors who
publish this series agree to the following terms:
1. Authors retain copyright and grant the series right of first publication with the work simultaneously licensed under a Creative Commons
Attribution License that allows others to share the work with an acknowledgment of the work's authorship and initial publication in this
series.
2. Authors are able to enter into separate, additional contractual arrangements for the non-exclusive distribution of the series's published
version of the work (e.g., post it to an institutional repository or publish it in a book), with an acknowledgment of its initial
publication in this series.
3. Authors are permitted and encouraged to post their work online (e.g., in institutional repositories or on their website) prior to and
during the submission process, as it can lead to productive exchanges, as well as earlier and greater citation of published work (See
Open access policy for details).
References
[1]. W. Daamen, S. P. Hoogendoorn. Level difference impacts in passenger route choice modelling[J]. in Proceedings of the TRAIL Conference Proceedings,2004(11):103–127.
[2]. Li, Yuheng. Research on Network Coordinated Control of Metro Passenger Flow during Peak Hours— A Case Study of Guangzhou Metro[D]. South China University of Technology, 2021.
[3]. Zong Huixi. Research on the Model and Algorithm of Coordinated Flow Restriction for Multiple Entrance Stations during the Peak Period of Subway[D]. Beijing Jiaotong University, 2020.
[4]. X. Guo, J. Chen, S. You, J. Wei. Modeling of pedestrian evacuation under fire emergency based on an extended heterogeneous lattice gas model[J]. Physica A: Statistical Mechanics and its Applications,2013,392(9):1994–2006.
[5]. H. Cheng, X. Yang. Emergency evacuation capacity of subway stations[J]. Procedia—Social and Behavioral Sciences, 2012(43):339–348.
[6]. Tong Yue. Research on the spatial effect of station area in Hefei rail transit— A case study of Hefei Metro Line 1 and Line 2 [D]. Hefei University of Technology, 2018.
[7]. Xie Zhen. Research on Passenger Trip Inversion Method of Urban Rail Transit During Peak Period Based on AFC Data [D]. Beijing Jiaotong University, 2021.
[8]. Li Si rang, Luo Xuyang, and Fu Rao. Analysis of the optimal stopping time during peak hours of Beijing subway— taking Huixinxi Street South Station on Line 10 as an example [J]. Famous Teacher Online, 2016 (08): 11-13.
[9]. Song Jiaxuan,Zhang Ning. Can the price increase during peak hours of Beijing subway solve the congestion problem[J]. Integrated Transport, 2014.
[10]. Zhao Min. Research on Methods and Simulation of Passenger Flow Control at Urban Rail Transit Transfer Stations [D]. Southwest Jiaotong University, 2020.
[11]. Y. Bi and S. Jiang. On the indicator system of rail transit station platform space service[J]. Urban Rail Transit Research, 2013(10):7–10.