


1. Introduction
An electric vehicle (EV) is a motor vehicle powered entirely or primarily by electric energy. It can be self-powered by a battery or powered by a collector system that draws power from outside the vehicle. Connected, Autonomous, Shared, and Electric (CASE) Mobility is a vision for the future of transportation that includes EVs and other upcoming automotive technologies like autonomous driving, linked cars, and shared mobility on the road [1]. EVs are distinct from their internal combustion engine counterparts [2]. Their energy may be produced from various resources, including fossil energy, nuclear power, renewables like wind and solar energy, or a mix of these. Electric cars' carbon footprint and other pollutants will be different depending on the energy and technology used. Internal combustion engine vehicles typically only use one or a small number of energy sources, with most of that energy coming from fossil energy that is quickly depleting [3]. However, in vehicle design, it is still a top priority to continuously find ways to further reduce vehicle energy consumption through aerodynamics [4]. This paper aims to reduce the drag of EVs through design optimization, so as to improve the efficiency of their operation.
In automotive engineering, the drag coefficient quantifies a car's ability to move through the air. Therefore, automakers consider vehicle drag coefficient and other performance factors throughout the design process [5]. The impact of drag on the vehicle, including its forward speed, acceleration, stability and energy consumption, can be reduced by reducing the drag coefficient. This paper investigates the relationship between drag coefficient and front windshield angle in the context of automotive engineering, and analyzes the application and impact of drag coefficient in automotive design. In addition, since the development and testing of vehicles can currently be accomplished with the help of modeling techniques and fluid dynamics, this paper uses both NURBS modeling techniques and ANSYS CFD-Post to predict computational fluid dynamics (CFD) in vehicle design.
2. The drag coefficient
2.1. Drag coefficient in automobiles
In automobile engineering, the drag coefficient is a standard metric. Its drag coefficient quantifies how well a car moves through the air. At more incredible speeds, aerodynamic drag becomes more relevant since its importance is proportional to the square of the velocity. An automobile's speed and energy economy may benefit from a decrease in the drag coefficient. As the following equation states, the drag coefficient (sometimes abbreviated \( {c_{d}} \) ) is a dimensionless variable used to measure the drag or resistance an item encounters in a fluid environment (Equation 1).
\( {c_{d}}=\frac{2{F_{d}}}{{pu^{2}}A}\ \ \ \) (1)
2.2. Front wind shield angle
Windshields serve as aerodynamically constructed front glass, protecting passengers from wind and flying debris, including dust, insects, and pebbles [6]. There is often a downward slope to the windscreen up front. It improves the vehicle's efficiency and enables the windscreens to go close to high speeds. Several cars have different windscreen tilt angles. According to the studies, a vehicle's drag coefficient may be affected by the angle of the windscreen up front. According to research, the drag coefficient decreases linearly with hood inclination. Therefore, keeping the front windscreen angle below 45 degrees is optimal [7]. The drag coefficient may decrease by 8.88% if, among other things, an automobile's surface roughness and windscreen angles are optimised, as suggested by the study. Changing a vehicle's aerodynamics may improve its performance, but there is a risk that it could experience excessive lift. According to a CFD study, the Cd is not significantly affected by enlarging the area between the windshield and the engine hood. Figure 1 shows the between relationship between windshield angle and Cd envision the effect of varying windshield angle on the drag coefficient.
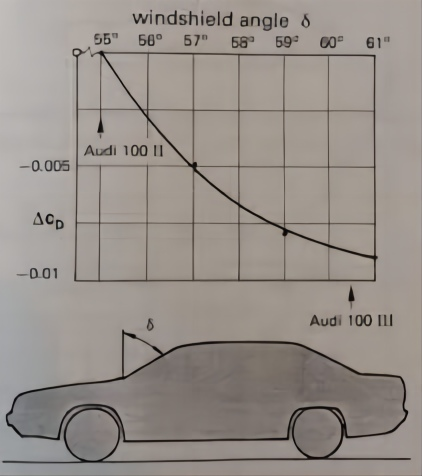
Figure 1. Relationship between windshield angle & Cd.
2.3. Optimum front angle for front wind shield fourth level heading
The research found that the best angle for the front windscreen to reduce the drag coefficient was less than 45 degrees. The study also indicates a linear relationship between the tilt of the bonnet and the drag coefficient (Cd). The windshield's slant angle may affect the drag coefficient, according to another research that investigated the effects of various slant angles on the front windscreen [6]. Nevertheless, the analysis did not reveal what angle would result in the slightest drag. It's worth keeping in mind that things like road roughness and the car's overall aerodynamic design might affect the windscreen's grade to achieve the lowest possible drag coefficient. The drag coefficient measures the energy needed to overcome wind resistance when driving, and lowering it may increase the range of electric cars. Increased wind resistance from snow and ice on the car may reduce an EV's capacity by as much as 25 percent in severe weather conditions like winter [7]. Thus, better aerodynamics may further assist EVs by decreasing the wind resistance coefficient.
2.4. CFD analysis
A study determined that a front windscreen tilt of fewer than 45 degrees was optimal for minimizing the drag coefficient [7]. The data also shows that the drag coefficient increases linearly with increasing bonnet angle. According to another study examining the impact of different windscreen slant angles on the drag coefficient, the front windscreen's slant angle matters. Nevertheless, the research did not show which angle would provide the slightest drag [8]. When determining the optimal angle of the windshield to produce the lowest possible drag coefficient, factors such as road roughness and the car's overall aerodynamic design should be considered. It has been suggested that decreasing the drag coefficient, which measures the energy required to overcome wind resistance when driving, might enhance the range of EVs. In extreme weather, like winter, an EV's capacity may decrease by as much as 25 percent due to increased wind resistance from snow and ice on the car [9]. By reducing the wind resistance coefficient, improved aerodynamics may help EV go longer.
3. Simulation experimental
3.1. Research protocol
The simulation's objective is to quantify the aerodynamic drag exerted by the vehicle with the change in Windshield Angle. In automotive design, the designer's sole controllable factors are the frontal area and the drag coefficient (Cd). So, vehicles that may have less drag are designed to be more aerodynamic. Recent research by automakers to increase energy efficiency has shown the importance of the wind tunnel test. Therefore, the simulation experiment in this paper will also use the wind tunnel test as the research method of the experiment.
3.2. Wind tunnel testing
In the automobile industry, conducting tests in a wind tunnel is a crucial step in the design process (Figure 2). Wind tunnels may provide light on how air affects a test model as it passes over or around it, whether the item is fixed or moving. Wind tunnel tests are crucial in the automobile & aerospace industry since flight physics relies on the proper airflow to generate lift and lower drag (Table 1). Significant automakers use wind tunnels for routine analysis of their newest model as well as to assess the aerodynamics of specific components.
Table 1. Experimental relationship between front wind shield angle & drag coefficient (Cd).
Case | A(front windshield) | B(back windshield) | C(hood) | CD |
1 | 30 | 35 | 10 | 0.400 |
2 | 30 | 38 | 15 | 0.390 |
3 | 45 | 32 | 10 | 0.370 |
4 | 45 | 35 | 15 | 0.335 |
5 | 60 | 32 | 15 | 0.320 |
6 | 60 | 38 | 15 | 0.335 |
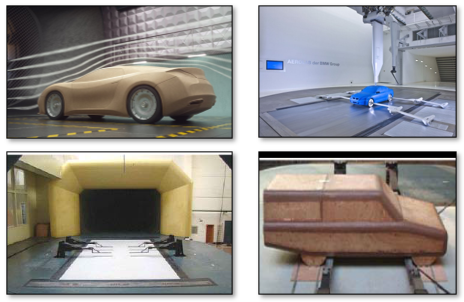
Figure 2. Experimental wind tunnel testing cars.
4. Simulation results
4.1. CFD analysis process
4.1.1. Pre-processing. An idealized and discretized model is created at this stage. Different modelling approaches need assumptions about the flow's physical properties (viscous, inviscid, compressible, steady, non-stationary). Mesh creation and starting and boundary conditions are two more steps [10].
4.1.2. Solving. The solver is responsible for the actual calculations. Hence plenty of processing power is needed during the solution phase.
4.1.3. Post-processing. This step involves the visualization and analysis of the collected findings. At this point, the analyst has enough information to double-check the data and make conclusions. Results may be presented in formats like still or animated images, graphs, or tables.
4.2. CAD modelling & simulation in ANSYS
When comparing the geometry of the automobile to the final result, as much information as possible should be included in every region. The vehicle's blueprints were imported into the programme, and NURBS (Non-uniform rational B-spline) modelling techniques were used to create the surfaces (Figure 3). In order to make use of the prediction, users must do post-processing that provides them with a comprehensive understanding of the outcomes of their simulations of liquid dynamics.
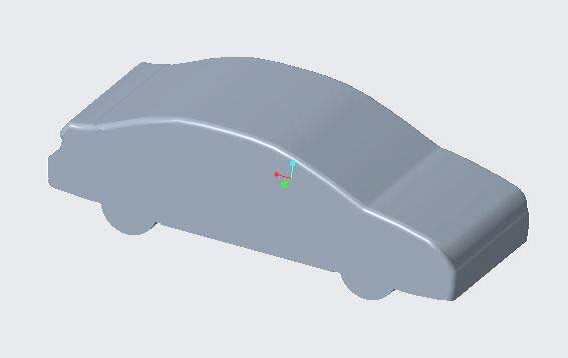
Figure 3. Generating 3D CAD Models of the Vehicle for CFD analysis.
4.2.1. Meshing. Meshing refers to creating a grid in two or three dimensions; in other words, it is discretizing a domain by breaking down complicated geometries into smaller pieces. Ansys Mesh is widely considered the industry standard when meshing intricate pieces in simulation and modelling processes. It is common for this step to take up the bulk of the time needed to get simulation results [11]. The sophisticated automated mesh-generating tools developed by ANSYS meshing make it possible to solve problems in CFD (fluid) and FEA Meshing in record time and with high precision (Figure 4).
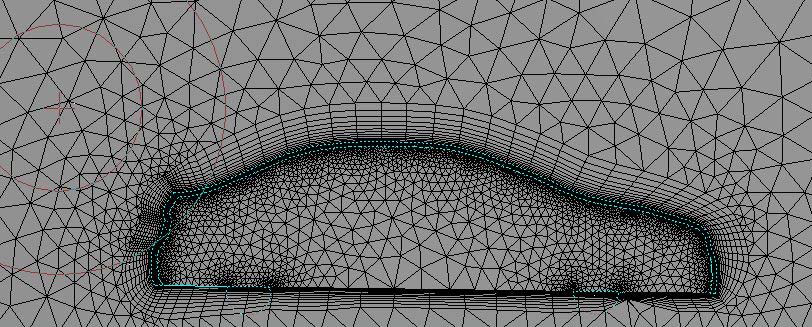
Figure 4. Mesh generation for discretization.
4.2.2. Solver & post processing. ANSYS CFD-Post constrains originality when producing striking visuals to depict the flow at any granularity [12]. The predicted airflow enhancement was shown, complete with path line contours that agreed with the solutions (Figure 5).
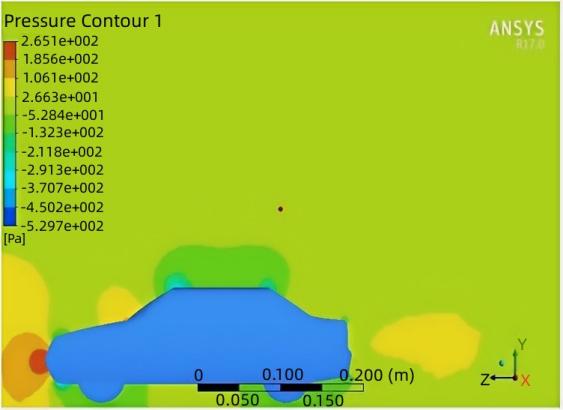
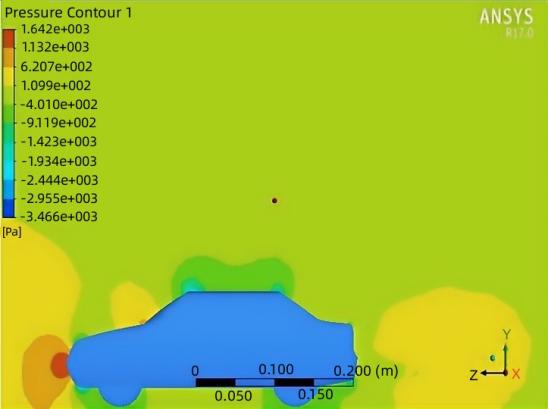
Figure 5. Drag coefficient (Cd) relationship with angle of front wind shield.
5. Coefficient of drag (Cd) and the change in angle of front wind shield
Before it reaches the windscreen, the airspeed is high on the hood. A separation area forms at its base as the flow slows down at the front shield. With a constant CD, the distance between the bottom of the windscreen and the roof expands when the angle of the windshield is less than 45 degrees (Figure 6). The separation area is more significant when the front windscreen angle is between 45 and 55 degrees, and as before, this area grows as the CD value increases (Figure 6). The lines of detachment and reattachment were quite broad apart when the angle of the windscreen at the front was higher than 55 degrees.
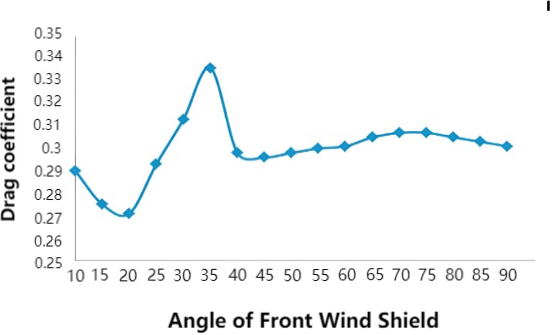
Figure 6. Drag coefficient (Cd) relationship with angle of front wind shield.
The angle of a vehicle's windscreen demonstrates its ability to reduce drag. Vehicle height is affected by the angle of the windshield. The windscreen's curvature should be adjusted to prevent the cross-wind effect. Using ANSYS Fluent, the impact of windscreen inclination on drag is examined first. At an input velocity of 25 m/s, a CFD study identifies the effect of vehicle height on the drag coefficient. The front hood of the vehicle's pressure contours is examined by adjusting the air's input velocity. The dimensions of a car's windscreen are derived from published publications and modelled using modelling software. The tilt of the bonnet should be adjusted to reduce drag. The planned angle of windscreen tilt does not impair driver vision. It should efficiently collect rainwater and dirt. The degree of inclination of the windscreen is chosen so as not to impact the vehicle's stability as its dimensions vary. The coefficient of drag is decreased by optimizing the frontal area (Figure 7). The front windscreen angle should be below 45 degrees for the slightest drag, and the coefficient of drag (CD) decreases linearly as the bonnet angle rises. The angle of the windscreen is determined by taking vision considerations into mind.
Figure 7. Drag coefficient (Cd) relationship.
Highest CD measured at the windscreen angle is 35 degrees. Minimum CD angle at the windscreen is 15°. Slight variations in CD were detected when the tilt of the front windscreen was less than 45 degrees. Assume the angle is bigger than 45° CD. CD lowers as the angle of the bonnet increases. The orthogonal experiment predicts aerodynamic drag accurately while conserving time and computational resources. With a front windscreen angle of 60 degrees, the windscreen angle is 32 degrees and the hood inclination angle is 15 degrees, according to the data. This windscreen angle configuration has a drag coefficient of 0.320. The drag coefficient for a saloon is 0.44. The redesigned aerodynamic design decreased the drag coefficient by 27%. This lowered drag force, resulting in reduced energy consumption. Stagnation near the front of the automobile leads to higher pressure, as shown in the pressure contour distribution. At an angle of 60 degrees, the front windscreen contributes significantly to the rise in pressure drag. Nevertheless, when comparing each model individually to the final model, the second model with a front spitter only improved by 1.17%, while the third model with a diffuser improved by 11.18%. Better stabilities and considering the safety data, particularly at high velocities, were made possible by reducing the lift coefficient to 73%.
6. CFD in automotive industry
Modern automotive development would be impossible without the use of CFD. CFD improves the design process for a single part or a whole vehicle. Buyers have been more interested in cars with enhanced steering, performance, and aesthetics for a while. The design of electric cars has evolved significantly in recent years. When put next to the generations before them. The automobile industry is huge for CFD's potential uses—everything from the car's sleek design to the inner workings of its complex engine. At the same time, they are developing parts and assemblies for the automobile sector. CFD simulation is used almost everywhere [13].
CFD may be used to examine any flow that affects a vehicle. CFD service providers that are experts in the field can harness the full power of CFD simulation to engineering the desired result. Using CFD simulation might be fruitful with the help of the specialist. In particular, for dealing with issues involving fluid motion. Moreover, these outward design shifts will be felt consistently in future automobiles. Engineers' wits have been bolstered by CFD applications in aerodynamics, allowing them to improve the vehicle design process. Wind tunnel testing is no longer necessary, thanks to CFD simulation analysis of a scale model of an automobile [14]. Able to control air pressure, temperature, humidity, and direction. CFD allows experts to examine the vehicle's aerodynamic response to environmental conditions.
7. Conclusion
In conclusion, initiatives to improve energy efficiency in the car industry are becoming more prevalent due to rising concerns about climate change. This research focused on improving the efficiency of EVs by decreasing aerodynamic drag and increasing lift through design optimization. The study found that the final design achieved a decrease in drag compared to the baseline model, resulting in improved overall performance. The numerical model was validated against experimental data, and the adjustments made in the study were confirmed to have reduced drag as predicted. The final design included all the changes tested, and Optimal Windshield Angle was used to determine the best proportions for increasing drag and lift. Overall, this research demonstrates the potential for design optimization to enhance the energy economy of EVs.
References
[1]. Hannan, M. A., Azidin, F. A., & Mohamed, A. (2014). Hybrid electric vehicles and their challenges: A review. Renewable and Sustainable Energy Reviews, 29, 135-150.
[2]. Hawkins, T. R., Gausen, O. M., & Strømman, A. H. (2012). Environmental impacts of hybrid and electric vehicles—a review. The International Journal of Life Cycle Assessment, 17, 997-1014.
[3]. Lopes, J. A. P., Soares, F. J., & Almeida, P. M. R. (2010). Integration of electric vehicles in the electric power system. Proceedings of the IEEE, 99(1), 168-183.
[4]. Barlow, J. B. Rae, W. H., & Pope, A. (2015) "Low speed wind tunnel testing," INCAS Bulletin, vol. 7, p. 133.
[5]. Karamallah, A. A., & Wahab, A. K. (2011). Experimental determination of drag coefficient on different automobiles geometry. Eng. & Tech. Journal, 29, 3043-3057.
[6]. Marcus, M. A., & Ignatovich, F. (2016). Windshield wedge angle and layer thickness measurements. Lumetrics Inc., Rochester.
[7]. Abdellah, E., & Wang, B. (2017, September). CFD analysis on effect of front windshield angle on aerodynamic drag. In IOP Conference Series: Materials Science and Engineering (Vol. 231, No. 1, p. 012173). IOP Publishing.
[8]. Gunpinar, E., Coskun, U. C., Ozsipahi, M., & Gunpinar, S. (2019). A generative design and drag coefficient prediction system for sedan car side silhouettes based on computational fluid dynamics. Computer-Aided Design, 111, 65-79.
[9]. Sharma, R. B., & Bansal, R. (2013). CFD simulation for flow over passenger car using tail plates for aerodynamic drag reduction. IOSR Journal of Mechanical and Civil Engineering (IOSR-JMCE), 7(5), 28-35.
[10]. Ali, Z., Tyacke, J., Watson, R., Tucker, P. G., & Shahpar, S. (2019). Efficient preprocessing of complex geometries for CFD simulations. International Journal of Computational Fluid Dynamics, 33(3), 98-114.
[11]. He, Y., Bayly, A. E., & Hassanpour, A. (2018). Coupling CFD-DEM with dynamic meshing: A new approach for fluid-structure interaction in particle-fluid flows. Powder Technology, 325, 620-631.
[12]. Zawawi, M. H., Saleha, A., Salwa, A., Hassan, N. H., Zahari, N. M., Ramli, M. Z., & Muda, Z. C. (2018, November). A review: Fundamentals of computational fluid dynamics (CFD). In AIP conference proceedings (Vol. 2030, No. 1). AIP Publishing.
[13]. BAYINDIRLI, C., & Çelik, M. (2020). The determination of effect of windshield ınclination angle on drag coefficient of a bus model by CFD method. International Journal of Automotive Engineering and Technologies, 9(3), 122-129.
[14]. Abhishek, G., Ramsankar, V., Sreesankaran, M., Sabareesh, G., & Jalaiah, N. (2016). Combined effects of vehicle body geometry and drag reduction techniques on drag coefficient. In 8th International Colloquium on Bluff Body Aerodynamics and Applications, Boston.
Cite this article
Gao,C. (2023). Effect of front windshield angle on drag coefficient of electric vehicles. Theoretical and Natural Science,12,101-107.
Data availability
The datasets used and/or analyzed during the current study will be available from the authors upon reasonable request.
Disclaimer/Publisher's Note
The statements, opinions and data contained in all publications are solely those of the individual author(s) and contributor(s) and not of EWA Publishing and/or the editor(s). EWA Publishing and/or the editor(s) disclaim responsibility for any injury to people or property resulting from any ideas, methods, instructions or products referred to in the content.
About volume
Volume title: Proceedings of the 2023 International Conference on Mathematical Physics and Computational Simulation
© 2024 by the author(s). Licensee EWA Publishing, Oxford, UK. This article is an open access article distributed under the terms and
conditions of the Creative Commons Attribution (CC BY) license. Authors who
publish this series agree to the following terms:
1. Authors retain copyright and grant the series right of first publication with the work simultaneously licensed under a Creative Commons
Attribution License that allows others to share the work with an acknowledgment of the work's authorship and initial publication in this
series.
2. Authors are able to enter into separate, additional contractual arrangements for the non-exclusive distribution of the series's published
version of the work (e.g., post it to an institutional repository or publish it in a book), with an acknowledgment of its initial
publication in this series.
3. Authors are permitted and encouraged to post their work online (e.g., in institutional repositories or on their website) prior to and
during the submission process, as it can lead to productive exchanges, as well as earlier and greater citation of published work (See
Open access policy for details).
References
[1]. Hannan, M. A., Azidin, F. A., & Mohamed, A. (2014). Hybrid electric vehicles and their challenges: A review. Renewable and Sustainable Energy Reviews, 29, 135-150.
[2]. Hawkins, T. R., Gausen, O. M., & Strømman, A. H. (2012). Environmental impacts of hybrid and electric vehicles—a review. The International Journal of Life Cycle Assessment, 17, 997-1014.
[3]. Lopes, J. A. P., Soares, F. J., & Almeida, P. M. R. (2010). Integration of electric vehicles in the electric power system. Proceedings of the IEEE, 99(1), 168-183.
[4]. Barlow, J. B. Rae, W. H., & Pope, A. (2015) "Low speed wind tunnel testing," INCAS Bulletin, vol. 7, p. 133.
[5]. Karamallah, A. A., & Wahab, A. K. (2011). Experimental determination of drag coefficient on different automobiles geometry. Eng. & Tech. Journal, 29, 3043-3057.
[6]. Marcus, M. A., & Ignatovich, F. (2016). Windshield wedge angle and layer thickness measurements. Lumetrics Inc., Rochester.
[7]. Abdellah, E., & Wang, B. (2017, September). CFD analysis on effect of front windshield angle on aerodynamic drag. In IOP Conference Series: Materials Science and Engineering (Vol. 231, No. 1, p. 012173). IOP Publishing.
[8]. Gunpinar, E., Coskun, U. C., Ozsipahi, M., & Gunpinar, S. (2019). A generative design and drag coefficient prediction system for sedan car side silhouettes based on computational fluid dynamics. Computer-Aided Design, 111, 65-79.
[9]. Sharma, R. B., & Bansal, R. (2013). CFD simulation for flow over passenger car using tail plates for aerodynamic drag reduction. IOSR Journal of Mechanical and Civil Engineering (IOSR-JMCE), 7(5), 28-35.
[10]. Ali, Z., Tyacke, J., Watson, R., Tucker, P. G., & Shahpar, S. (2019). Efficient preprocessing of complex geometries for CFD simulations. International Journal of Computational Fluid Dynamics, 33(3), 98-114.
[11]. He, Y., Bayly, A. E., & Hassanpour, A. (2018). Coupling CFD-DEM with dynamic meshing: A new approach for fluid-structure interaction in particle-fluid flows. Powder Technology, 325, 620-631.
[12]. Zawawi, M. H., Saleha, A., Salwa, A., Hassan, N. H., Zahari, N. M., Ramli, M. Z., & Muda, Z. C. (2018, November). A review: Fundamentals of computational fluid dynamics (CFD). In AIP conference proceedings (Vol. 2030, No. 1). AIP Publishing.
[13]. BAYINDIRLI, C., & Çelik, M. (2020). The determination of effect of windshield ınclination angle on drag coefficient of a bus model by CFD method. International Journal of Automotive Engineering and Technologies, 9(3), 122-129.
[14]. Abhishek, G., Ramsankar, V., Sreesankaran, M., Sabareesh, G., & Jalaiah, N. (2016). Combined effects of vehicle body geometry and drag reduction techniques on drag coefficient. In 8th International Colloquium on Bluff Body Aerodynamics and Applications, Boston.