


1. Introduction
As a crucial component of aerospace systems, aviation engines primarily provide propulsion for various spacecraft and aircraft. Their performance directly impacts the safety and efficiency of these vehicles, making them vital core components. While the reliability of aviation engines has been greatly improved over the years due to continuous research and development efforts worldwide, the demands for engine performance have also increased with the growth of the aviation industry. Data indicates that for every 100K increase in turbine temperature, there can be a nearly 15% increase in maximum thrust [1]. The escalating pre-turbine gas temperatures have led to extremely high turbine working temperatures, approaching the melting point of turbine blades. Furthermore, rotor blades rotating under high-temperature and high-pressure conditions experience significant centrifugal forces, which can easily induce creep in metallic materials [2]. In the first stage gas turbine blade, pitting corrosion and oxidation of coatings are also the life-limiting factors. These pits acted as notches in which a concentration of stresses was generated, initiating cracks due to fatigue that further propagated due to hot corrosion [3, 4]. Wang et al [5] demonstrate that as the main reason of turbine blade failure, thermo-mechanical fatigue (TMF) cannot be ignored. In general terms, turbine failures can be classified into crack creep, thermal fatigue (low cycle fatigue), thermomechanical fatigue (high cycle fatigue), corrosion, erosion, oxidation and foreign object damage [6].
Currently, research on the thermal protection of turbine blades primarily focuses on two aspects: the development of high-temperature-resistant materials for the blades and the exploration of turbine blade cooling technologies [7]. High-temperature alloys, titanium alloys, intermetallic compounds, refractory metals, metal-ceramic materials, and composite materials are among the high-temperature-resistant materials currently in use [8]. These materials exhibit excellent high-temperature strength and oxidation resistance, making them candidate materials for use in extreme environments and widely applied in critical components such as turbine blades, turbine disks, and compressors [9-11]. Turbine blade cooling methods primarily fall into two categories: the design of complex cooling structures within the blades and the application of TBC. Huang [12] built stator-rotor-stator blade row flow field model and established the method to analyze high and low cycle stress responses of turbine blades. Peng [13] base on isogeometric analysis, conducted fluid-solid coupling simulation on turbine blades and optimized the geometry of turbine blade to get a structure that has smaller stress. Liu et al. [14] analyze the influence of TBC to turbine blade with internal cooling and film cooling. Three different kinds of film holes are compared and the thermal stress of TBC with trench hole is lowest. Moreover, the relation among thermal insulation performance of TBC and internal/external heat transfer coefficient, thickness of TBC is analyzed. Yang et al. [15] conducted a study using numerical simulation to investigate the structural strength of turbine blades under the influence of centrifugal loads, thermal loads, and aerodynamic loads. They found that centrifugal loads had the most significant impact on the structural strength of the blades. Thermal loads had a substantial effect on blade deformation and displacement, with the maximum deformation occurring at the leading edge and tip of the suction side of the blade. Zhang et al. [16], using a fluid-thermal-solid coupled numerical simulation method, analyzed the effect of TBC on blade cooling and stress reduction in the first-stage turbine blades of a gas turbine. Their results demonstrated that TBC effectively reduced the temperature of the blade substrate, and as the thickness of the TBC increased, the stress in the critical regions of the blade gradually decreased.
Although there has been significant progress in analyzing the thermal characteristics of turbine blades at present, the research on the influence of different TBC and cooling structures on blade temperature and stress distribution is insufficient. There is still a lot of research space to improve blade performance through thermal barrier coating and structural optimization design. Therefore, in this paper a fluid-thermal-solid coupling aeroengine turbine blade model is built to further explore the influence of TBC and cooling structures to the thermal performance of turbine blade.2. Model
2. Model
2.1. Geometrical Structure of the Turbine Blade Model and Material Parameters
Turbine blades can be classified into high pressure turbine blades (without shroud) and low-pressure turbine blades according to their different working environments. The overall structure of a working blade mainly consists of four parts: the blade body, the edge plate, the transition section, and the tenon teeth. Blade body is the key research object. The study object in this paper is shroudless high pressure turbine blades. Transition section and tenon teeth are not included during the computation since the aerodynamic load mainly focus on the blade body.
The geometry models of turbine blades are built in SolidWorks. The vital step of building the model is to draw a precise and reasonable cross section of blades. The theoretical basis for parametric design of turbine blades is given by equation (1)-(9) [17]:
\( {x_{A}}=-(l-{r_{1}}-{r_{2}})cos{γ} \)
\( {y_{A}}=-(l-{r_{1}}-{r_{2}})sin{γ}\ \ \ (1) \)
\( {x_{B}}=0,{y_{B}}=0\ \ \ (2) \)
 (3)
(3)
\( {x_{D}}={x_{A}}-{r_{1}}sin{(}{β_{r1}}-0.5{ω_{1}}) \)
\( {y_{D}}={y_{A}}+{r_{1}}cos{( {β_{r1}}-0.5{ω_{1}})}\ \ \ (4) \)
\( {x_{E}}=({b_{2}}+{r_{2}})sin{(}{β_{r2}}-0.5{ω_{1}}+δ) \)
\( {y_{E}}=({b_{2}}+{r_{2}})cos{( {β_{r2}}-0.5{ω_{1}}+δ)}\ \ \ (5) \)
\( {b_{2}}=tsin{{β_{2AV}}}\ \ \ (6) \)
\( {x_{F}}={x_{B}}-{r_{2}}sin{(}{β_{r2}}-0.5{ω_{1}}) \)
\( {y_{F}}={y_{B}}-{r_{2}}cos{( {β_{r2}}-0.5{ω_{1}})}\ \ \ (7) \)
\( {x_{G}}={x_{B}}+{r_{2}}sin{(}{β_{r2}}+0.5{ω_{1}}) \)
\( {y_{G}}={x_{B}}+{r_{2}}cos{( {β_{r2}}+0.5{ω_{1}})}\ \ \ (8) \)
\( {x_{H}}={x_{A}}+{r_{1}}sin{(}{β_{r1}}+0.5{ω_{1}}) \)
\( {y_{H}}={y_{A}}+{r_{1}}cos{( {β_{r1}}+0.5{ω_{1}})}\ \ \ (9) \)
\( {β_{r1}} \) is the geometric inlet angle, \( {β_{r2}} \) is the geometric exit angle, \( {β_{2AV}} \) is the effective exit angle, \( δ \) is the trailing edge tunning angle, \( l \) is the chord length, \( {C_{max}} \) is the maximum thickness of blade profile, \( {r_{1}} \) is the radius of the circle C1 at leading edge, \( {r_{2}} \) is the radius of the circle C2 at trailing edge, \( {X_{Cmax}} \) is the distance between the center of the maximum inscribed circle C3 of blade profile and leading edge, \( {Y_{Cmax}} \) is the distance between the center of the maximum inscribed circle C3 of blade profile and the chord line, \( {ω_{1}} \) is the leading edge closed angle, \( γ \) is the setting angle. The position of each point in the blade cross section and the relation among the parameters are shown in figure 1.
Figure 1. Detailed cross section of turbine blade.
The whole curve of the blade reaches G1 continuity, some region reaches G2 curvature continuity. For a detailed modeling method, please refer to reference [17]. The final blade model is shown at figure 2.
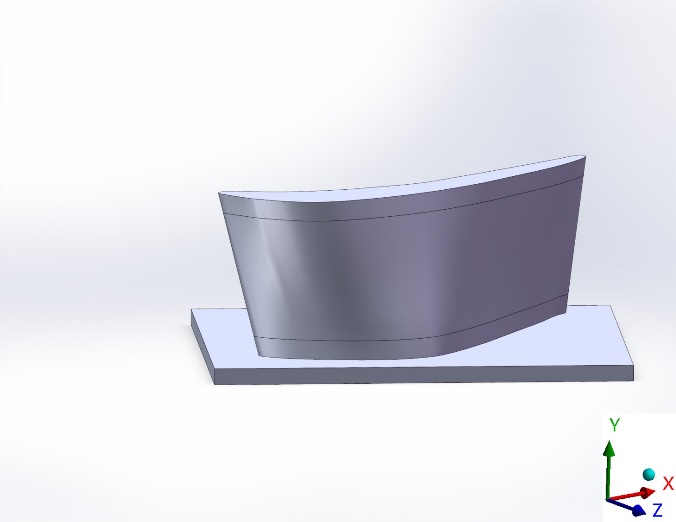
Figure 2. Basic turbine blade model.
Based on the model shown in figure 1, a blade model with internal cooling structure is built as seen in figure 3.
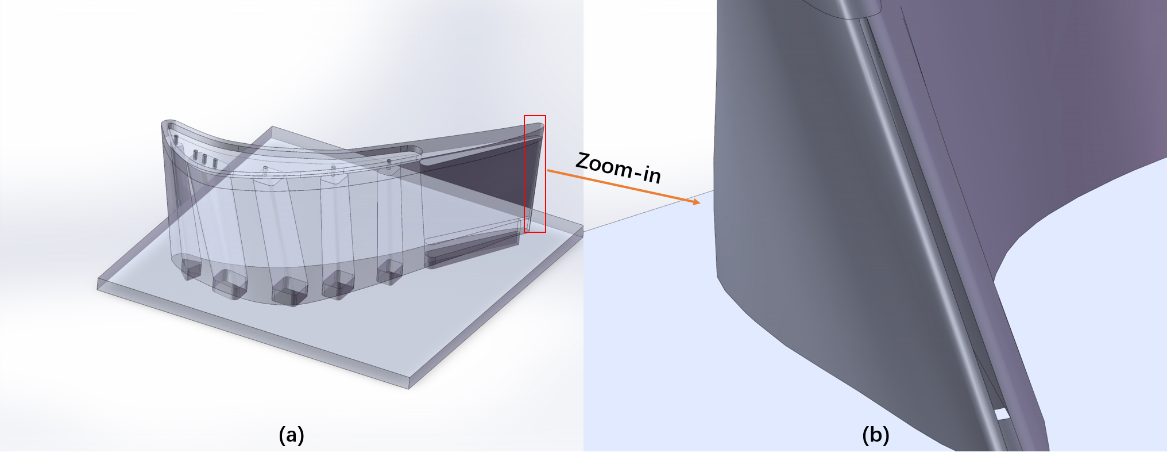
Figure 3. Turbine blade with internal cooling passages:(a) Overall structure; (b) trailing edge structure.
In order to investigate the influence of film holes to the cooling performance of the blade, a model as shown in figure 4 is built based on the model shown in figure 3. Name the models shown in figure 1, figure 2, figure 3 as Turbine blade model 1 (TBM 1), TBM 2, TBM 3 respectively. The diameter of the film holes at the top side of TBM 2 are 3mm and are 1.5 mm for TBM 3. The diameter of the rest of film holes in TBM 3 are 1 mm. There is film groove at the trailing edge of TBM 2 and are film holes for TBM 3. The geometry for edge plate and tenon teeth are simplified since focus of this paper is the blade body. The final simulation model is shown at figure 5.
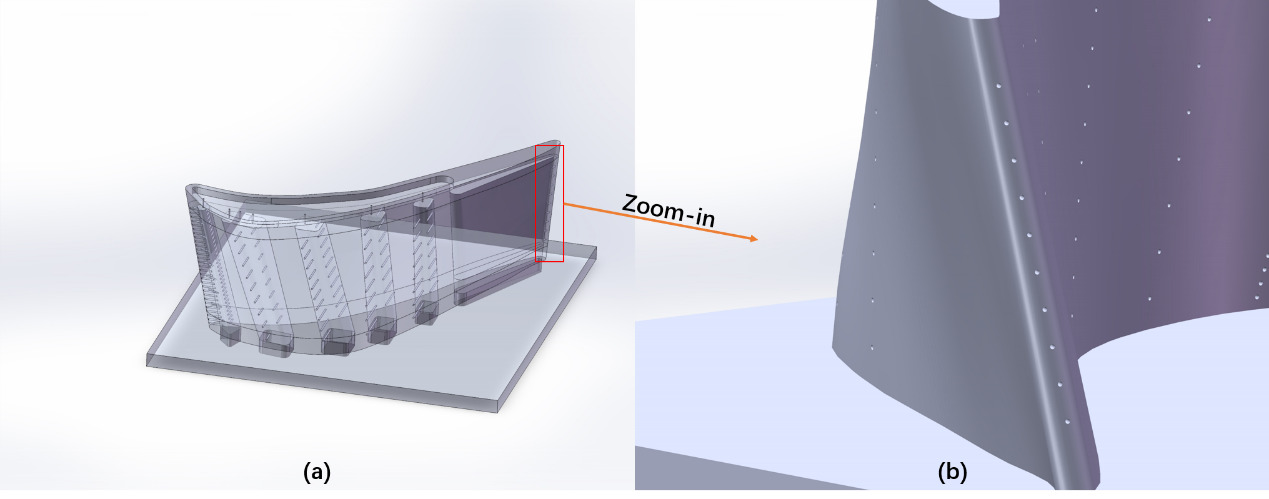
Figure 4. Turbine blade model including cooling passages and film holes:(a) Overall structure; (b) trailing edge structure.
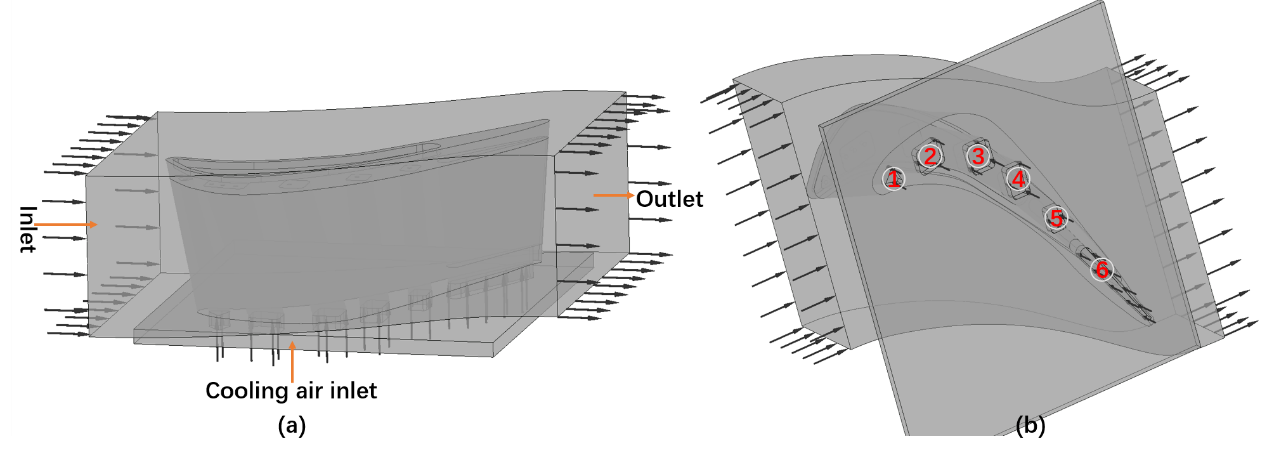
Figure 5. Simulation model sketch:(a) Inlet and outlet boundaries; (b) Cooling passages.
The vane is made of directionally solidified superalloy (DZ411). Vane and TBC are treated as elastic materials, whose properties are considered as temperature independent. In this work the anisotropy of DZ411 is considered. 9 parameters are adopted to define the constitutive parameters, all of which are function of temperature. They are: \( {E_{xx}},{E_{yy}},{E_{zz}},{υ_{xy}},{υ_{yz}},{υ_{xz}},{G_{xy}},{G_{yz}},{G_{xz}} \) , where \( E \) is Young’s Modulus, \( υ \) is Poisson’s ratio, \( G \) is Shear Modulus. The coordinate is shown in figure 2. The anisotropy difference of the cross section of the blade at the same height is ignored which means the directionally solidified superalloy is isotropic at the same cross section. The value of the 9 parameters is shown in Table 1 [16].
Table 1. Orthotropic elasticity parameters.
\( T/K \) | \( {E_{xx}},{E_{zz}}/MPa \) | \( {E_{yy}}/MPa \) | \( {υ_{xy}},{υ_{yz}} \) | \( {υ_{xz}} \) | \( {G_{xy}},{G_{yz}}/MPa \) | \( {G_{xz}}/MPa \) |
293.13 | 179600 | 136600 | 179600 | 0.361 | 0.361 | 0.496 |
373.13 | 173100 | 132500 | 173100 | 0.363 | 0.363 | 0.506 |
473.13 | 166200 | 129300 | 166200 | 0.365 | 0.365 | 0.512 |
573.13 | 160400 | 126300 | 160400 | 0.368 | 0.368 | 0.516 |
673.13 | 154100 | 122500 | 154100 | 0.372 | 0.372 | 0.522 |
773.13 | 149600 | 117200 | 149600 | 0.376 | 0.376 | 0.529 |
873.13 | 144500 | 112400 | 144500 | 0.381 | 0.381 | 0.535 |
973.13 | 137300 | 107600 | 137300 | 0.385 | 0.385 | 0.541 |
1073.13 | 127300 | 102400 | 127300 | 0.389 | 0.389 | 0.549 |
1173.13 | 118500 | 92620 | 118500 | 0.407 | 0.407 | 0.56 |
1273.13 | 108400 | 84240 | 108400 | 0.418 | 0.418 | 0.572 |
1373.13 | 104000 | 80000 | 104000 | 0.43 | 0.43 | 0.575 |
1473.13 | 102000 | 75000 | 102000 | 0.45 | 0.45 | 0.578 |
The specific heat capacity \( {C_{m}} \) and thermal conductivity \( ϕ \) of the blade are taken from the relevant data of DZ411 and fitted to the formula (10)-(11),
\( {C_{m}}={b_{1}}{T^{2}}+{b_{2}}T+{b_{3}}\ \ \ (10) \)
\( ϕ={b_{1}}{T^{2}}+{b_{2}}T+{b_{3}}\ \ \ (11) \)
where the value of b1, b2, b3 is shown in Table 2 [16].
Table 2. Specific heat capacity and Conductivity parameters.
Parameter | \( {C_{m}} \) | \( ϕ \) |
\( {b_{1}} \) | 4.0535×10⁻⁵ | -6.00×10⁻⁶ |
\( {b_{2}} \) | 4.5376×10⁻² | 2.43×10⁻² |
\( {b_{3}} \) | 451.66 | 1.868 |
The thermal conductivity of TBC varies with its different components, it is taken by 1.7 W/(m·K) in this paper, and the specific heat capacity is taken by 505 /(kg·K) [18].
The density of the blade is 8344 kg/m3, the coefficient of thermal expansion varies with temperature, and its relation is shown at figure 6 [19].
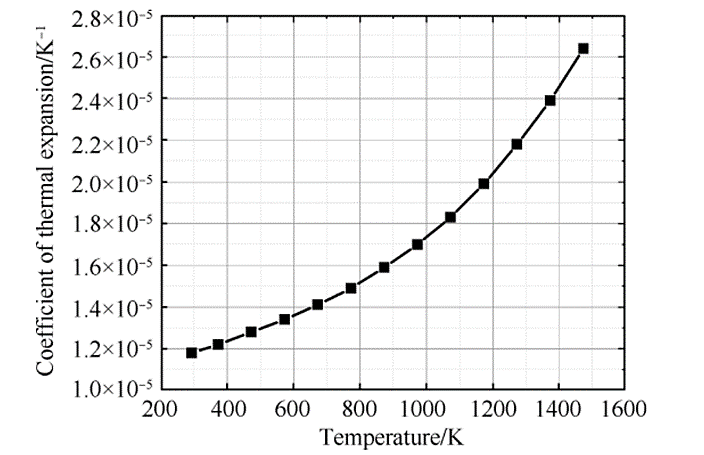
Figure 6. Coefficient of Thermal expansion.
2.2. Governing equation
Menter’s Shear Stress Transport (SST) k-ω turbulence model has the advantage to combine the accuracy of k-ω model in near wall region with the good performance of k-ε model in the main flow region. Moreover, it has good behavior in adverse pressure gradients and separating flows. Therefore, in this research we use (SST, k-ω) turbulent model. The general forms of the governing equations of mass, momentum, energy and the (SST, k-ω) turbulence model which consist of two equations are as follow:
Mass conservation equation:
\( ∇(ρu)=0\ \ \ (12) \)
Momentum conservation equation:
\( ∇(ρuu)=-∇P+∇τ\ \ \ (13) \)
Energy conservation equation:
\( ρ{C_{P}}(\frac{∂T}{∂t}+u∇T)+∇(q+{q_{r}})={α_{P}}T(\frac{∂p}{∂t}+u∇p)+τ:∇u+Q\ \ \ (14) \)
Turbulent kinetic energy:
\( ρ\frac{∂k}{∂t}+ρu∇k=P-ρβ_{0}^{*}kω+∇((μ+{σ_{k}}{μ_{T}})∇k)\ \ \ (15) \)
specific turbulent dissipation rate (or specific turbulent frequency):
\( ρ\frac{∂ω}{∂t}+ρu∇ω=\frac{ργ}{{μ_{T}}}P-ρβ{ω^{2}}+∇((μ+{σ_{ω}}{μ_{T}})∇ω)+2(1-{f_{v1}})\frac{ρ{σ_{ω2}}}{ω}∇ω∇k\ \ \ (16) \)
Where,
\( P=min{( {P_{k}},10ρβ_{0}^{*}kω)}\ \ \ (17) \)
And Pk is given by:
\( {P_{k}}={μ_{T}}(∇u:(∇u+{(∇u)^{T}})-\frac{2}{3{(∇u)^{2}}})-\frac{2}{3}ρk∇u\ \ \ (18) \)
Turbulence viscosity is given by:
\( {μ_{T}}=\frac{ρ{a_{1}}}{max{( {a_{1}}ω,S{f_{v1}})}}\ \ \ (19) \)
Cp is the specific heat capacity at constant pressure, T is the absolute temperature, \( {α_{P}} \) is the coefficient of thermal expansion, τ is the viscous stress tensor, Q contains heat sources other than viscous dissipation.
2.3. Boundary conditions
The Solid and Fluid domain are shown in figure 5. The detailed fluid boundary conditions of coupling heat transfer simulation are given in Table 3 [16]. Furthermore, the thickness of TBC needs to be determined. In real engineering world the thickness of TBC directly relates to its serving condition and the process level of coating preparation. The thickness of the ceramic layer of TBC is 0.1-0.5 mm [20]. In this work, 5 different thickness of TBC are set, as seen in Table 4.
Table 3. Boundary conditions for the fluid domain.
Parameter | Value | Parameter | Value |
Inlet total temperature/K | 1600 | Total temperature at cool air inlet 1-5/K | 622.3 |
Inlet total pressure/MPa | 15 | Flow mass of cool air inlet 6/ (kg/s) | 0.01 |
Outlet static pressure/MPa | 0.702 | Total temperature at cool air inlet 6/K | 622.3 |
Flow mass of cool air inlet 1-5/ (kg/s) | 0.04 | Rotating speed/ (r/min) | 3000 |
Table 4. Different thickness of TBC.
ID | Thickness of TBC/mm |
TBC 0 | 0 |
TBC 1 | 0.1 |
TBC 2 | 0.2 |
TBC 3 | 0.3 |
TBC 4 | 0.4 |
2.4. Analysis process and validation of the solver
The fluid domain consists of gas passage and cooling air passages, the solid domain is the turbine blade, combine these two domains and start fluid-thermal-solid coupling analysis, the model is shown at figure 5. There are two ways to set the TBC, one is to build real different thickness TBC layer while building the geometry model, the other is through setting different thermal resistance to simulate different thickness of TBC. Since the thickness of TBC is thinner than 0.5% of axial chord length of the blade, the second method is taken in this paper. The thermal radiation effect to the temperature field is neglectable for the first stage blade [21]. Hence, it is neglected in this work. After computing fluid field in fluid domain and the surface temperature of the blade under the TBC, the result is imported as thermal load into stress analysis to calculate the stress and strain responses and distribution. Take TBM 2 as an example, for the sake of capturing the influence of film holes and internal cooling passages to the temperature and fluid field more precisely, denser grid is applied in film holes and the first 5 cooling passages that with smaller volume, as shown in figure 7.
This paper verified the grid independence with three groups of different numbers of grids. The results are shown in Table 5. \( {T_{surf,ave}} \) is the average temperature of the surface inside and outside of the vane. \( {v_{max}} \) is the max velocity of the fluid domain. As shown in Table 5, the variation of temperature among these cases is tiny. The variation of velocity between case 1 and case 2 is 1.89%, and it’s 0.56% between case 2 and case 3. Apparently, temperature is not related to the grid size and the difference of velocity between case 1 and case 2 is acceptable. Therefore, the case 1 with 2156596 elements is set for this numerical investigation.
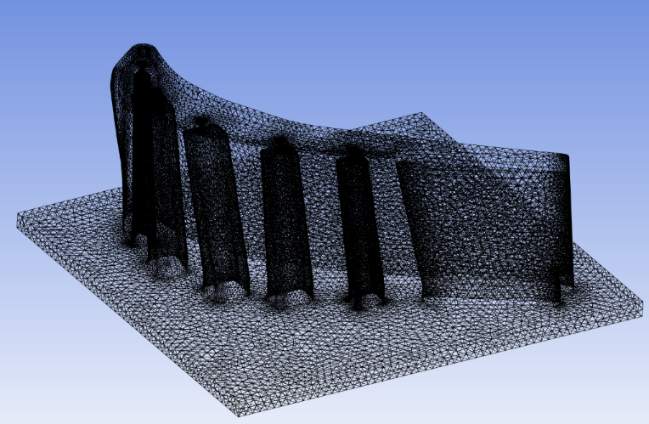
Figure 7. Mesh of turbine blade model 2.
Table 5. Grid convergence results.
Grid size | \( {T_{surf,ave}} \) /(K) | \( {v_{max}} \) /(m/s) | |
Case 1 | 2156596 | 1571 | 1745 |
Case 2 | 2983554 | 1572 | 1778 |
Case 3 | 3761035 | 1572 | 1788 |
3. Result
3.1. Flow Analysis
Fluid field characteristics plays an important role in the heat transfer on the surface of turbine blade. The fluid field characteristics analysis of TBM 2 is done in this section. figure 8 shows the pressure distribution of the center curve of the turbine blade (as seen in figure 9) at different thickness of TBC. In figure 8, from leading edge to trailing edge, the general trend of pressure on the suction side and pressure side is decreasing. There is a small adverse pressure gradient close to the leading edge on pressure side and a relatively big one close to the trailing edge on the suction side. The pressure curves of the center curve of turbine blade under four different thickness of TBC are almost the same. The influence of TBC to the fluid field parameters is tiny. Thus, the results of the working condition of 0.4mm (TBC 4), which is closer to the actual design thickness, are selected to discuss the flow field characteristics.
|
|
Figure 8. Distribution of pressure at center curve. | Figure 9. Center curve of blade. |
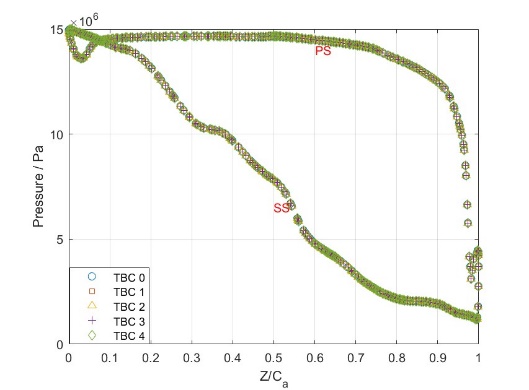
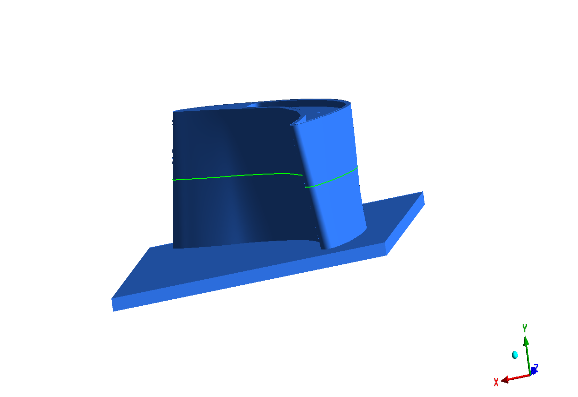
Figure 10 (a), (b), (c) are the streamlines of TBM 1, TBM 2, TBM 3 at 70% span respectively. The streamlines outside the blade at the same height are similar for these three models. The velocity increases along with the radial direction and reaches its maximum around the trailing edge on the suction side. For TBM 2, the angle between the cooling passages and the direction of the inlet cooling flow, the cross sections of the cooling passages vary along the height of the blade, the small size of the cooling air exits lead to the complicated fluid field inside the cooing passages. For TBM 3, there are film holes along the height of the blade for the first 5 cooling passages, cooling air leak from these holes, which causes the cooling air cannot occupy the whole passages and finally leads to the situation shown in figure 10 (c). Figure 11, 12 show the streamlines inside the cooling passages of TBM 2 and TBM 3 respectively. As shown in figure 11, cooling air almost occupy the whole cooling passages except for the sixth passage. As shown in Figure 12, because of the film holes on both the suction side and pressure side, the closer to the top of blade the rarer the streamlines. For both TBM 2 and TBM 3 the vortex exists in the sixth passage because of the insufficient mass flow rate.
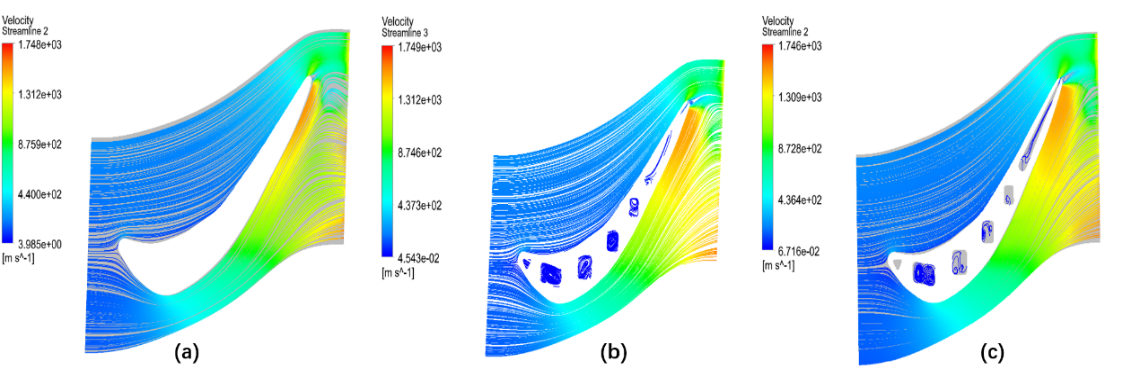
Figure 10. Streamline of turbine blade model at different span:(a) Turbine blade model 1; (b) Turbine blade model 2; (c) Turbine blade model 3.
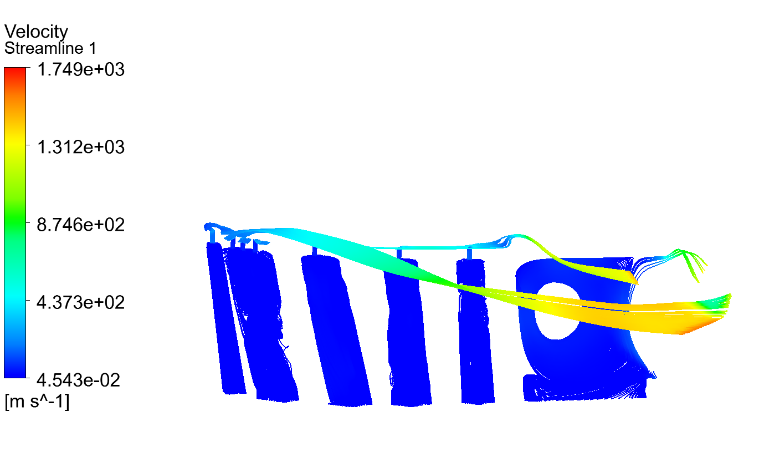
Figure 11. Streamline of cooling passages of turbine blade model 2.
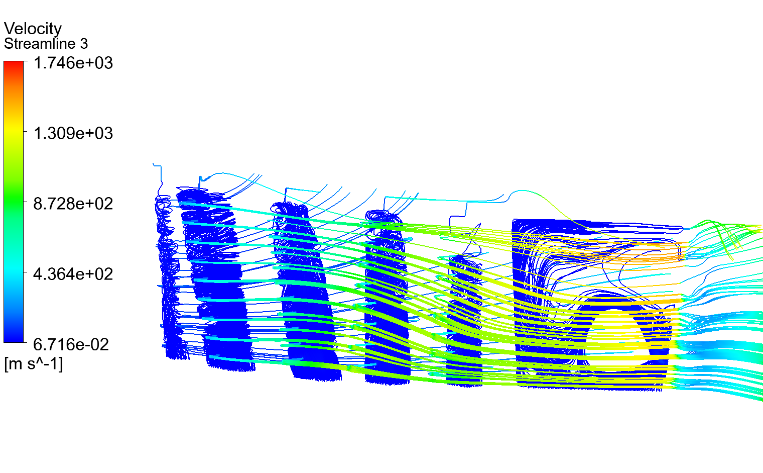
Figure 12. Streamline of cooling passages of turbine blade model 3.
Figure 13 (a), (b), (c) show the flow patterns of cooling air that exit from the film holes of TBM 2, suction side of TBM 3 and pressure side of TBM 3 respectively. There is no cooling air flowing out from the film holes of the first passage on the suction side of TBM 3, which is because of the pressure difference of pressure side and suction side. Figure 13 (d) shows the pressure distribution at 70% span of TBM 3. There is a pressure gradient from the suction side to the pressure side around the leading edge, which result in the cooling air only exit from the holes on the pressure side. For the section between the leading edge and trailing edge, since the pressure on the suction side is smaller than the pressure side, cooling air mainly flow out from the holes on the suction side and the hot gas flow into the holes on the pressure side. This discovery provides solid foundation to further optimize the position of film holes.
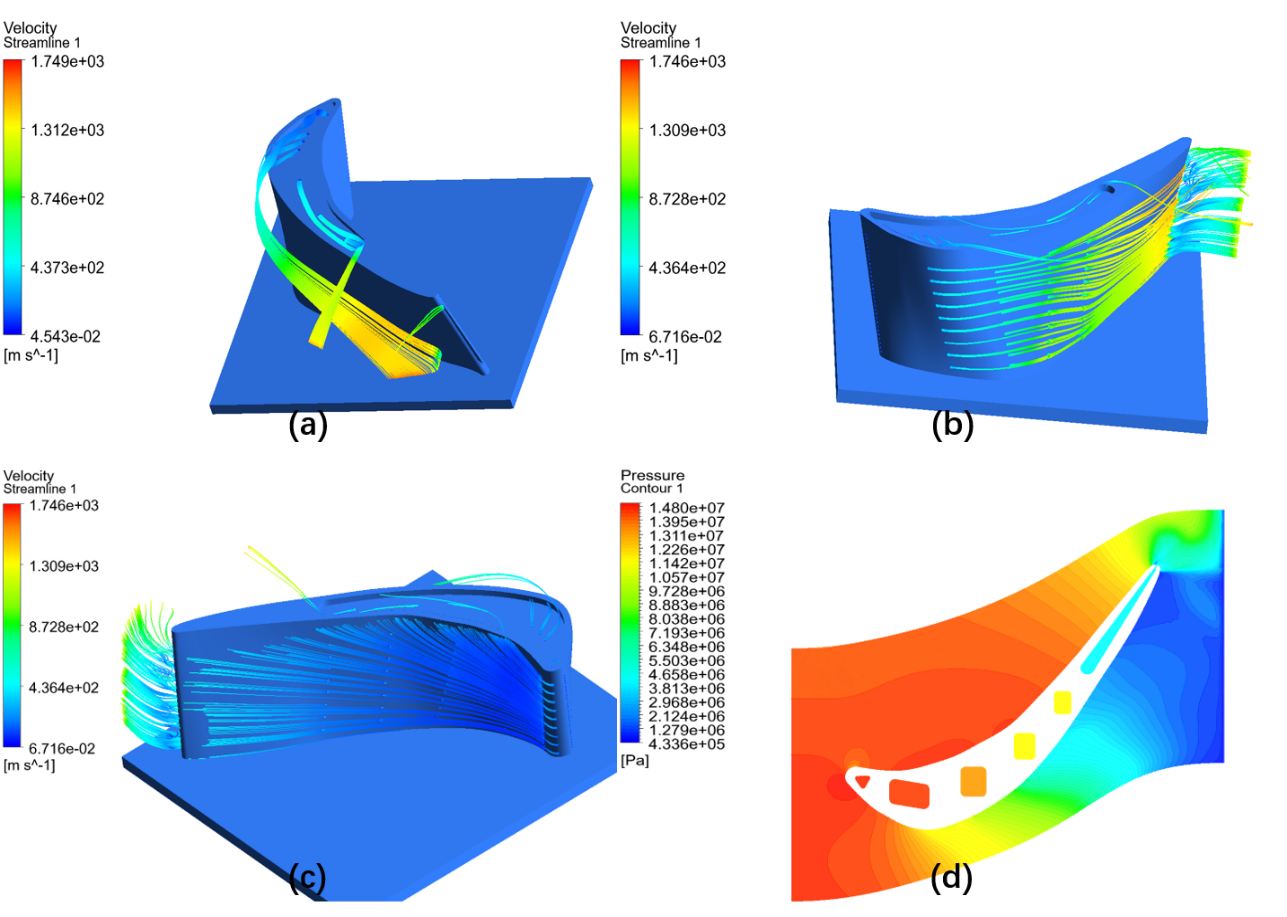
Figure 13. Streamlines emanating from cooling holes and pressure distribution at 70% span:(a) Turbine blade model 2; (b) Suctuion side of Turbine blade model 3; (c) Pressure side of Turbine blade model; (d) Pressure distribution at 70% span of turbine blade model 3.
3.2. Heat Transfer Analysis
In order to analyze the effects of TBC on the performance of heat transfer, take TBM 2 as an example, calculate the surface temperature distribution of the cooling passages and the surface of TBM 2 for different thickness of TBC. Then the surface temperature is taken as thermal load and is imported to the steady-state analysis system to calculate the final temperature distribution of the blade body. The final external temperature distribution is shown at figure 14. Under different thickness of TBC, the location of high-temperature region and low-temperature region do not change obviously. As the thickening of TBC, the temperature at the high-temperature and low temperature region decreases and the area of high-temperature region shrinks, the aera of low-temperature region expands.
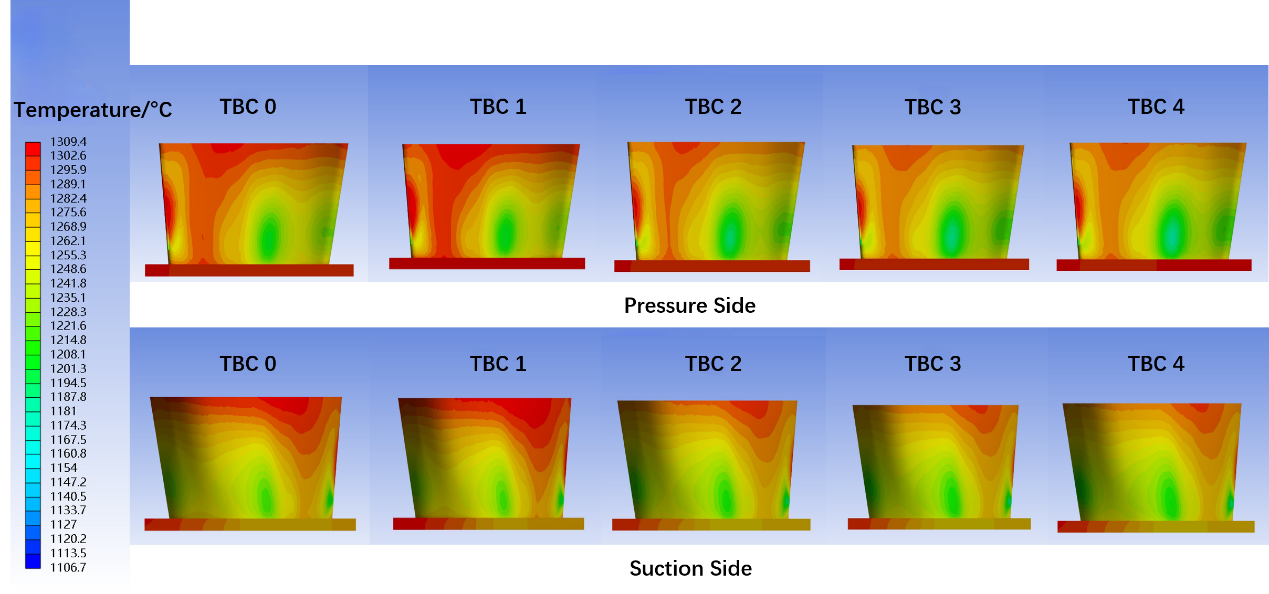
Figure 14. Temperature distribution of turbine blade model 2 at different TBC thickness.
Figure 15 shows the average, highest, lowest temperature of the blade body. When the Thickness of TBC increases from 0 to 0.4 mm, the highest temperature slightly decreases, the average and lowest temperature decline relatively large. Based on the result shown in figure 15 and figure 14, when the thickness of TBC is 0.4 mm, the cooling effectiveness of the blade body is the best. Therefore, the subsequent analysis of the three blade models will be carried out with this thickness value.
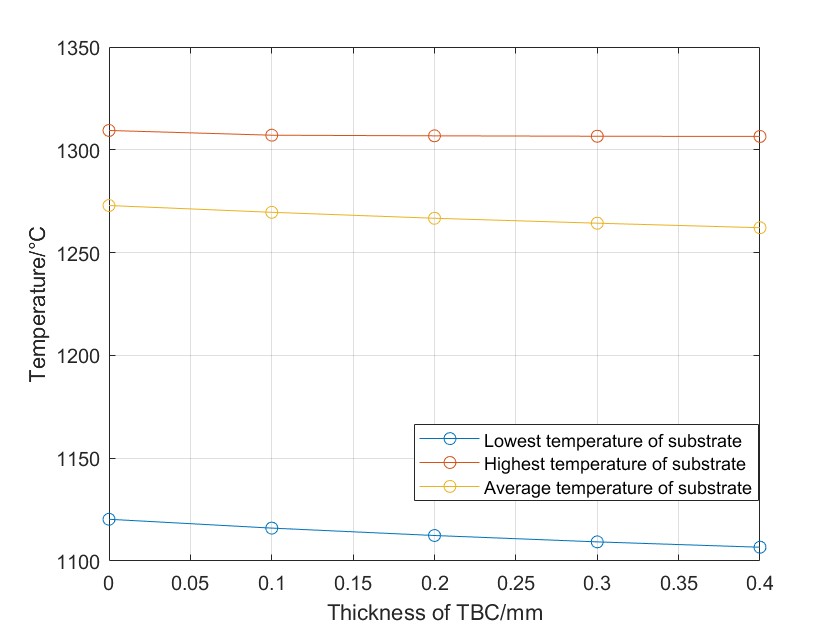
Figure 15. Relation between temperature and thickness of TBC.
The temperature distribution of the three turbine blade models is shown in figure 16. Taking the temperature distribution of TBM 1 as a reference, it can be seen that the temperature of TBM 2 and TBM3 decreases significantly. For TBM 2, from the leading edge to the rear of the blade body, the temperature raises along with the height of the blade and reaches its summit at the top side of the blade. The highest temperature region at the top side of the blade is located around the film hole that is closest to the trailing edge. A center distribution of temperature is presented at the trailing edge that is temperature decreases outward from the center of blade height. There is an inverse temperature gradient at the tip of the blade that is the temperature slightly raises at the blade tip but still lower than the center temperature. The occurrence of this phenomenon is because the formation of the vortex in the sixth cooling passage of TBM3 causes the cooling air only flows out from the top area of film groove at the trailing edge and the lack of cooling air around the center of trailing edge, which leads to the decrease of temperature close to the top side of the blade and the high temperature at the center of the trailing edge. The low temperature region at the root of trailing edge is because this region is close to the inlet of cooling air. Moreover, there is no streamline at the center of the vortex, which causes limited temperature diminishing at the region close to the vortex center.
In an effort to let the cooling air uniformly distributed in the blade body and let the cooling air flows out from different height of trailing edge, so that the temperature can be further diminished, more films holes are added into the blade body and the film groove at the trailing edge is turned into several film holes and the TBM 3 is therefore produced. As shown in figure 16, compared to TBM 2, the temperature distribution of TBM 3 below 80% height of the blade from leading edge to the rear of the blade is similar to TBM 2, the difference is that its temperature is lower and the low temperature region is larger. Hence, the film holes can help to decrease the temperature of the blade. Since the radius of the film holes at the top side of the blade reduces from 3mm to 1.5 mm and the added film holes along the height of the blade, the amount of cooling air flowing into the top side of the blade reduces. Compared to TBM 2, the high temperature area expands at the top side of TBM 3, and the temperature of the rear part of the blade increases because the cooling air at the top of the sixth cooling passage become rare. As seen in figure 11 and figure 12, the position of the vortex moves from the top left corner to the bottom right corner, and the cooling air inside the sixth passage mainly flows out from the top and bottom film holes at the trailing edge. Even though the situation that the cooling air only flow out from the top of film groove is relieved, the streamlines are rare at the upper rear, middle part of the sixth passage, which leads to the high temperature at that zone. In a conclusion, it can be seen that regardless of TBM 2 and TBM 3, the temperature distribution at the blade end is not ideal. The reason is that the mass flow rate to the sixth passage is too small. On the premise that the total cooling air inlet mass flow remains unchanged, an attempt can be made to adjust the mass flow distribution between the cooling channels to suppress the generation of vortex in the sixth cooling channel.
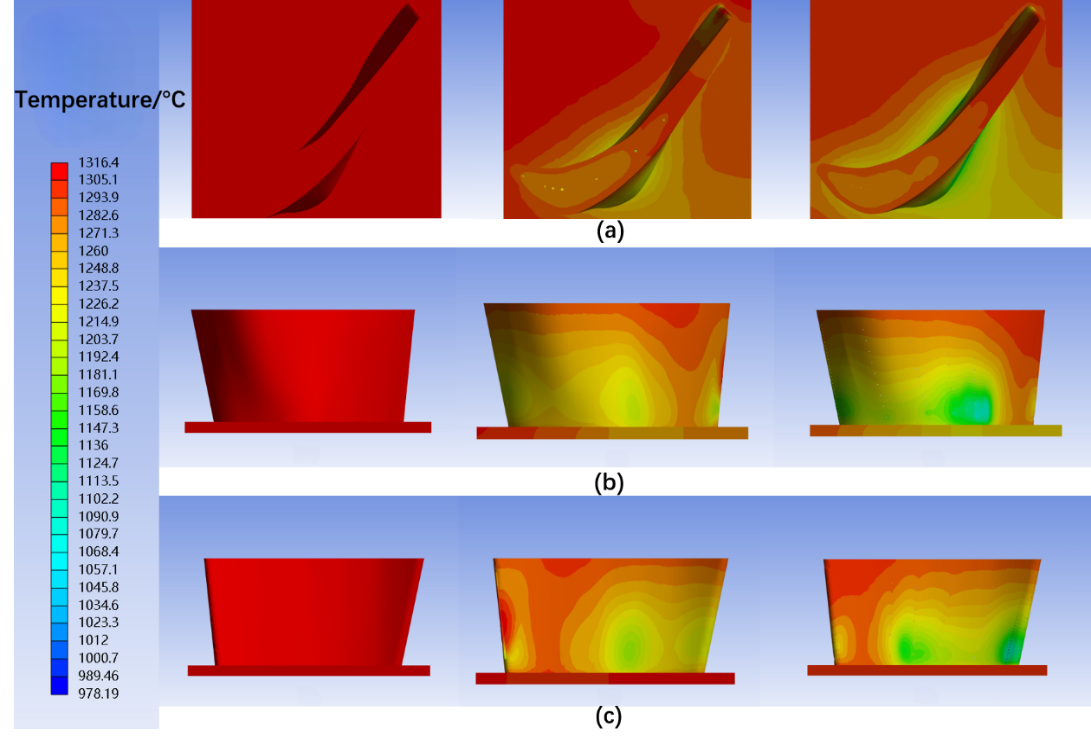
Figure 16. Temperature distribution of TBM1, TBM 2, TBM3 at the same TBC thickness:(a) Top view of three different turbine blade models; (b) Suction side of three different turbine models; (c) Pressure side of three different models.
3.3. Thermal Stress Analysis
There are three components of the load taken by turbine blade: centrifugal load, aerodynamic load, thermal load respectively. Aerodynamic load has a small impact on the stress of the blade [15]. It results in the pressure difference between pressure side and suction side, which provides power for the rotation of turbine blades. Centrifugal load causes the high stress of the blade. Since the material properties relate to the temperature, the blade body temperature distribution is considered as part of the overall load. The stress caused by thermal expansion is also calculated. According to the above simulation result, TBM 3 with 0.4 mm TBC thickness has the best cooling performance. Therefore, in the following article, the blade model 3 will be taken as the research object to study the stress distribution. Figure 17 shows the Von Mises equivalent stress distribution on the surface of TBM 3. The stress decreases along the blade height. Because the tenon teeth used to fix the blade and the transition section are simplified, a high stress concentration area is generated around the entrance of cooling passages and the results of that area is not accurate and reliable. High stress concentration region is generated at the intersecting surface of the blade and edge plate. The location of the large stress concentration area is shown in figure 17 (c), (d), which is similar to place where large stress appears in reference [15, 16].
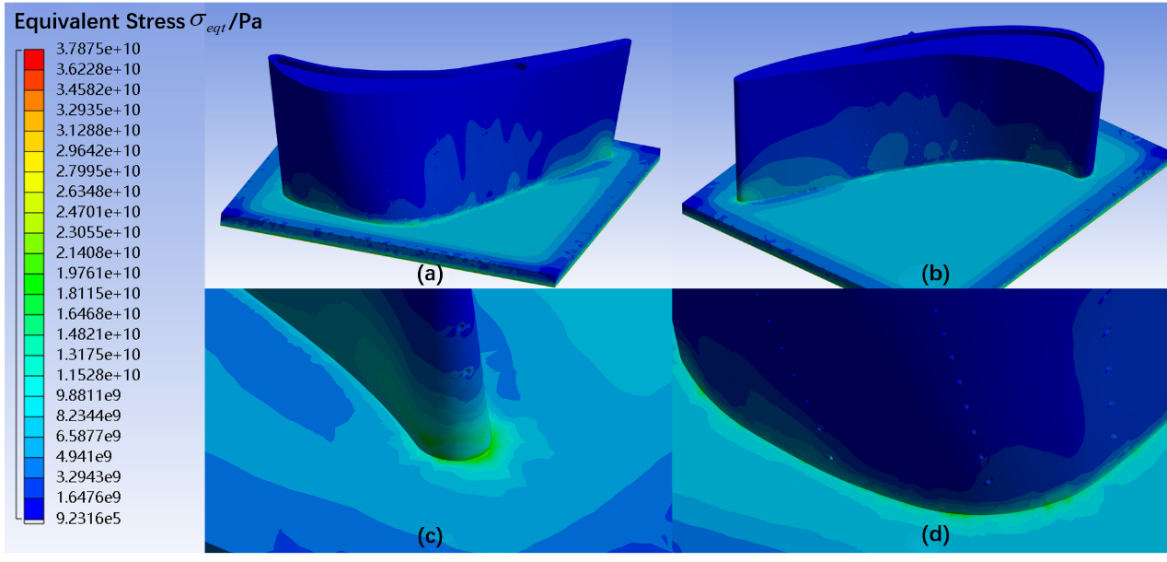
Figure 17. Distribution of stress of turbine blade model 3:(a) Pressure side; (b) Suction side; (c) blade root at trailing edge; (d) Section on Pressure side near leading edge.
Besides the stress outside surface of the blade, the stress distribution inside the blade should also be analyzed. Figure 18 (a), (b), (c) are the stress distribution at 0% span, 25% span, 50% span of the blade respectively. As seen in the figure, the stress decreases as the height of blade increases, which is similar to the stress distribution in the height direction on the outside surface of the blade. In figure 18, the max value of stress generated around the trailing edge, which will easily cause the failure of material because of the slim structure there.
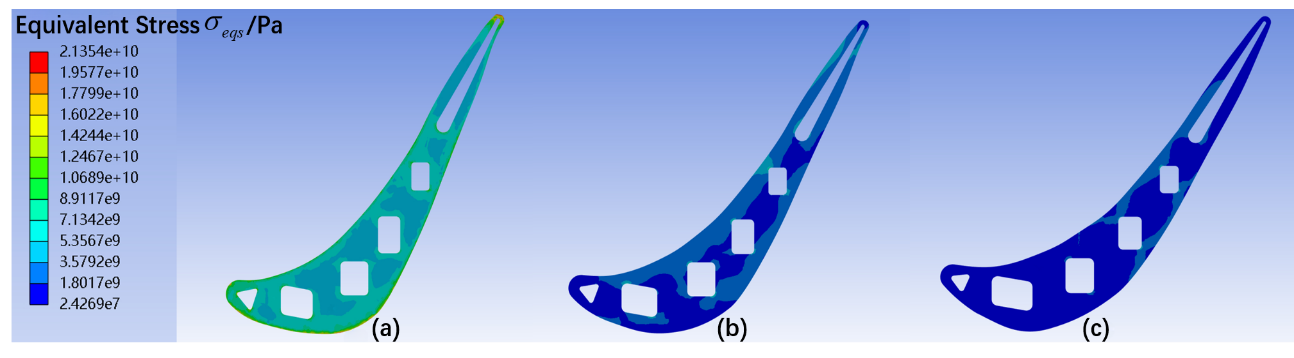
Figure 18. Distribution of stress of turbine blade models at different span:(a) 0% span; (b) 25% span; (c) 50% span.
4. Conclusion
In this work, the turbine blade covered by TBC is taken as research object. The numerical simulation method is utilized to study the flow, heat transfer and stress response of three different turbine blades. The conclusions are shown as follow:
(1) TBC can reduce the working temperature of turbine blade. For TBM 2, when the thickness of TBC raises from 0 mm to 0.4 mm, the average temperature of blade body decreases 10.8 °C, lowest temperature decreases 12.6 °C, highest temperature decreases 2.9 °C. On the top side of the blade, the cooling air only passes the film holes, which leads to the high temperature region outside the holes.
(2) Through the comparison of TBM 1 and TBM 2, it can be found that cooling passages can reduce the temperature of turbine blade efficiently. When the TBC thickness is 0.4 mm, the average temperature diminishes 53.2 °C. Through the comparison of TBM 2 and TBM 3, it can be shown that appropriately places film holes can further reduce the temperature of turbine blade. When the TBC thickness is 0.4 mm, the average temperature diminishes 53.2 °C.
(3) The allocation of cooling air mass flow rate can affect the overall cooling effectiveness of turbine blade directly. Take TBM 2 and TBM 3 as examples, vortex is generated in the sixth cooling passage for both models, which results in the high temperature at the center of the vortex and badly affects the heat dissipation. Therefore, the generation of vortex should be avoided while designing the sixth cooling passage. The generation of vortex can be avoided by trying to design a connected serpentine cooling channel instead of six separated channels; or with the structure unchanged, through adjusting the allocation of the mass flow rate of the cooling air to achieve the goal. For a single cooling channel, it's better for the film holes only exist on one of the pressure side or suction side. Otherwise, the hot gas will flow into the internal channel because of the pressure difference of both sides, which causes negative effect to the cooling effectiveness of the blade.
(4) The stress of TBM 3 decreases along the height of the blade, stress concentration occurs at the intersecting surface of blade and edge plate and the valid max stress occurs at the root of trailing edge. In an effort to avoid the stress concentration, a fillet can be chamfered between the blade body and the edge plate.
References
[1]. Wang Z C, Analysis and Application of high-efficiency of cooling technology of the turbine blade in Aircraft Engine. Modern Manufacturing Technology and Equipment, 2020(06):171-172.
[2]. Sun J Z, Zuo H F, The analysis of the influence of the operating conditions to the creep life of commercial engine turbine blades. Mechanical engineering of China, 2020(06):171-172.
[3]. S. Rani, A.K. Agrawal, V. Rastogi, Failure analysis of a first stage IN738 gas turbine blade tip cracking in a thermal power plant, Case Stud, Eng. Fail. Anal. 8 (2017) 1–10.
[4]. María García-Martínez , Juan Carlos del Hoyo Gordillo, Mª Pilar Valles Gonz´ alez, Failure study of an aircraft engine high pressure turbine (HPT) first stage blade, National Institute for Aerospace Technology, Spain, Engineering Failure Analysis 149 (2023) 107251
[5]. R. Wang, B. Zhang, D. Hu, K. Jiang, H. Liu, J. Mao, F. Jing, X. Hao, Thermomechanical fatigue experiment and failure analysis on a nickel-based superalloy turbine blade, Eng Fail Anal. 102 (2019) 35–45.
[6]. L.K. Bhagi, P. Gupta. A Brief Review on Failure of Turbine Blades, in: Proceedings STME-2013 Smart Technologies for Mechanical Engineering. 25-26, at Delhi Technological University, Delhi, Oct 2013.
[7]. Huang Y B. Development of Rapid Design Simulation System for Fluid-structure coupling Analysis of Aero-engine Turbine Cooling Blades, Master Thesis, 1-114, 2022
[8]. Di Carlo J A, Yun H M, Morscher G N, et al. Progressing SiC/SiC ceramic composite development for gas turbine hot section components under NASA EPM and UEET programs. Am Soc Mechan Eng, 2002, 4:39
[9]. Wang X G, Liu J L, Jin T et al. Tensile behaviors and deformation mechanisms of a nickel-base single crystal superalloy at different temperatures. Mater Sci Eng A, 2014,598:154
[10]. Bai X F, Zhao Q Y, Zeng W D, et al. Characteraization of hot deformation behavior of a biomedical titanium alloy TLM. Mater Sci Eng A,2014,598:236
[11]. Kuo C M, Yang Y T, Bor H Y, et al. Aging effects on the microstructure and creep behavior of Inconel 718 superalloy. Mater Sci Eng A, 2009,510-511:289
[12]. Huang H. Analysis of High and Low Cycle Stress Responses of Turbine Blades under the High Pressure in the Aero-engine, Master Thesis, 1-88, 2022
[13]. Peng B. Isogeometric analysis of fluid-structure interaction and shape optimal design of turbine blade, Master Thesis, 1-76, 2021
[14]. Z.Y. Liu, b, W. Zhu. Numerical prediction of thermal insulation performance and stress distribution of thermal barrier coatings coated on a turbine vane. International Journal of Thermal Sciences, 2020, 158: 106552.
[15]. Yang J, Zhang Z, Liu Z C. Thermal Fluid Structure Coupling Analysis Based on an Aeroengine Turbine Blade. Machinery, 2022(10):74-80
[16]. Zhang Z X, Zeng W, Bian X D, Gao G L, Xiao B. Effects of Thermal Barrier Coating on Temperature and Stress of Turbine Rotor Blade. Journal of Propulsion Technology, 2023(5)
[17]. Liu H S, Ma H, Parameterization of Modeling the Aero-turbine Blade Based on CATIA. Ordnance Industry Automation, 2015(04):56-60
[18]. Tang W Z, The numerical simulation of stress field in a turbine blade with TBCs based on fluid-solid coupling method, Master Thesis, 1-63, 2015
[19]. Academic Committee of the Superalloys, CSM. China Superalloy Handbook (first edition), Cast Superalloys. Beijing: China Quality Inspection Press, 2012
[20]. Liu Z Y, Zhu W, Yang L, et al. Numerical Prediction of Thermal Insulation Performance and Stress Distribution of Thermal Barrier Coatings Coated on a Turbine Vane. International Journal of Thermal Sciences, 2020, 158: 106552.
[21]. Siegel R, Spuckler C M. Analysis of Thermal Radiation Effects on Temperatures in Turbine Engine Thermal Barrier Coatings. Materials Science and Engineering A, 1998, 245 (2): 150-159.
Cite this article
You,H. (2023). Effect of thermal barrier coating on the thermal characteristic of turbine blade and its geometric optimization. Theoretical and Natural Science,14,62-77.
Data availability
The datasets used and/or analyzed during the current study will be available from the authors upon reasonable request.
Disclaimer/Publisher's Note
The statements, opinions and data contained in all publications are solely those of the individual author(s) and contributor(s) and not of EWA Publishing and/or the editor(s). EWA Publishing and/or the editor(s) disclaim responsibility for any injury to people or property resulting from any ideas, methods, instructions or products referred to in the content.
About volume
Volume title: Proceedings of the 3rd International Conference on Computing Innovation and Applied Physics
© 2024 by the author(s). Licensee EWA Publishing, Oxford, UK. This article is an open access article distributed under the terms and
conditions of the Creative Commons Attribution (CC BY) license. Authors who
publish this series agree to the following terms:
1. Authors retain copyright and grant the series right of first publication with the work simultaneously licensed under a Creative Commons
Attribution License that allows others to share the work with an acknowledgment of the work's authorship and initial publication in this
series.
2. Authors are able to enter into separate, additional contractual arrangements for the non-exclusive distribution of the series's published
version of the work (e.g., post it to an institutional repository or publish it in a book), with an acknowledgment of its initial
publication in this series.
3. Authors are permitted and encouraged to post their work online (e.g., in institutional repositories or on their website) prior to and
during the submission process, as it can lead to productive exchanges, as well as earlier and greater citation of published work (See
Open access policy for details).
References
[1]. Wang Z C, Analysis and Application of high-efficiency of cooling technology of the turbine blade in Aircraft Engine. Modern Manufacturing Technology and Equipment, 2020(06):171-172.
[2]. Sun J Z, Zuo H F, The analysis of the influence of the operating conditions to the creep life of commercial engine turbine blades. Mechanical engineering of China, 2020(06):171-172.
[3]. S. Rani, A.K. Agrawal, V. Rastogi, Failure analysis of a first stage IN738 gas turbine blade tip cracking in a thermal power plant, Case Stud, Eng. Fail. Anal. 8 (2017) 1–10.
[4]. María García-Martínez , Juan Carlos del Hoyo Gordillo, Mª Pilar Valles Gonz´ alez, Failure study of an aircraft engine high pressure turbine (HPT) first stage blade, National Institute for Aerospace Technology, Spain, Engineering Failure Analysis 149 (2023) 107251
[5]. R. Wang, B. Zhang, D. Hu, K. Jiang, H. Liu, J. Mao, F. Jing, X. Hao, Thermomechanical fatigue experiment and failure analysis on a nickel-based superalloy turbine blade, Eng Fail Anal. 102 (2019) 35–45.
[6]. L.K. Bhagi, P. Gupta. A Brief Review on Failure of Turbine Blades, in: Proceedings STME-2013 Smart Technologies for Mechanical Engineering. 25-26, at Delhi Technological University, Delhi, Oct 2013.
[7]. Huang Y B. Development of Rapid Design Simulation System for Fluid-structure coupling Analysis of Aero-engine Turbine Cooling Blades, Master Thesis, 1-114, 2022
[8]. Di Carlo J A, Yun H M, Morscher G N, et al. Progressing SiC/SiC ceramic composite development for gas turbine hot section components under NASA EPM and UEET programs. Am Soc Mechan Eng, 2002, 4:39
[9]. Wang X G, Liu J L, Jin T et al. Tensile behaviors and deformation mechanisms of a nickel-base single crystal superalloy at different temperatures. Mater Sci Eng A, 2014,598:154
[10]. Bai X F, Zhao Q Y, Zeng W D, et al. Characteraization of hot deformation behavior of a biomedical titanium alloy TLM. Mater Sci Eng A,2014,598:236
[11]. Kuo C M, Yang Y T, Bor H Y, et al. Aging effects on the microstructure and creep behavior of Inconel 718 superalloy. Mater Sci Eng A, 2009,510-511:289
[12]. Huang H. Analysis of High and Low Cycle Stress Responses of Turbine Blades under the High Pressure in the Aero-engine, Master Thesis, 1-88, 2022
[13]. Peng B. Isogeometric analysis of fluid-structure interaction and shape optimal design of turbine blade, Master Thesis, 1-76, 2021
[14]. Z.Y. Liu, b, W. Zhu. Numerical prediction of thermal insulation performance and stress distribution of thermal barrier coatings coated on a turbine vane. International Journal of Thermal Sciences, 2020, 158: 106552.
[15]. Yang J, Zhang Z, Liu Z C. Thermal Fluid Structure Coupling Analysis Based on an Aeroengine Turbine Blade. Machinery, 2022(10):74-80
[16]. Zhang Z X, Zeng W, Bian X D, Gao G L, Xiao B. Effects of Thermal Barrier Coating on Temperature and Stress of Turbine Rotor Blade. Journal of Propulsion Technology, 2023(5)
[17]. Liu H S, Ma H, Parameterization of Modeling the Aero-turbine Blade Based on CATIA. Ordnance Industry Automation, 2015(04):56-60
[18]. Tang W Z, The numerical simulation of stress field in a turbine blade with TBCs based on fluid-solid coupling method, Master Thesis, 1-63, 2015
[19]. Academic Committee of the Superalloys, CSM. China Superalloy Handbook (first edition), Cast Superalloys. Beijing: China Quality Inspection Press, 2012
[20]. Liu Z Y, Zhu W, Yang L, et al. Numerical Prediction of Thermal Insulation Performance and Stress Distribution of Thermal Barrier Coatings Coated on a Turbine Vane. International Journal of Thermal Sciences, 2020, 158: 106552.
[21]. Siegel R, Spuckler C M. Analysis of Thermal Radiation Effects on Temperatures in Turbine Engine Thermal Barrier Coatings. Materials Science and Engineering A, 1998, 245 (2): 150-159.