


1. Introduction
The 2020 Chinese government report emphasized safeguarding the public’s access to housing. Real estate is one of the motivations for developing economics due to its status as a pillar industry. Based on the real estate revolution background, housing prices have experienced rapid growth [1]. Between 2003 and 2013, there was a significant rise of around 13% in housing prices in China’s first-tier cities, while second and third-tier cities saw growth rates of 10.5% and 7.9%. These surpassed those in the US and Japanese real estate bubbles [2]. Meanwhile, some foreign researchers found that there was also a considerable increase in the housing prices in their country [3]. Simultaneously, there are many problems with the increasing housing prices. For instance, most youth cannot afford to buy a house, even an apartment. The issue of high housing prices and low income has become a challenge in urbanization worldwide and has attracted close attention from society, government, and academia [4]. Therefore, this essay aims to gain insights into the housing market dynamics and try to aid buyers, sellers, and real estate professionals in making informed decisions using the dataset found in Kaggle.
In addressing the issue of rapidly rising housing prices, it is significant to understand the real estate market scientifically and implement relevant policies to ensure stable development of housing prices. Understanding the factors that influence house prices and their relationships is essential. The reasons behind the rise in housing prices are intricate. When studying the factors that affect the price of residential properties, researchers typically consider a range of variables. These may include location characteristics, building attributes, and the overall residential environment. Researchers may also examine social, economic, and policy factors in more detailed studies in different circumstances. The goal is to understand better the factors contributing to differences in residential property prices [5]. Other Chinese scholars have extensively researched the influencing factors of housing prices. They have identified regional gross domestic product, residents’ consumption levels [6], credit scale, and population structure as the main factors influencing changes in housing prices [7]. Although scholars have made significant findings, there are still numerous unexplored factors. In this essay, I will discuss the impact on housing prices based on the characteristics of the houses. They are carpet area, floor, transaction, furnishing, facing, overlooking, the number of bathrooms, the number of balconies, car parking, and ownership.
In addressing the issue of rapidly rising housing prices, it is significant to understand the real estate market scientifically and implement relevant policies to ensure stable development of housing prices. Understanding the factors that influence house prices and their relationships is essential. The reasons behind the rise in housing prices are intricate. When studying the factors that affect the price of residential properties, researchers typically consider a range of variables. These may include location characteristics, building attributes, and the overall residential environment. Researchers may also examine social, economic, and policy factors in more detailed studies in different circumstances. The goal is to understand better the factors contributing to differences in residential property prices [5]. Other Chinese scholars have extensively researched the influencing factors of housing prices. They have identified regional gross domestic product, residents’ consumption levels [6], credit scale, and population structure as the main factors influencing changes in housing prices [7]. Although scholars have made significant findings, there are still numerous unexplored factors. In this essay, I will discuss the impact on housing prices based on the characteristics of the houses. They are carpet area, floor, transaction, furnishing, facing, overlooking, the number of bathrooms, the number of balconies, car parking, and ownership.
The Hedonic Price Model is a commonly used approach when researching residential properties. This model is based on Lancaster’s consumer theory and Rosen’s characteristic price theory. It treats the transaction price of residential properties as the dependent variable and conducts regression analysis with a set of typical variables. From an economic perspective, it allows for estimating the implicit prices of residential properties [5]. This paper can utilize the methods of our predecessors by extracting their essence and discarding any drawbacks to optimize our own research methods. Sun and Zhang wrote an essay discussing the relationship between global prices, economic increase, and loan interest rates. They thoroughly considered the situations of nine countries. However, they didn’t clearly show the dataset and had a limited explanation of the outcomes, which gives me an idea that this paper can show the datasets that help it get across more quickly and explain more [8]. The research done by scholars Ma and Kong has a very innovative perspective in that they chose population aging as one of the independent variables [9]. The research done by Guo et al. studies factors similar to what this essay will show. However, it mainly discusses the data for second-hand houses [10]. To some extent, choosing the condition of resale or new property as a factor will be better. This essay will use multiple linear regression and some prediction methods to study the relationships between housing prices and the factors and try to give some suggestions to real estate companies and house buyers.
In summary, based on the experience learned from the predecessors, this paper uses a multiple linear regression model to study 10 factors and tell whether they are the factors that contribute to the change in housing prices.
2. Methods
2.1. Data sources
The literature’s data was sourced from Kaggle and compiled by JUHI BHOJANI from Magic Bricks’ online platform. The dataset was last updated in August 2023 and consists of 21 columns and 187531 rows. This paper utilizes 910 rows for analysis.
2.2. Variable selection
The data used in this paper count a total of 910 cases, including the house prices from 780 thousand rupees to 18200 thousand rupees. The data contains 11 variables: Amount (in rupees), Carpet area, Floor, Total floors, Transaction, Furnishing, Facing, Bathrooms, Balconies, Car parking, and Ownership.
Table 1 shows the interpretation of each variable. Because some variables are presented in text form, and it is difficult for us to study, this essay changes the text form into numbers, and the corresponding numbers are shown in Table 1.
Table 1. Logogram and interpretation of the 11 factors.
Elements | Logogram | Interpretation |
Carpet area | \( {x_{1}} \) | The area that can be used. Unit: square feet |
Floor | \( {x_{2}} \) | The floor the home is in |
Total floors | \( {x_{3}} \) | The total floor of the building that the home is in |
Transaction | \( {x_{4}} \) | Whether the home is “Resale” or “New property”. “Resale” takes 0, “New property” takes 1 |
Furnishing | \( {x_{5}} \) | The condition of furnishing. “Unfurnished” take 0; “Semi-furnished” takes 1; “Furnished” takes 2 |
Facing | \( {x_{6}} \) | “East” takes 0; “West” takes 1; “North” takes 2; “South” takes 3; “South - West” takes 4; “North - East” takes 5; “North - West” takes 6; “South - East” takes 7 |
Bathrooms | \( {x_{7}} \) | The number of bathrooms |
Balconies | \( {x_{8}} \) | The number of balconies |
Car parking | \( {x_{9}} \) | “1 Open” takes 0; “1 Covered” takes 1; “2 Open” takes 2; “2 Covered” takes 3 |
Ownership | \( {x_{10}} \) | “Freehold” takes 0; “Co-operative Society” takes 1; “Power Of Attorney” takes 2; “Leasehold” takes 3 |
Amount | \( y \) | The total price of the home |
Table 2 shows some statistics about the variables, including the mean, the variance, the maximum, and the minimum.
Table 2. Summary statistics of each variable.
Elements | Logogram | mean | variance | maximum | minimum |
Carpet area | \( {x_{1}} \) | 1098.18 | 1284995.59 | 1820 | 78 |
Floor | \( {x_{2}} \) | 8.09 | 32.51 | 18 | 1 |
Total floors | \( {x_{3}} \) | 14.69 | 67.68 | 38 | 1 |
Transaction | \( {x_{4}} \) | 0.25 | 0.19 | - | - |
Furnishing | \( {x_{5}} \) | 0.61 | 0.59 | - | - |
Facing | \( {x_{6}} \) | 0.65 | 2.27 | - | - |
Bathrooms | \( {x_{7}} \) | 2.81 | 1.07 | 4 | 1 |
Balconies | \( {x_{8}} \) | 1.44 | 0.55 | 3 | 1 |
Car parking | \( {x_{9}} \) | 1.44 | 1.18 | - | - |
Ownership | \( {x_{10}} \) | 0.32 | 0.69 | - | - |
Amount | \( y \) | 1493.58 | 1202749.26 | 4250 | 219 |
Note: The maximum (minimum) doesn’t have meaning when it comes to transactions, furnishing, facing, car parking, and ownership.
2.3. Research protocol
This paper uses the Linear Regression model and Single Factor Correlation Analysis, the total amount of the home is the dependent variable(Y), and the 10 factors are the independent variables(X). Next, this paper uses SPSSAU to analyze the relationship between the effect of X on Y based on the results of scatter plots, box plots and multiple linear regression.
2.4. Model principle
Linear regression is a standard statistical learning method to establish a linear relationship between the independent and dependent variables. Here is the typical formula for linear regression:
\( y=β0+β1 x1+β2 x2+…+βp xp+ε\ \ \ (1) \)
Where β is the coefficient, ε is the residuals and the expectation for ε is 0.
This paper uses scatter plots to directly see the relationship between two distinct variables.
3. Results and Discussion
Figure 1 shows that it has an increasing trend, leading us to use a linear regression model. The result is \( y = 955.730 + 0.490*x1 \) , and the R square is 0.256. Because the R square is very close to 0, the dataset should delete the outliers to keep the R square close to 1.
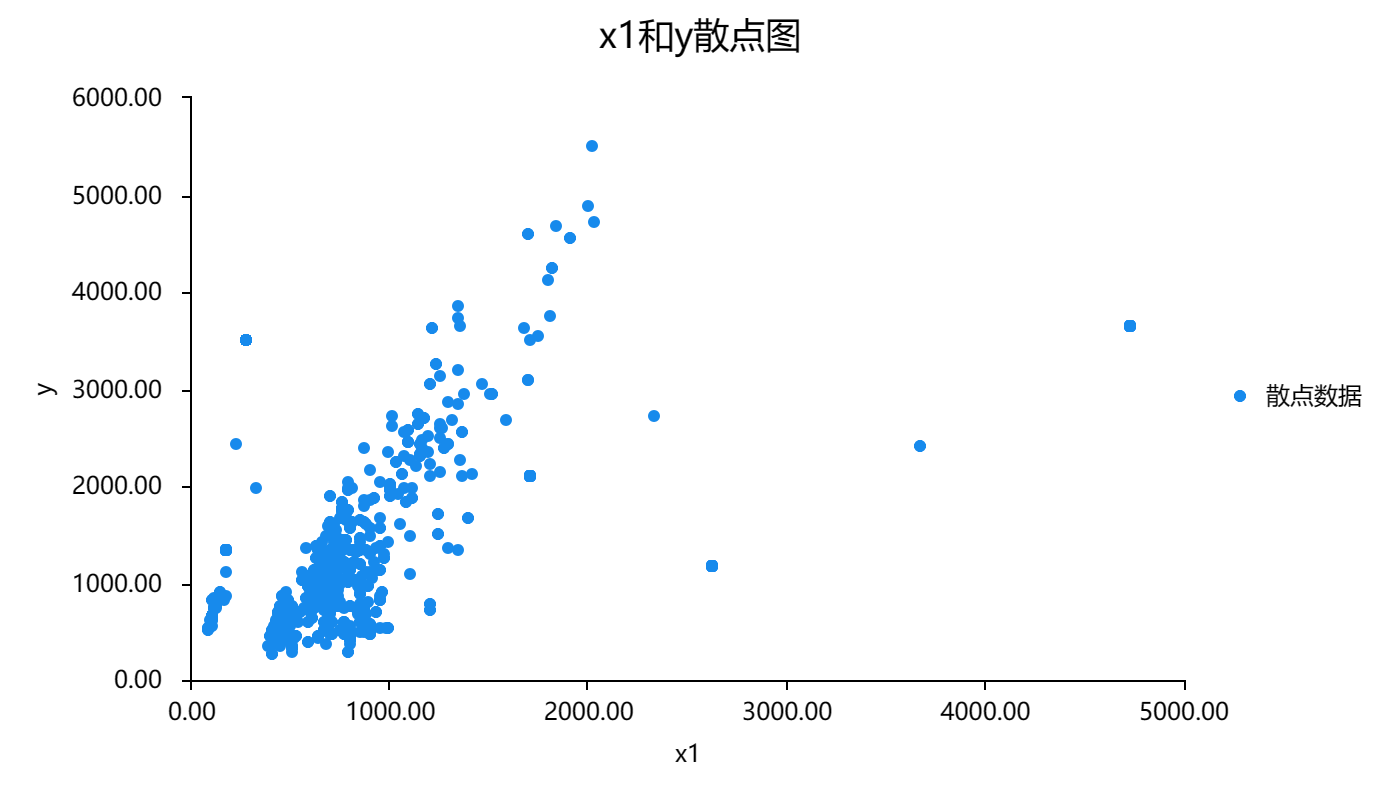
Figure 1. The scatter plot of carpet area and the amount.
As shown in figure 2, after deleting all the outliers, the data seems more linear. However, the results show that the regression model becomes \( y = -301.308 + 1.705*x1 \) , and R square becomes 0.476, still not very close to 1.
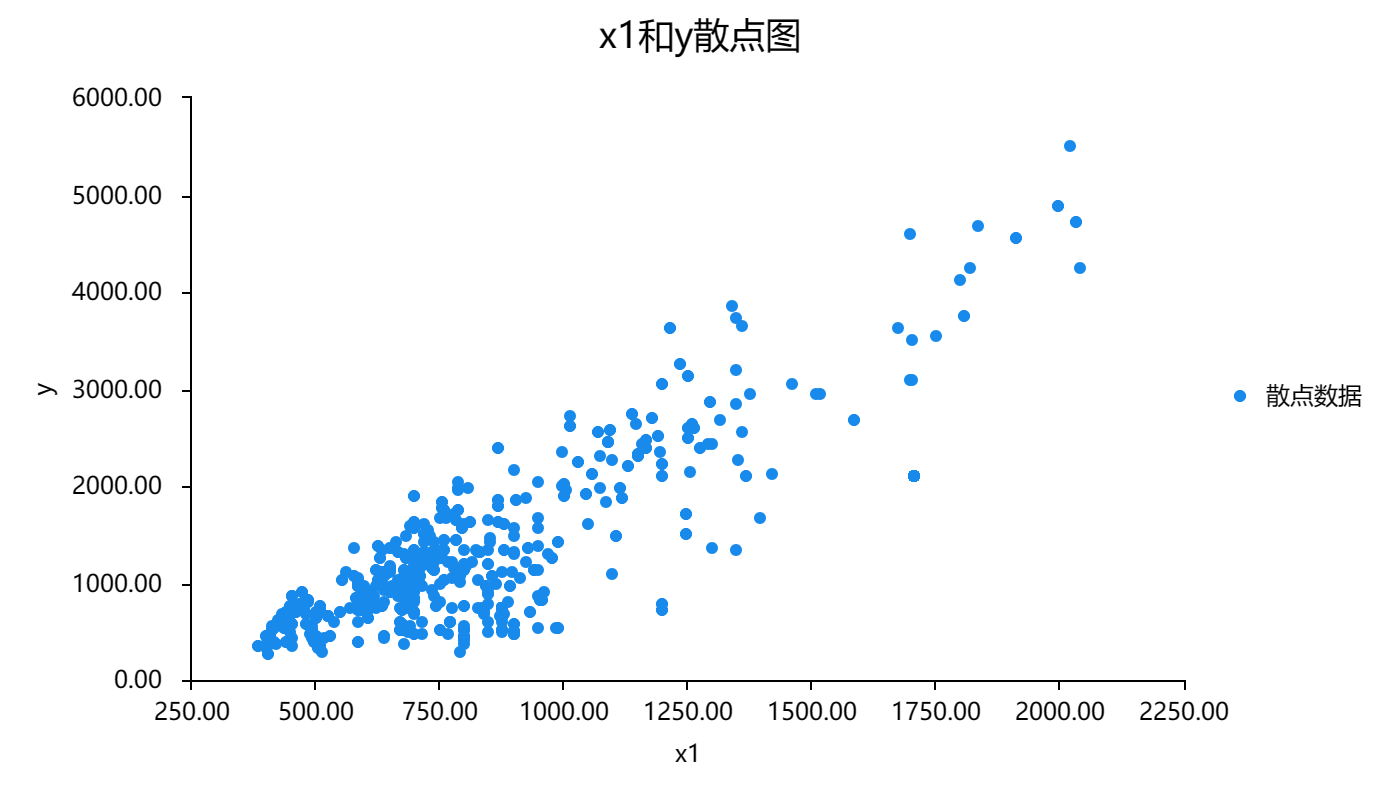
Figure 2. Processed figure 1.
In Figure 3, because of the transformation from text into number, it shows three sets of data. In the box plot, the bottom line means the minimum, the top line means the maximum, the middle line means the mean, and the box contains half the data. The circles beyond the line are the outliers, which means they are bigger than Q3+1.5IQR (Q3 means the 75th percentile, and IQR equals to the 75th percentile minus the 25th percentile) or smaller than Q1-1.5IQR (Q1 represents the 25th percentile). Figure 2 presents the data in 1.0 is the most divergent, and it not only has the narrowest middle 50% but also has the most outliers. To some extent, the box plot shows that the trend from high prices to low prices in Furnishing is “Furnished”, “Unfurnished”, and “Semi-furnished”.
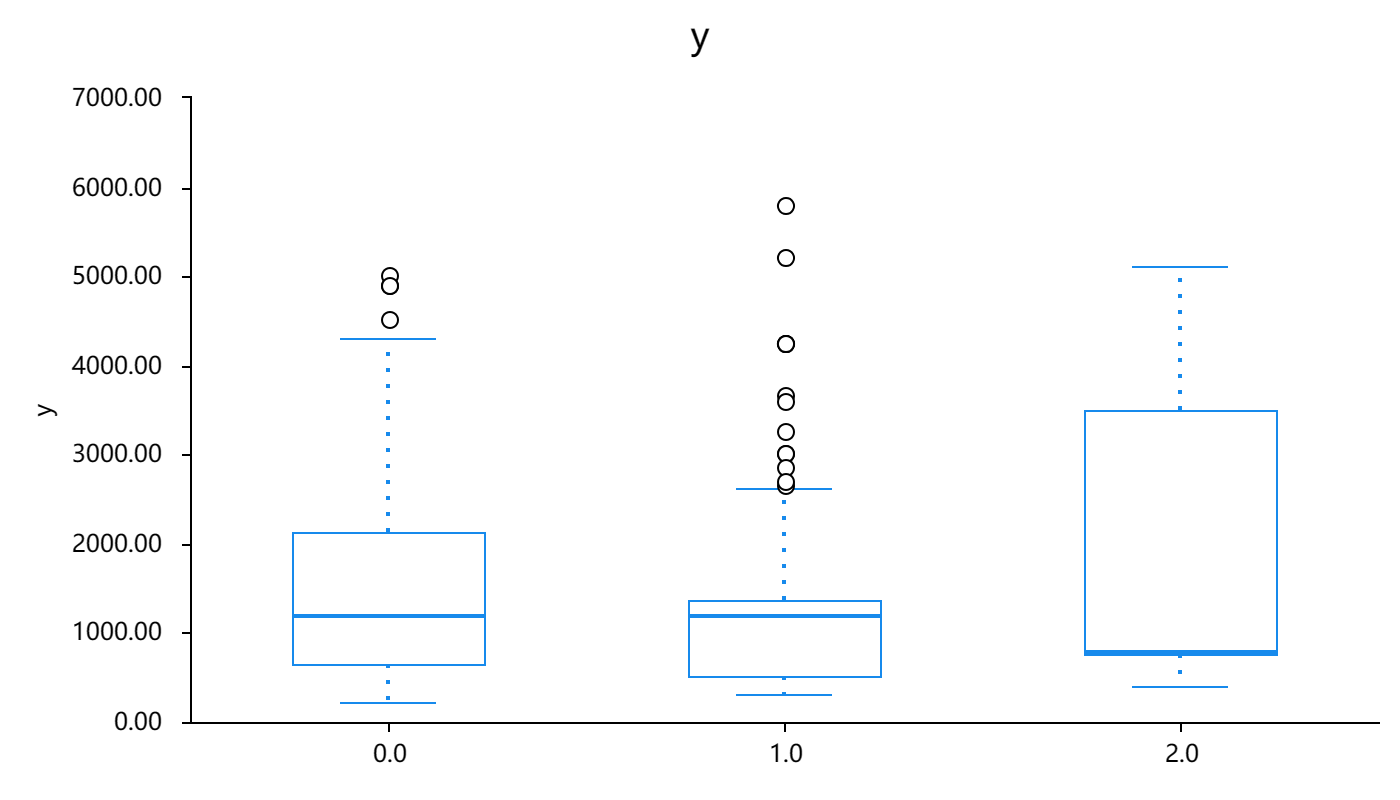
Figure 3. The box plot of furnishing and the amount.
Figure 4 displays the research incorporating several factors that could be linked to housing prices into the model. These factors include Facing, Bathrooms, Balconies, Car parking, Ownership, Carpet area, Floor, Total floor, Transaction, and Furnishing. The study then produced a final result equation after conducting calculations:
\( y=-1347.290+0.085x1+17.030x2+…+403.357x9+73.178x10\ \ \ (2) \)
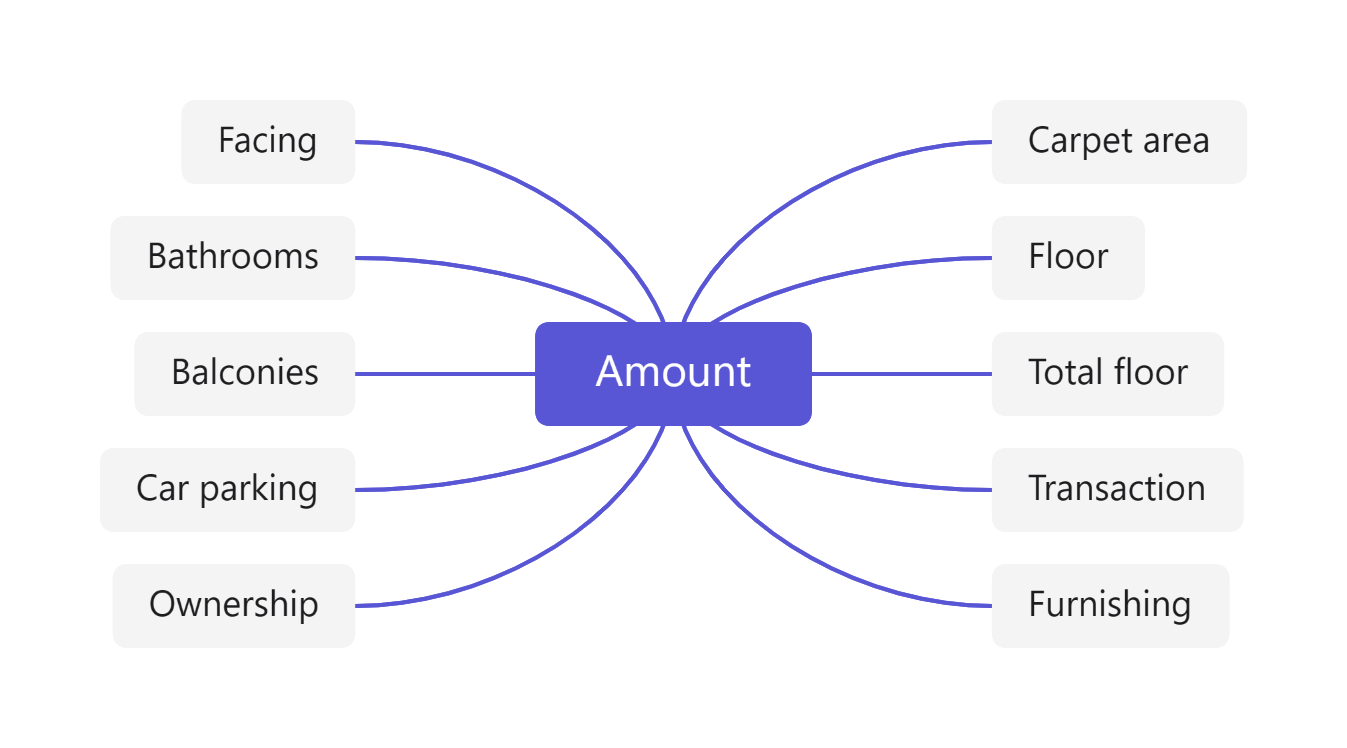
Figure 4. The ten influencing Factors of Amount.
Table 3 shows that the model infers factors associated with the total amount of the housing price by examining whether the p-values are below 0.05. All the p-values in the table are below 0.05, showing that all the factors have relatively strong affection on the amount. Moreover, the p-values of Carpet area, Floor, Total floor, Transaction, Furnishing, Bathrooms, Balconies, Car parking, and Ownership are smaller than 0.01, which illustrates these variables have significantly strong relationship with the Amount. When it comes to the collinearity diagnosis, the values of tolerance of Carpet area, Floor, Total floor, Transaction, Furnishing, Facing, Bathrooms, Balconies, Car parking, and Ownership all are greater than 0.02. The outcomes show no autocorrelation in the model and no correlation between the sample data, indicating that the model is of good quality. Moreover, the D-W value is around 2, which also illustrates that the model doesn’t have autocorrelation or correlation between the sample data. The second column shows the coefficients of 10 variables. The coefficients of Carpet area, Floor, Total floor, Furnishing, Facing, Bathrooms, Balconies, Car parking, and Ownership are all bigger than 0, with the result of p-values, which means these variables have significant favourable influence on the amount. The coefficient of Transaction is less than 0, with the consequence of p-value, so this variable has a significant negative impact on the amount, which means that the prices of “Resale” are universally greater than “New property”.
In comparison to prior research, they tend to use specific analysis of a single factor, especially the factors shown in number, which is limited to known possible factors for influencing the housing prices, such as Facing, Transaction, Ownership, Furnishing, and Car parking, the data initially shown in the text form. In contrast, this study covers a wide range of factors, making it more comprehensive and effective in avoiding errors caused by not controlling for a single variable. It also expands ideas for future research on housing prices and helps sellers identify the preferences of potential buyers.
Table 3. A slightly more complex table with a narrow caption.
B | t | p | collinearity diagnosis | ||
VIF | tolerance | ||||
constant | -1347.29 | -14.413 | 0.000** | - | - |
x1 | 0.085 | 3.645 | 0.000** | 2.099 | 0.476 |
x2 | 17.03 | 3.483 | 0.001** | 2.273 | 0.44 |
x3 | 29.62 | 8.702 | 0.000** | 2.304 | 0.434 |
x4 | -314.184 | -6.454 | 0.000** | 1.342 | 0.745 |
x5 | 353.179 | 12.373 | 0.000** | 1.42 | 0.704 |
x6 | 28.751 | 2.18 | 0.029* | 1.169 | 0.855 |
x7 | 431.747 | 11.769 | 0.000** | 4.236 | 0.236 |
x8 | 134.352 | 4.934 | 0.000** | 1.226 | 0.816 |
x9 | 403.357 | 12.619 | 0.000** | 3.57 | 0.28 |
x10 | 73.178 | 3.032 | 0.002** | 1.207 | 0.829 |
R2 | 0.74 | ||||
adjustment R2 | 0.737 | ||||
F | F (10,889)=253.086,p=0.000 | ||||
D-W value | 1.822 | ||||
Dependent: y | |||||
* p<0.05 ** p<0.01 | |||||
4. Conclusion
In this study, various data were analysed to determine the factors that affect housing prices. The results suggest that changes in housing prices are linked to factors such as carpet area, floor, total number of floors, transaction, furnishing, facing direction, number of bathrooms and balconies, availability of parking space, and ownership. Most of the factors studied in this paper have not received much attention in previous studies.
It is true that the model may have errors due to the limited amount of data. Additionally, the sample did not cover all conditions from different countries or discuss policy and economic backgrounds, which could cause possible variations and affect the accuracy of the results. The study still has some advantages. Firstly, the data was from India, and was just released last month, which ensures the uniqueness of our data. Secondly, this essay chooses the data in text form and changes them into number form, which is really innovative. Thirdly, this essay uses more than one method to get the outcomes. It ensures the feasibility of the linear regression model and eliminates errors. At last, we draw a conclusion that the 10 variables all have relationship with the amount of the housing prices, but it is still a preliminary conclusion. Further investigation is needed to determine if these factors are linked to changes in housing prices, and these findings may guide future research. Once other factors that influence housing prices are found, the actions that will be taken to control the prices may come out more quickly and more efficiently.
References
[1]. Xie R, Du Y and Zhu J M 2022 Econometric Analysis of the Factors Influencing Housing Prices in Anhui based on Multiple Regression. Natural Science Journal of Harbin Normal University 38, 36-42.
[2]. Chen G and Lu Y X 2022 Examining the Relationship between Confucian Tradition and Real Estate Price Growth: The Realization of Myriad Spacious Mansions. China Journal of Economics 9, 236-266.
[3]. Ernawati M K, Hasnanywati H and Atasya O2016 Factors Influencing the Housing Price: Developers’ Perspective World Academy of Science Engineering and Technology. International Journal of Humanities and Social Sciences, 10, 1676-1682.
[4]. Wu B R 2009 India Adopts New Measures to Address High Housing Prices. Huadong Technology, 64-65.
[5]. Qin J R, et al. 2021 Analysis of the Influencing Factors of Housing Price in Nanjing. Journal of Geo-information Science, 23, 882-890.
[6]. Liu R G, You J Q and Zhang Y 2022 Analysis of Housing Price Influencing Factors Based on Factor Analysis Method. Inner Mongolia Science Technology & Economy 5, 45-60.
[7]. Cui Z, Zhou M Q and Kong 2022 Lingzhu Research on the Heterogeneity of Factors Affecting Urban Housing Prices in China. Taxation and Economy Serial 245, 65-74.
[8]. Sun L F and Zhang S D 2014 Research on the Relationship between International House Prices, Economic Growth, and Loan Interest Rates Based on GMM Estimation Times. Finance Cumulatively 567, 40-41.
[9]. Ma Y and Kong J 2015 Population aging, Economic Growth, and House Price Fluctuations: Empirical Analysis of International Experience Based on the Model of Generational Overlap. China Academic Journal Electronic Publishing House 15, 237-262.
[10]. Guo Y, Yu H S and Ke J W 2022 Influencing Factors of Second-hand Housing Prices in Yantai City Based on Covariance Regression. Journal of Ludong University (Natural Science Edition) 38, 232-240.
Cite this article
Huang,Y. (2023). The research of influence factors that possibly lead to the change in house prices. Theoretical and Natural Science,14,158-164.
Data availability
The datasets used and/or analyzed during the current study will be available from the authors upon reasonable request.
Disclaimer/Publisher's Note
The statements, opinions and data contained in all publications are solely those of the individual author(s) and contributor(s) and not of EWA Publishing and/or the editor(s). EWA Publishing and/or the editor(s) disclaim responsibility for any injury to people or property resulting from any ideas, methods, instructions or products referred to in the content.
About volume
Volume title: Proceedings of the 3rd International Conference on Computing Innovation and Applied Physics
© 2024 by the author(s). Licensee EWA Publishing, Oxford, UK. This article is an open access article distributed under the terms and
conditions of the Creative Commons Attribution (CC BY) license. Authors who
publish this series agree to the following terms:
1. Authors retain copyright and grant the series right of first publication with the work simultaneously licensed under a Creative Commons
Attribution License that allows others to share the work with an acknowledgment of the work's authorship and initial publication in this
series.
2. Authors are able to enter into separate, additional contractual arrangements for the non-exclusive distribution of the series's published
version of the work (e.g., post it to an institutional repository or publish it in a book), with an acknowledgment of its initial
publication in this series.
3. Authors are permitted and encouraged to post their work online (e.g., in institutional repositories or on their website) prior to and
during the submission process, as it can lead to productive exchanges, as well as earlier and greater citation of published work (See
Open access policy for details).
References
[1]. Xie R, Du Y and Zhu J M 2022 Econometric Analysis of the Factors Influencing Housing Prices in Anhui based on Multiple Regression. Natural Science Journal of Harbin Normal University 38, 36-42.
[2]. Chen G and Lu Y X 2022 Examining the Relationship between Confucian Tradition and Real Estate Price Growth: The Realization of Myriad Spacious Mansions. China Journal of Economics 9, 236-266.
[3]. Ernawati M K, Hasnanywati H and Atasya O2016 Factors Influencing the Housing Price: Developers’ Perspective World Academy of Science Engineering and Technology. International Journal of Humanities and Social Sciences, 10, 1676-1682.
[4]. Wu B R 2009 India Adopts New Measures to Address High Housing Prices. Huadong Technology, 64-65.
[5]. Qin J R, et al. 2021 Analysis of the Influencing Factors of Housing Price in Nanjing. Journal of Geo-information Science, 23, 882-890.
[6]. Liu R G, You J Q and Zhang Y 2022 Analysis of Housing Price Influencing Factors Based on Factor Analysis Method. Inner Mongolia Science Technology & Economy 5, 45-60.
[7]. Cui Z, Zhou M Q and Kong 2022 Lingzhu Research on the Heterogeneity of Factors Affecting Urban Housing Prices in China. Taxation and Economy Serial 245, 65-74.
[8]. Sun L F and Zhang S D 2014 Research on the Relationship between International House Prices, Economic Growth, and Loan Interest Rates Based on GMM Estimation Times. Finance Cumulatively 567, 40-41.
[9]. Ma Y and Kong J 2015 Population aging, Economic Growth, and House Price Fluctuations: Empirical Analysis of International Experience Based on the Model of Generational Overlap. China Academic Journal Electronic Publishing House 15, 237-262.
[10]. Guo Y, Yu H S and Ke J W 2022 Influencing Factors of Second-hand Housing Prices in Yantai City Based on Covariance Regression. Journal of Ludong University (Natural Science Edition) 38, 232-240.