


1. Introduction
Now, it is the boom of the rise and development of the era of big data, which has brought about the innovation and progress of information technology, but it has also brought about the generation of a huge mass of data, so the issue of how to store as much data as possible has changed is particularly important. As information technology in hardware is continuously developed and improved, the speed and reserves of collecting information gradually meet people’s needs; what follows is how to optimize the processing and analysis of the large amounts of data generated, and use methods such as data mining. To dig out the useful information, the author needed to form a large amount of data. According to a recent report, more than 80% of the world’s data information has been generated in the last five years, and this evolution has make a contribution to the term big data. But all data will have data characteristics that are indexed over time, which is called time series in the academic circle. For example, regarding the construction and management of smart cities, the author could obtain information about economic levels, traffic conditions, medical management, emergency communications, etc. data, and their analysis needs to consider their evolution over time, for example: data measuring water demand can be used for various purposes such as predicting changes in residential water consumption; predicting abnormal data values.
Today, companies such as Google have developed and released frameworks for processing huge mass of data, such as MapReduce, Hadoop, spark, and more. Among them, the MapReduce technology developed by Google[1], uses an overall framework that divides the input data into chunks and proposes a single solution for each chunk. Next, Yahoo also proposed Hadoop[2], different from MapReduce. The Hadoop architecture proposed by Yahoo is open source. However, the performance of the MapReduce framework and the Hadoop framework in the iterative calculation of data is not satisfactory in terms of processing speed. Therefore, the Spark framework proposed after the improvement and innovation of the University of California, Berkeley, solves this problem well[3]. Like the Hadoop framework, the Spark framework is also based on the Distributed File System (HDFS), which is also an open source project; however, the difference is that Spark allows multiple data tasks in memory to run at the same time, in order to achieve a higher Hadoop which runs data analysis faster. Due to the improvement of the memory processing speed of a large amount of data, Spark has reached the minimum value for the interactive processing of disk data, which has greatly optimized the data processing and analysis speed. Now Spark is the most powerful and well-known in the world as one of the data processing frameworks. In addition, the programming language compatibility of Spark data processing framework structure is also very strong. In addition to the native language of Scala, it also supports widely used programming languages such as Java and python. Therefore, compared with the MapReduce data frame structure and the Hadoop data frame structure, because Spark performs all data analysis and processing in memory, it has greater advantages in processing and analyzing large amounts of data and performing iterative calculations. Compared with Hadoop, the analysis and processing speed is an order of magnitude improvement. Therefore, the new big data time series prediction method proposed in this paper is designed and optimized on the basis of the Spark data frame structure to obtain more ideal time series prediction results. When considering the feasibility of processing and analyzing large amounts of data, the sheer volume of data can be intimidating and questioning its feasibility. At this point, after method screening and a number of existing experimental results, data mining technology may be a feasible way. After consulting relevant literature, data mining has been applied in fact prediction: trying to use it for disease diagnosis [4], laws of nature [5], resident life[6], energy consumption and other fields.
This paper considers that the configuration of Spark in the data set may be difficult to achieve due to the large amount of data, so most of the related research in practice turns to the direction of automatic research optimization[7,8]. In [1-3], a k-weighted nearest neighbor (kWNN) based time series forecasting algorithm developed in the Scala which is a sort of programming language depending on the Apache Spark framework was proposed and used in the real application of the Spanish electricity market for energy demand time series forecasting obtain better results. It is worth mentioning here that the Spark framework has improved the MapReduce released by Google, which is mainly reflected in supporting new applications in the same engine; in addition, there is a unique distributed work operation mode of the Spark framework, which uses Resilient distributed datasets that can perform automatic distributed work. By loading the data set into the elastic distributed data set variable, and then dividing the loaded data set into different blocks in the memory, all operations are completed in the memory partition. This memory processing optimization method makes Spark have a processing and analysis speed that is significantly better than the previous two big data processing frameworks.
In addition, the two major obstacles to shortening the computing time are the performance of transmission and the analysis of data traffic. If these two obstacles can be solved well, the speed of big data processing and analysis can also be greatly improved. A great improvement was made in[9] related research. Although Spark is recognized as one of the best big data processing frameworks in the world, there is still room for optimization and improvement. By reading related materials, it can be seen that most of the intrinsic parameters in the Spark framework are default data, so you can consider optimizing the default configuration of the Spark cluster, such as the optimal solution for the number of partitions, and the best way to allocate the number of cores to improve the Cluster performance, speed up processing and shorten computing time.
In this paper, the optimization method of Spark framework in big data time series prediction is reflected in the kernel density estimation. The algorithm proposed in this paper infers the distribution of the overall data according to limited samples. The result of estimation on the kernel density is the possibility estimation on density function of the sample. In accordance with the estimated probability density function, some properties of the data distribution can be obtained, such as data aggregation. region, and then optimize the default configuration parameters of the Spark cluster. The results obtained in this experiment show that the kernel density estimation algorithm has a certain optimization improvement to the original method of big data time series prediction.
All in all, the highlight of the new method proposed in this paper is that:
1. Based on the Spark big data framework, this paper proposes an optimized big data time series forecasting scheme using Parzen estimation.
2. In this experiment, the electricity data of the past ten years released by the State Grid is substituted into the experiment, and the measurement is carried out once a week, and the time series prediction of the electricity consumption in the last five years is carried out using the experimental method. feasibility.
What is followed by is the structure of this paper: Section 2 describes the relevant research results of Spark-based predicting big data time series, including the advantages of the Spark framework and the development of time series forecasting; Section 3 introduces the optimization of the kernel method proposed in this paper, and the background and specific implementation of the plan. Section 4 uses the optimized algorithm to predict the domestic electricity consumption in the past five years and compare it with the official data to obtain the experimental results. Then, the algorithm optimization scheme of the full text is reviewed and summarized, the experimental conclusions are drawn, and the full text is included.
2. Related work and background on big data time series prediction with Spark
In this part, the article discusses the related research progress and development background of the actual prediction of big data based on the Spark framework. The former part mainly expounds the related work of time series prediction; the latter part discusses the development background of Spark framework and Parzen estimation.
2.1. Relate work on time series prediction
To trace the beginning of a time series, the source of the idea is the annual forecast of sunspot numbers, as described by Yule in[10], he first proposed that the prediction of the next time series is derived from the weighted operation result of the previous observations, which is the time series prediction method rudiments of thought.
In the academic field of predicting time series , the most common are classical methods and methods based on data mining. However, considering the actual situation and application scenarios, there are many data mining techniques that cannot be applied well into big data scenarios. Therefore, some researchers have developed a new distributed data mining technology for big data, and developed a method for solving typical cases such as classification and regression [11,12].
On the basis of the existing research results, Do and Poulet optimized the existing SVM learning algorithm. The performance of the optimized algorithm has an advantage over the standard SVM algorithm in all aspects [13]. After reading and reviewing the previously published works, the author found that the prediction of big data time series is a new topic that is in line with the current development direction of information technology and has great development prospects, especially for big data time series prediction using distributed transportation structure and based on Spark framework, taking full advantage of Spark. Ventura et al. proposed several achievable and applicable methods based on the Spark framework[14]. After that, some researchers successively introduced kNN-based[15], and deep learning-based big data time series forecasting methods in 2016-2017.
After consulting, it can be seen that time series forecasting has been widely researched in the academic world, but the research on Spark-based big data time series forecasting methods still needs to be further explored and discovered, which shows the theme of this article. necessity.
2.2. Applications and advantages of Spark framework
When the computing frameworkin Spark do some operations on the data, all intermediate data are stored in memory. Because Spark makes full use of memory to compute data, it reduces disk read and write operations and improves the computational efficiency of the framework. Simultaneously, Spark is also compatible with HDFS and Hive, and can be well integrated with the Hadoop system, making up for the performance shortcomings of high latency in MapReduce. It can be concluded that Spark is a faster and more efficient platform in computing big data.
In general, Spark has the following salient features:
2.2.1. Generality. Spark provides a unified solution for batch processing, interactive query (SparkSQL), real-time stream processing (SparkStreaming), machine learning (SparkMLlib), and graph computing (GraphX), which can be seamlessly integrated in the same application. Combined use can greatly reduce the labor cost of development and maintenance in big data and the material expense of deploying the platform.
2.2.2. High speed. According to the official statistics reviewed, compared with Hadoop, Spark’s memory-based computing efficiency is more than 100 times faster, and its hard disk-based computing efficiency is more than 10 times faster. Spark implements an efficient DAG execution engine capable of efficiently processing data streams through in-memory computing.
2.2.3. Ease of use. Spark programming supports Java, Python, Scala and R languages, and also has more than 80 advanced algorithms. In addition, Spark also supports interactive Shell operations. Developers can easily use the Spark cluster to solve problems in the Shell client.
2.2.4. Compatibility. Spark can run on Hadoop model, Mesos model, Standalone model or Cloud, and also have access to various data sources.
In contrast, Spark has many advantages, and it is widely applied into different kinds of fields. For example, it is able to process spatiotemporal air quality data[16]. A parallel air quality prediction system is designed and developed to handle large imbalanced datasets as efficiently as possible In terms of deep learning [17]. An Intrusion Detection System (IDS) with popular intrusion detection strategies was developed and used spark for intrusion detection.
2.3. Development background of Parzen estimation
Kernel Density Estimation (KDE) is a kind of density function used in probability theory to estimate unknown density function. The algorithm proposed in this paper is based on the Spark framework, and uses limited samples to predict the distribution of the overall data. The result of estimation on the kernel density is the probability estimation on density function of the sample. In accordance with the estimated probability density function, the data distribution can be obtained. Some properties, and then make predictions on big data time series.
Intuitively, the kernel density estimation method is a common histogram. From a theoretical point of view, it does not involve the prior knowledge of the data distribution to study the distribution characteristics of the data. This method is visually explained below with a simple two sets of diagrams:
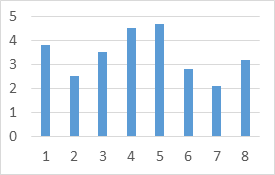
Figure 1. Histogram of randomly generated data.
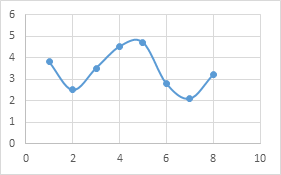
Figure 2: Approximate kernel square distribution of the same set of data.
Through the reasonable selection of kernel function and bandwidth, the author could initially establish the probability density function model of the analyzed big data time series, and then calculate the influencing factors to be considered through the weighted calculation of algorithm design, and the established model can be deployed to analyze large data. Data time series forecasting is optimized.
3. Methodlogy
3.1. Background of the method
One of the methods that is extensively applied into the density function estimation is the histogram. The characteristics of the histogram are simple and easy to understand, but the disadvantages lie in the following three aspects: the density function is not smooth; the density function is greatly affected by the width of the sub-interval (that is, each histogram); and if the same original data takes different sub-intervals range, the displayed results may be completely different. The division interval of the two graphs is different by 0.8, but the density function displayed seems to be very different. In addition, the histogram can only display 2-dimensional data at most, and if there are more dimensions, it cannot be effectively displayed.
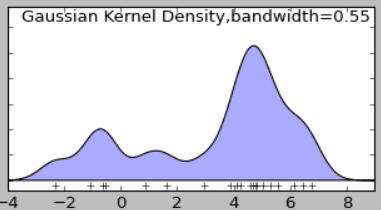
Figure 3: Gaussian kernel density estimation distribution map (smooth kernel).
Although different kernel functions can be used to obtain consistent conclusions (the overall trend and the regularity of density distribution are basically the same), the kernel density function is not perfect. In addition to the selection of the kernel algorithm, the bandwidth also affects the density estimation, and the bandwidth value that is too large or too small will affect the estimation result.
The application scenarios of Parzen estimation are also very wide: risk prediction of stocks, finance, real estate investment, etc. On the basis of univariate kernel density estimation, a prediction model of VaR can be established by kernel density estimation, and different predictive models of VaR can be established by weighting the coefficient of variation of kernel density estimation. The most widely used algorithms in kernel density estimation are Gaussian mixture model and kernel density estimation based on neighbors. Gaussian mixture kernel density estimation models are often used in clustering scenarios.
3.2. Implementation of the method
Obtain the Kernel Probability Density Model.
First, the author obtained the distribution region R configured by the default parameters of the spark cluster. The author took the region R as a small hypercube centered on x, and the purpose of the author’s first step is to determine the probability density. To count the number K of data points falling in this region, the author defined the following rules: k(u) equals to 1 when the absolute value of ui is less than or equal to 0.5 where i = 1, 2, ..., D; Otherwise, k(u) equals to 0.
This rule represents a unit cube centered at the origin, and the function k(u) listed above is an example of a kernel function. From the rule above, if the data point x_n is located in a cube of side length h centered on x, the following conclusions can be drawn:
\( k(\frac{x-{x_{n}}}{h})=1or k(\frac{x-{x_{n}}}{h})=0 \) (1)
It follows that the total number of data points in this cube is
\( K=\sum _{n=1}^{N}k(\frac{x-{x_{n}}}{h}) \) (2)
From the correlation calculation, the probability density estimate at point x can be obtained
\( p(x)=\frac{1}{N}\sum _{n=1}^{N}\frac{1}{{h^{D}}}k(\frac{x-{x_{n}}}{h}) \) (3)
During the derivation process, the formula for the volume of a cube with side length h in D dimension is used :V= \( {h^{D}} \) . Using the symmetry of the function k(u), the author could express this function as N cubes centered on N data points \( {x_{n}} \) .
However, the discontinuity of (3) is often brought about due to human reasons. But if the author adopted a smooth kernel function, then the author could solve this problem and get a smoother model. The most common choice is to use the Gaussian kernel function. Using the Gaussian kernel function, the author would get the following kernel probability density model
\( p(x)=\frac{1}{N}\sum _{n=1}^{N}\frac{1}{{(2π{h^{2}})^{\frac{D}{2}}}}exp{\lbrace -\frac{{‖x-{x_{n}}‖^{2}}}{2{h^{2}}}\rbrace } \) (4)
Where h is the standard deviation of the Gaussian distribution. Therefore, the construction of the probability density model is mainly divided into the following steps: make each data point obey the Gaussian distribution, then add the contribution of each data point in the data set, and divide by N, so that the probability density can be normalized one. Among them, the parameter h plays an important role in the smoothing parameter. If h is small, the model will be too sensitive to noise; if h is large, the curve will be too smooth, so the author’s choice of h also needs to be appropriate and compromised. One of the great advantages of Parzen in comparison is that it eliminates the calculation in the training phase, and only needs to store the training set in the retraining phase.
Substitute the parameter configuration obtained after model optimization back to the original method
At present, there are many models and methods for big data time series prediction based on spark. Among them, the author chose a multi-step prediction algorithm for big data time series based on Spark [8], which uses the Spark framework of the cluster parameter configuration is also generated by default or automatically, so the kernel method proposed in this paper can be used to optimize the default parameters, and then optimize and improve the big data time series prediction method based on the Spark framework[2]. Arrange the time series in every possible window of past values of w before the algorithm starts. In order to obtain all possible groups of h values that can be formed from the original time series, the author grouped the time series according to the rules, which in Spark simply requires the entire time series stored in Spark Resilient Distributed Dataset (RDD) can be completed in one operation.
The author reproduced the Spark-based multi-step prediction algorithm for big data time series with reference to relevant literature, and optimized the default parameters of the Spark cluster through the method proposed in this paper, and obtained the optimized Spark-based big data Time series multi-step forecasting optimization algorithm.
c. The optimized model is used to forecast the national electricity consumption forecast in the last five years, and the evaluation draws a conclusion
4. Conclusion
Based on the Spark framework, this paper uses the kernel method to optimize the default or automatically generated configuration parameters of the Spark cluster. Referring to the Spark-based multi-step prediction and optimization algorithm for big data time series, this method is reproduced and optimized with related algorithm programming. In order to test the optimization results of big data time series through the kernel method proposed in this paper, this paper uses this model to forecast the total electricity consumption in China in the past five years, and compares and evaluates with the real data released by the government. After data analysis, it can be seen that the gap between the results obtained by the optimized Spark big data time series prediction method and the real data is not more than 30%, and the relative error rate is mostly maintained at 10-15%., the average relative error rate is calculated to be 14.2%, which shows that the big data time series prediction algorithm optimized by the default parameters of the Spark cluster after the kernel method has been improved considerably. As we all know, one of the great advantages of Parzen estimation is that it eliminates the calculation in the ‘training’ stage, but in a certain way, this also brings some problems, because the calculation cost of estimating the probability density will vary with the data set. The scale grows linearly. Therefore, in future research, better algorithms can be considered to optimize the default parameters of Spark clusters to cope with larger-scale datasets.
Figure 4. The relative error rate between the time series forecast results and the real data.
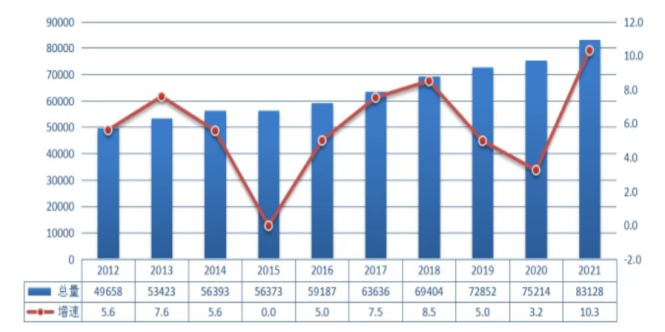
Figure 5. Published data on the total electricity consumption in China in the past ten years.
References
[1]. J. Dean, S. Ghemawat, Mapreduce: simplified data processing on large clusters, Commun. ACM 51 (1) (2008) 107–113.
[2]. T. White, Hadoop, The Definitive Guide, O’ Really Media, 2012.
[3]. M. Hamstra, H. Karau, M. Zaharia, A. Knwinski, P. Wendell, Learning Spark: Lightning-Fast Big Analysis, O’ Really Media, 2015.
[4]. J.C. Riquelme-Santos, R. González-Cámpora, A study of the suitability of auto-encoders for preprocessing data in breast cancer experimentation, J. Biomed. Inform. 72 (2017) 33–44.
[5]. E. Florido, F. Martínez-Álvarez, A. Morales-Esteban, J. Reyes, J. Aznarte-Mellado, Detecting precursory patterns to enhance earthquake prediction in chile, Comput. Geosci. 76 (Supplement C) (2015) 112–120.
[6]. G. Asencio-Cortés, E. Florido, A. Troncoso, F. Martínez-Álvarez, A novel metho-dology to predict urban traffic congestion with ensemble learning, Soft. Comput. 20(11) (2016) 4205–4216.
[7]. A. M. Fernández, J.F. Torres, A. Troncoso, F. Martínez-Álvarez, Automated spark clusters deployment for big data with standalone applications integration, Lect. Notes Artif. Intell. 9868 (2016) 150–159.
[8]. R. Talavera-Llames,R. Pérez-Chacón,A. Troncoso,F. Martínez-Álvarez. Big data time series forecasting based on nearest neighbours distributed computing with Spark[J]. Knowledge-Based Systems,2018,161.
[9]. N. Hamid, V. Chang, R.J. Walters, G.B. Wills, A multi-core architecture for a hybrid information system, Comput. Electr. Eng. (2017)
[10]. G. U. Yule, On a method of investigating periodicities in disturbed series, with special reference to wolfer’s sunspot numbers, Philos. Trans. R. Soc. Lond. Ser. A Math. Phys. Eng. Sci. (1927).
[11]. C. W. Tsai, C.F. Lai, H.C. Chao, A. Vasilakos, Big data analytics: a survey, J. Big Data 2 (1) (2015) 21.
[12]. L. Zhou, S. Pan, J. Wang, A.V. Vasilakos, Machine learning on big data: opportunities and challenges, Neurocomputing 237 (2017) 350–361.
[13]. T. Do, F. Poulet, Random local SVMs for classifying large datasets, in: Proceedings of the International Conference on Future Data and Security Engineering, 2015, pp. 3–15.
[14]. J. González-López, S. Ventura, A. Cano, Distributed nearest neighbor classification for large-scale multi-label data on spark, Future Gener. Comput. Syst. 87 (2018) 66–82.
[15]. R. Talavera-Llames, R. Pérez-Chacón, M. Martínez-Ballesteros, A. Troncoso, F. Martínez-Álvarez, A nearest neighbours-based algorithm for big time series data forecasting, in: Proceedings of the International Conference on Hybrid Artificial Intelligence Systems, 2016, pp. 174–185.
[16]. Asgari Marjan,Yang Wanhong,Farnaghi Mahdi. Spatiotemporal data partitioning for distributed random forest algorithm: Air quality prediction using imbalanced big spatiotemporal data on spark distributed framework[J]. Environmental Technology & Innovation,2022,27.
[17]. Ramkuma M.P,Reddy P.V. Bhaskar, Thirukrishna J.T., Vidyadhari Ch.. Intrusion detection in big data using hybrid feature fusion and optimization enabled deep learning based on spark architecture[J].Computers & Security,2022(prepublish).
Cite this article
Liu,H. (2023). An optimization in big data time series prediction method by Parzen estimation with Spark. Theoretical and Natural Science,18,10-18.
Data availability
The datasets used and/or analyzed during the current study will be available from the authors upon reasonable request.
Disclaimer/Publisher's Note
The statements, opinions and data contained in all publications are solely those of the individual author(s) and contributor(s) and not of EWA Publishing and/or the editor(s). EWA Publishing and/or the editor(s) disclaim responsibility for any injury to people or property resulting from any ideas, methods, instructions or products referred to in the content.
About volume
Volume title: Proceedings of the 2nd International Conference on Computing Innovation and Applied Physics
© 2024 by the author(s). Licensee EWA Publishing, Oxford, UK. This article is an open access article distributed under the terms and
conditions of the Creative Commons Attribution (CC BY) license. Authors who
publish this series agree to the following terms:
1. Authors retain copyright and grant the series right of first publication with the work simultaneously licensed under a Creative Commons
Attribution License that allows others to share the work with an acknowledgment of the work's authorship and initial publication in this
series.
2. Authors are able to enter into separate, additional contractual arrangements for the non-exclusive distribution of the series's published
version of the work (e.g., post it to an institutional repository or publish it in a book), with an acknowledgment of its initial
publication in this series.
3. Authors are permitted and encouraged to post their work online (e.g., in institutional repositories or on their website) prior to and
during the submission process, as it can lead to productive exchanges, as well as earlier and greater citation of published work (See
Open access policy for details).
References
[1]. J. Dean, S. Ghemawat, Mapreduce: simplified data processing on large clusters, Commun. ACM 51 (1) (2008) 107–113.
[2]. T. White, Hadoop, The Definitive Guide, O’ Really Media, 2012.
[3]. M. Hamstra, H. Karau, M. Zaharia, A. Knwinski, P. Wendell, Learning Spark: Lightning-Fast Big Analysis, O’ Really Media, 2015.
[4]. J.C. Riquelme-Santos, R. González-Cámpora, A study of the suitability of auto-encoders for preprocessing data in breast cancer experimentation, J. Biomed. Inform. 72 (2017) 33–44.
[5]. E. Florido, F. Martínez-Álvarez, A. Morales-Esteban, J. Reyes, J. Aznarte-Mellado, Detecting precursory patterns to enhance earthquake prediction in chile, Comput. Geosci. 76 (Supplement C) (2015) 112–120.
[6]. G. Asencio-Cortés, E. Florido, A. Troncoso, F. Martínez-Álvarez, A novel metho-dology to predict urban traffic congestion with ensemble learning, Soft. Comput. 20(11) (2016) 4205–4216.
[7]. A. M. Fernández, J.F. Torres, A. Troncoso, F. Martínez-Álvarez, Automated spark clusters deployment for big data with standalone applications integration, Lect. Notes Artif. Intell. 9868 (2016) 150–159.
[8]. R. Talavera-Llames,R. Pérez-Chacón,A. Troncoso,F. Martínez-Álvarez. Big data time series forecasting based on nearest neighbours distributed computing with Spark[J]. Knowledge-Based Systems,2018,161.
[9]. N. Hamid, V. Chang, R.J. Walters, G.B. Wills, A multi-core architecture for a hybrid information system, Comput. Electr. Eng. (2017)
[10]. G. U. Yule, On a method of investigating periodicities in disturbed series, with special reference to wolfer’s sunspot numbers, Philos. Trans. R. Soc. Lond. Ser. A Math. Phys. Eng. Sci. (1927).
[11]. C. W. Tsai, C.F. Lai, H.C. Chao, A. Vasilakos, Big data analytics: a survey, J. Big Data 2 (1) (2015) 21.
[12]. L. Zhou, S. Pan, J. Wang, A.V. Vasilakos, Machine learning on big data: opportunities and challenges, Neurocomputing 237 (2017) 350–361.
[13]. T. Do, F. Poulet, Random local SVMs for classifying large datasets, in: Proceedings of the International Conference on Future Data and Security Engineering, 2015, pp. 3–15.
[14]. J. González-López, S. Ventura, A. Cano, Distributed nearest neighbor classification for large-scale multi-label data on spark, Future Gener. Comput. Syst. 87 (2018) 66–82.
[15]. R. Talavera-Llames, R. Pérez-Chacón, M. Martínez-Ballesteros, A. Troncoso, F. Martínez-Álvarez, A nearest neighbours-based algorithm for big time series data forecasting, in: Proceedings of the International Conference on Hybrid Artificial Intelligence Systems, 2016, pp. 174–185.
[16]. Asgari Marjan,Yang Wanhong,Farnaghi Mahdi. Spatiotemporal data partitioning for distributed random forest algorithm: Air quality prediction using imbalanced big spatiotemporal data on spark distributed framework[J]. Environmental Technology & Innovation,2022,27.
[17]. Ramkuma M.P,Reddy P.V. Bhaskar, Thirukrishna J.T., Vidyadhari Ch.. Intrusion detection in big data using hybrid feature fusion and optimization enabled deep learning based on spark architecture[J].Computers & Security,2022(prepublish).