


1. Introduction
Since the birth of containers in the 19th century, bulk cargo transportation has been gradually replaced by container transportation. In recent years, with the growth of global trade, more and more container goods are traded by sea. With increasing trade needs for containers, some ports transformed into automated container ports because of the potential benefits, such as more efficient operation from information and communication technologies, saving energy and closer to sustainable development [1]. The automated port, which uses automated equipment, such as autonomous guided vehicles (AGVs)[2], linear motor transport systems (LMCS), overhead grid-track systems (G.R.), and high-level automated storage and retrieval structures (AS/RS), is proved to be less risky and more efficient[3].
Although the benefits of automated port, including technical efficiency, high automation and lower labour intensity, have been recognized by scholars and the industry, port operators, managers, and related parties still have concerns about the investment return, operation efficiency and the related workers' welfare. Salsas [4] show that the introduction of automation will increase the cost of building a port and that port managers need to look at other sources of revenue to balance port expenses. Similarly, Xiang and Liu [5] pointed out that port managers need to pay attention to the economic benefits of the port, while the construction of automated terminals will cost a lot of money. In addition, the conflict of interests between port users and operators contributed to different views on automatic port construction in the past years. For port managers, their goal is how to use less cost to get more port revenue [1]. For port users, they concern more on the level of handling efficiency[5]. In recent years, with high competition among ports and terminals, the service efficiency has also become the port operators' concern. Therefore, it is vital for port operators and managers to consider the efficiency of automated port from both economic and service perspectives.
Previous scholars have done a lot of related research on the automatic terminal, efficiency analysis and automatic equipment application in ports. In terms of the research on automated ports, most studies focus on the design and scheduling of automated ports. Li [6] analysed and designed the layout of the automated terminal to help the port achieve higher efficiency. Lu and Wang [7] designed a Particle Swarm Optimization Algorithm (PSO) based on the Graph theory model to improve the scheduling problem of port automation equipment. Although these studies have covered the design of automated terminals and the scheduling of automated equipment, few studies have considered the impact of automated equipment efficiency on port throughput and operation. In terms of port efficiency analysis, Nikola [8] used the data envelopment analysis (DEA) method to evaluate the operational efficiency of 50 ports in Association of Southeast Asian Nations(ASEAN)countries and found that only two ports were efficient, while all ports in Vietnam were considered inefficient. Thi [9] evaluated ten major ports in southern Vietnam during the same period by the DEA method. From the review, it has been found that most of the previous studies focus on traditional ports without considering the impact of automation equipment application on port efficiency.
To fulfill this gap, this paper evaluated 20 global ports' efficiency with the consideration of automated equipment applications in ports. Firstly, based on the input data and output data of ports, we use DEA-CCR, DEA-BCC and Super-efficiency models to evaluate the efficiency of 20 ports. Adding the number of AGV in inputs, the automated ports and non-automated ports can be divided and compared in efficiency analysis. Then, using the simulation data, we further calculate the efficiency score of each port so as to determine the optimal number of AGVs. Based on DEA-CCR, DEA-BCC and Super-efficiency method, the 20 port efficiency scores are obtained. The DEA-CCR and DEA-BCC results suggest that half of these 20 ports are already efficient. Among them, Ningbo port, Osaka port, and Hamburg port are the most efficient as they obtained the highest scores in super-efficiency analysis. Then, the efficiency scores of the simulation data indicate that some ports can enhance their efficiency by adjusting the application number of AGV.
Interestingly, this paper found that for automated ports, both the decrease of AGV and the increase of AGV can improve the efficiency score of the port. The reason is that when the port increases the number of AGVs, the port cost will increase and port profit will decline. But, increasing the number of AGVs can also improve the handling efficiency of ports. This result indicates that the current automated port can enhance its efficiency in two opposite ways. One is reducing the inputs and improving the profit of the port by reducing the number of AGVs. The other is to improve the service level of the port by increasing the application of AGVs.
The remainder of this paper is organized as follows. Section 2 provides a review of previous relevant literature. Section 3 briefly describes the DEA method and data used in this study. Section 4 reports the efficiency analysis of ports. Section 5 summarizes the finding of this paper and puts forward further research opportunities.
2. Literature review
The automated ports and AGV application have been analysed by extensive literature. This paper focuses on the application of AGV in automated ports and the analysis the impact of it on port efficiency through the DEA method. Therefore, this section reviews the related research on automated ports, AGV vehicles, and the application of the DEA method in port efficiency analysis.
2.1. The automated port
For the definition of automated ports, previous studies consider them as the ports with automated equipment such as automated vehicles and automated cranes[10]. With this definition, the automation equipment becomes the key point to the automated ports. Autonomous guided vehicles (AGVs), linear motor transport systems (LMCS), overhead grid-track systems (G.R.), and high-level automated storage and retrieval structures (AS/RS) have been proved as effective equipment that can reduce costs and greatly improve the efficiency of port [11].
With the growth of international trade and the development of technology, it has been proved that automated terminals can reduce the number of workers by at least 45% and operating expenses by 25%-55%, thereby improving terminal productivity by 10%-35% [12]. Besides, the automated port with advanced equipment has been proved with the benefits on environment, promising advancements in battery and fuel cell zero emissions cargo handling equipment technologies can lead to cleaner and more competitive ports and safer, higher-paying jobs for port labourers worldwide [13]. Therefore, it can be said that compared with traditional ports, automated ports can improve efficiency, reduce costs, protect the environment and improve safety[14]. However, some studies also pointed out that the automated ports need a large amount of investment and may increase the risk of the port[15]. For example, the total investment in Phase IV of the Shanghai Yangshan port is more than 1.8 billion dollars[5]. Such a huge amount of investment becomes the critical point for port developers and operators to make decisions in port construction.
2.2. AGV application in port
Among the automation equipment in the automated port, AGV is one of the most important transportation vehicles, which can transport containers between the Q.C. on the quayside and the ASC on the yard side with automatic guiding devices [16].
AGVs are equipped with automatic guiding devices that can walk along a preset guidance path to complete a series of horizontal transport operations. In recent years, the internal trucks once common in container terminals have been mainly replaced by AGVs[17]. In the automated ports, the AGV can automatically transport goods from the starting point to the destination in two steps. First, AGV will transport the unloading containers from Quay Crane (Q.C.)to the yard after the ship arrives at the harbour and the containers are allocated. Then, the yard crane will stack the containers from AGV to the appropriate container area until all containers on the ship have been unloaded [18].
It has been proved that AGV is advantaged at unmanned, high degree of automation and high level of intelligence, which can greatly improves transportation efficiency[12]. However, the AGV is also limited in operating range and long charging time[19]. Besides, the application of AGV in ports also faced the safety and efficiency of AGV systems cannot be guaranteed when road resources are limited[12]. In addition, the application of AGV needs relevant supported ground, which also brings a vast amount of capital for ports[18]. Therefore, there is still debate on the application of AGVs in ports. And how to optimize the number of AGVs in port to realize certain cargo throughput and profit has become an important issue for port designers and operators[20].
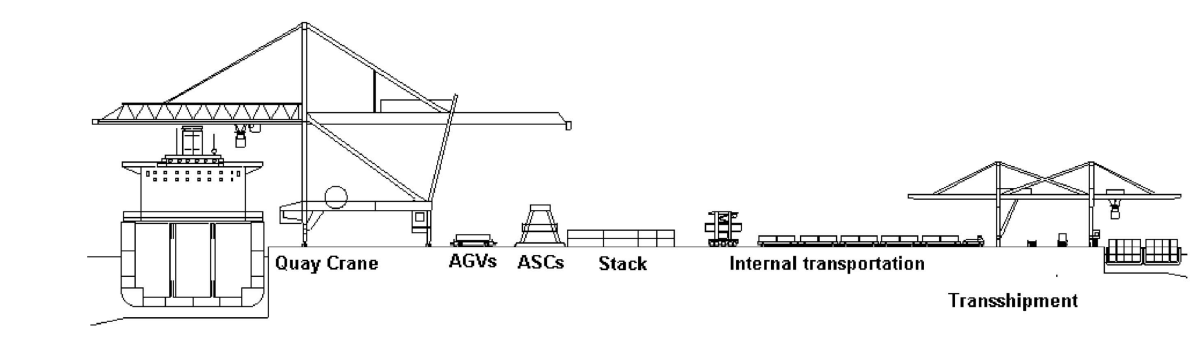
Figure 1. An example of processes at an automated container terminal [18].
2.3. The efficiency analysis of ports
When it comes to port efficiency analysis, Data Envelopment Analysis (DEA), proposed by Charnes and Cooper [21], is a common evaluation method used by scholars. DEA, as a non-parametric analytical technique, is used to evaluate the relative efficiency between a set of units, called the decision-making unit (DMU), within a structure of multiple inputs and outputs [9]. With the application in studies, it has been developed to DEA-BCC, DEA-CCR, DEA-Additive, and other methods. Among them, the DEA-CCR model assumes the constant return to scale and is mainly used to measure technical efficiency. It is suitable for studying efficiency problems with multiple inputs, especially multiple outputs[22]. As the return to scale of technological innovation is not fixed, Charnes, Cooper, and Banker [23] extended the DEA method to the DEA-BCC model, which takes into account that in the case of variable return to scale (VRS). In the DEA-BCC model, when DMU is not operating at the optimal scale, the measure of Technology efficiency (T.E.) will be affected by Scale efficiency (S.E.)[24].
In terms of the application of DEA methods in the port sector, lots of scholars have used them in different ports. For example, Nikola [8] evaluated the operational efficiency of 32 ports in ASEAN countries and identified only two ports as being efficient, with all of Vietnam's ports considered inefficient. Schoyen and Odeck [25] evaluated the efficiency of Norwegian container ports and compared them with some Nordic and U.K. container ports. Besides, Nicole [26] developed the DEA method to analyse and measure port productivity of U.S. ports and found that the ports with railroad service tend to be more efficient than others. Thi [9] used DEA-SBM instead of the DEA-BCC model in port efficiency analysis. It can be found that most studies on port efficiency analysis only focus on the traditional port, without considering the automated development of the port or the costs of automated equipment. With more automated ports being developed, it is necessary to evaluate whether the automated ports are efficient. Thus, the production infrastructure needed by the port, such as bridge cranes, port and shore cranes, AGV, and the number of workers, should be considered in inputs, and the data reflecting port benefits, such as the container throughput, cargo throughput, economic benefits and profit should be considered as outputs [27].
2.4. Summary
It has been recognized by literature that the construction of automated ports has become a significant trend and automated tools such as AGV are also an indispensable part of automated ports. However, most previous studies on automated ports focus on AGV route optimisation and scheduling. Few researchers consider its cost and efficiency impact on the throughput and operation of ports. Besides, in evaluating port efficiency, previous research mainly focused on the traditional ports without considering the application of automated equipment in ports.
Therefore, this study uses the DEA analysis method to evaluate the efficiency of automated ports and compare them with traditional ports to determine the impact of using automated facilities on port operating efficiency.
3. Method and data collection
3.1. Methods
As one of the most popular non-parametric methods, the DEA model is used in analysing the port operating efficiency under the condition of constant and variable returns to scale. Among the DEA models, the CCR model is the one which measures the efficiency based on the assumption that returns to scale remain constant. BCC model allows for variable returns to scale and is graphically represented by a segment linear convex frontier. This paper uses both DEA-CCR and DEA-BCC models to identify port efficiency. Besides, there are two kinds of DEA models. One is the output-oriented model, which maximises the output proportion growth while maintaining the production possibility set. The other one is the input-oriented model, which is always used for port planning and strategies to decide how many resources need to be input into the port. As this study is conducted to analyse the operational efficiencies based on the historical data and determine which production set can achieve the maximum output, the output-oriented model is used.
The output-oriented DEA-CCR and DEA-BCC model can be written as a series of K linear programming envelope problems as the following formulation [21],
\underset{U,λ}{Max} U (1)
s.t.
Uyk \prime -Y \prime λ≤0
X \prime λ-xk \prime ≤0
λ≥0 (CCR)
eλ \prime =1 (BCC)
where  and
and  are the
  input and
  output for a DMU under evaluation;
  is the decision variables which represent the weight DMU would place on DMU in constructing its efficient reference set;
  is applied here as a unit vector.
And the output-oriented technical efficiency measurement of the  DMU is represented by
  , which can be expressed by the following formula:
TEk=\frac{1}{Uk} (2)
Based on the above formulations, it can be found that the traditional DEA-CCR and DEA-BCC model cannot distinguish the most efficient DMUs when they obtain the highest efficiency of 1. In order to overcome this problem, a super-efficiency DEA model, proposed by Banker & Gifford [23], is applied in this study, which can break through the limitation of the maximum efficiency value of 1.
3.2. Data collection
Considering the AGV is mainly applied in the automated ports and some traditional ports are also seeking opportunities to automatic, this study selected 20 ports worldwide with ten automated ports and ten traditional ports. The ports analysed in this paper are summarized in Table 1.
Among these ports, Shanghai Yangshan Phase 4 terminal was fully automated and operated in 2017, which has become one of the largest automated terminals in the world and throughput achieved 22 million TEU in 2021. Also, the Qingdao terminal has been operated since 2008, which is one of the most advanced terminals and is famous for its high handling efficiency of 39.6 moves/hour. Besides, Singapore Port is the largest transhipment port in the Asia-Pacific region and the second busiest port in the world. Singapore Port has built the largest automated terminal since 2013. In addition, the largest ports in Europe, Rotterdam Port, Hamburg Port and Antwerp Port, are at the forefront of automated terminal construction, operating the automated terminal in 1993, 2002 and 2010, respectively. It can be found that the largest and busiest ports are all on the way to automation. And some traditional ports, such as Ningbo Port and Guangzhou Port, are also considering automated construction.
The input and output variables used in this study are selected based on previous literature. In terms of the input variables, the yard area, the number of cranes, the berth length and depth are often used as they determine the resources of the port. Besides, as the intelligent equipment in the port, the number of AGVS can also affect the automated level of the port, which should be considered as the input of the port. In terms of the output variables, most researchers use the container throughput. Port profits are also used as output data, which is a direct reflection of the port's operating performance. Besides, crane handling efficiency has been considered a critical service indicator.
Following the previous studies, this paper uses the berth length, berth depth, yard area and the number of cranes as input variables. And the outputs include container throughput, port profits and crane handling efficiency. Especially considering the automation equipment on the terminal, this paper uses the number of AGVs in the inputs. The summary of the inputs and outputs can be found in Table 2.
Table 2. The statistics of inputs and outputsa.
Variables | Min | Max | Mean |
Berth length (m) | 10460 | 160000 | 35121.3 |
Number of port berth | 60 | 1075 | 263.45 |
Yard area (km2) | 101 | 758 | 362.49 |
number of cranes | 34 | 176 | 73.25 |
number of AGV | 0 | 135 | 32.6 |
Container throughput (Millions TEU) | 246 | 4330.3 | 1406.36 |
Port profits (Million Yuan) | 9.32 | 361.02 | 106.17 |
crane handling efficiency (moves/hour) | 25 | 55 | 35.765 |
a The data is collected from the port website and Global Port Development Report 2019. | |||
4. Results and analysis
4.1. The port efficiency rankings
The efficiency rankings of 20 selected ports are obtained using DEA methods. When the efficiency score of BCC and CCR is 1, the port can be considered efficient; if the efficiency score of BCC and CCR is less than 1, the port is considered inefficient.
Ranked by the efficiency score of DEA-BCC and DEA-CCR, these 20 ports can be divided into three tiers. Qingdao port, Shanghai port, Hamburg port, Virginia port, Singapore port, Barcelona port, Busan port, Ningbo Port, Tianjin Port, Tangshan port and Osaka port are the first tiers as they obtained the efficiency score of 1 in both DEA-BCC and DEA-CCR. These ports can be considered efficient. Rotterdam port, Xiamen port, Qinhuangdao port, and Yingkou port are the second-tier ports as their BCC efficiency scores are 1, but the CCR efficiency scores are less than 1, indicating that these ports are scale efficiency but are less efficient than some ports in the production frontier. Antwerp port, Dalian port, Guangzhou port, Lianyungang port and Suzhou port are the third-tier ports as both their BCC and CCR efficiency scores are less than 1, indicating the operation efficiency of these ports is relatively low. These ports should consider adjusting their inputs or improving the outputs to achieve higher port efficiency.
From the results, it can also be found that some ports can obtain an efficiency score of 1 in both DEA-BCC and CCR analysis. When economies of scale are taken into account, the BCC score is slightly higher than the CCR score, such as those of Antwerp port, Dalian port, and Guangzhou port. In addition, when the SUPER-CCR method is used for analysis, the efficiency scores of ports are higher than 1. Overall, from the super-efficiency scores, the Ningbo port, Osaka port, and Hamburg port can be regarded as the most efficient ports among the 20 ports, with efficiency scores of 1.38, 1.29 and 1.23, respectively. The efficiency scores of these ports are stated in Table 3.
4.2. The impact of AGV application on port efficiency
Considering the AGV as an influencing factor on port efficiency, this study further used the simulated method to generate numbers of AGV and corresponding yard area, port profit, and port handling efficiency of each port. The other inputs and outputs are considered as constants. Then, the efficiency score of the selected 20 ports with simulation inputs and outputs is calculated. The simulation rules are summarised in Table 4.
Table 4. The simulation rulesa.
AGV numbers | Yard Area | Port Profit | Handling Efficiency | |
S1B | +1 | +1.5 (km2) | -8 (million) | +3% |
S1A | -1 | -1.5 (km2) | +8 (million) | -3% |
S2B | +1 | +2 (km2) | -10 (million) | +1% |
S2A | -1 | -2 (km2) | +10 (million) | -1% |
S3B | +1 | +1 (km2) | - 6 (million) | +5% |
S3A | -1 | -1 (km2) | +6 (million) | -5% |
a The simulation rules are made based on the collected data and the assumption. | ||||
For a particular Port, adding an AGV will increase yard area, capital investment and the corresponding variable costs to some extent, which means an increase in cost and a reduction in profit.
Table 5. Efficient set of AGV in DEA-CCR analysis.
Original Unit | S1 Efficient Unitea | S2 Efficient Unite | S3 Efficient Unite | ||||
S1A | S1B | S2A | S2B | S3A | S3B | ||
Shanghai Port | 135 | 122 | 148 | 127 | 144 | 110 | 158 |
Qingdao Port | 83 | 57 | 105 | 65 | 100 | 40 | 105 |
Xiamen Port | 18 | 9 | 28 | 11 | 23 | 6 | 35 |
Dalian Port | 0 | N.A.b | 23 | N.A. | 18 | N.A. | 26 |
Guangzhou Port | 0 | N.A. | 25 | N.A. | 16 | N.A. | 28 |
Ningbo Port | 0 | N.A. | 30 | N.A. | 25 | N.A. | 35 |
Tianjin Port | 0 | N.A. | 18 | N.A. | 18 | N.A. | 24 |
Qinhuangdao Port | 0 | N.A. | 15 | N.A. | 14 | N.A. | 19 |
Tangshan Port | 0 | N.A. | 22 | N.A. | 16 | N.A. | 25 |
Yinkou Port | 0 | N.A. | 20 | N.A. | 12 | N.A. | 24 |
Rotterdam Port | 85 | 58 | 107 | 68 | 92 | 44 | 115 |
Hamburg Port | 84 | 65 | 109 | 72 | 96 | 48 | 120 |
Virginia Port | 49 | 33 | 69 | 39 | 53 | 21 | 82 |
Singapore Port | 30 | 15 | 43 | 23 | 37 | 8 | 56 |
Barcelona Port | 18 | 4 | 30 | 10 | 23 | 2 | 38 |
Busan Port | 85 | 54 | 113 | 63 | 99 | 32 | 128 |
Antwerp Port | 65 | 36 | 95 | 43 | 72 | 18 | 110 |
Osaka Port | 0 | N.A. | 28 | N.A. | 16 | N.A. | 138 |
a The efficiency unit is calculated based on the DEA-CCR method.
b N.A. means not applicable.
From this view, this paper sets six scenarios. S1 stands that each additional AGV will increase a certain amount of yard area, resulting in handing efficiency increase and port profit decline. Compared with S1, S2 represents the situation that adding AGV will cause higher costs than the average level (S1), with a larger need for yard area and higher capital investment but less improvement in handling efficiency. Besides, the adding unit of AGV may also need less yard area and investment but performs better in handling efficiency improvement. Thus, S3 is made to represent the less requirement in the yard area and less loss in port profit, but higher handling efficiencies of each adding AGV. In addition, considering that the AGV can be added but also reduced in some situations, two sub-scenarios are set for each condition: A represents the reducing of each unit AGV, and B represents the adding of each unit AGV.
Then, using these simulated data, this study considered each production input-output set as one DMU to find out the optimal settings for each port with the highest efficiency. The DEA-CCR model is used to measure the efficiency score of each DMU of the port. The results are summarized in Table 5.
The result suggests that for automated terminals, the efficiency can be improved by increasing or decreasing the application of AGVs. When the number of AGVs is reduced to the efficient level, the port's profits will increase, although the handling efficiency will be reduced to some extent. On the contrary, when the number of AGVs increases to the efficiency level, the handling efficiency of the port will be improved, but the profit of the port will decrease. These two efficiencies stand for two port development strategies. One can be seen as economic efficiency improvement, and the other can be seen as service efficiency improvement.
For non-automated terminals, when the number of AGVs increases, the efficiency of ports will be improved to some extent. This means that the application of AGV in port can improve the handling efficiency of the port, even though the profit of the port will be decreased. Therefore, increasing the number of AGVs can enhance service levels in addition to enhancing the operation efficiency of non-automated ports.
Besides, the differences between the optimal number of AGVs and the actual number of AGVs in ports are variant. From the automated level, the 20 ports can be divided into four classes. The first tier is Xiamen Port, which distances the optimal number of AGVs to less than 10. Shanghai Port, Tianjin Port, Qinhuangdao Port, Yinkou Port, Hamburg Port, Virginia Port, Singapore Port, and Barcelona Port can be divided into the second tier, in which the actual number of containers is 10 to 20 less than the optimal number. Qingdao Port, Dalian Port, Guangzhou Port, Ningbo Port, Tangshan Port, Rotterdam Port and Osaka Port are the third tier, which distances to optimal application AGVs are between 20 to 30. The last tier is Busan Port, in which the actual number of AGVs is less than the optimal number of AGVs over 30 units. The distance between the optimal number of AGVs and the actual number of AGVs suggests that port operators need to increase the number of AGVs to maximise the service efficiency of the port. From an economic perspective, the 20 ports are divided into three categories. Xiamen port, Shanghai port, Tianjin port, Qinhuangdao port, Yingkou port, Virginia port, Singapore port, and Barcelona port are divided into the first tier, as they can achieve economic efficiency by reducing their application of AGVs to 10 to 20 units. The second group is Qingdao port, Dalian port, Guangzhou port, Ningbo port, Tangshan port, Rotterdam port, Osaka port, Busan port, Hamburg port, and Tangshan port. These ports need to reduce their number of AGVs by 20 to 30 units to achieve efficiency. Antwerp port has an AGV difference from the efficient unit of more than 30 and therefore is classified as the third tier. From the economic perspective, port operators need to reduce the number of AGVs to different degrees to maximise efficiency. Notably, from both an automation point of view and an economic point of view, the number of AGVs in Xiamen port, Shanghai port, Tianjin port, Qinhuangdao port, Yingkou port, Virginia Port, Singapore Port, Barcelona Port and Hamburg Port are reasonable. Thus, these ports have shown high efficiency in both aspects.
5. Conclusion and discussion
In this paper, the efficiency of 20 selected ports worldwide is evaluated by the DEA method. In the DEA analysis, berth length, number of port berths, yard area, number of canes and AGV are used as the inputs. Container throughput, port profits, and handling efficiency are used as outputs. Specially, we use the simulation method to change the number of AGVs and corresponding yard area, port profit and handling efficiency. And the DEA method and simulation data are used to obtain the optimal number of AGVs in each selected port.
The DEA-CCR and DEA-BCC result shows that ten ports, including Qingdao port, Shanghai port, Hamburg port, Virginia port, Singapore port, Barcelona port, Busan port, Ningbo Port, Tianjin Port, Tangshan port and Osaka port, are efficient as they obtained the efficiency score of 1 in both DEA-BCC and DEA-CCR. This result suggests that under the busy trade flows and high demand for transportation, these ten ports have fully used their resources. Second, Rotterdam port, Xiamen port, Qinhuangdao port, and Yingkou port can also be considered efficient as their BCC efficiency scores are 1 and the CCR efficiency scores are less than 1, indicating that these ports are scale efficient but are not production frontiers. Third, Antwerp port, Dalian port, Guangzhou port, Lianyungang port and Suzhou port are inefficient, as their BCC and CCR efficiency scores are less than 1. The inefficiency of these ports may result from the small scale and the idle resources of these ports.
By adjusting the number of AGVs in ports and calculating the corresponding efficiency scores of each port, the difference between the actual number of AGVs and the optimal number of AGVs is identified. We found that for automated terminals, both increasing or decreasing the number of AGVs can improve port efficiency. For non-automated terminals, the application of AGV will increase port efficiency. In addition, we divide the 20 ports into four classes according to the difference between the actual number of AGVs and the optimal number of AGVs. Some ports, such as the Xiamen port, can be considered efficient in automated transformation, as their distance to the optimal application of AGVs is small. But the ports, such as Qingdao Port, Ningbo Port, Rotterdam Port, Osaka Port and Antwerp port, are categorised as the third and fourth tier. These ports need to adjust port AGVs to achieve efficiency.
Besides, this paper identified two port strategies for efficient development. One is automated development. Port operators and managers can increase the application of AGVs to improve port efficiency. AGV purchase will reduce the port's profit, but the port's overall automation level can be greatly improved, therefore making the port equipment more advanced and more competitive. The other one is economic development. Port managers can reduce the number of AGVs in port to some extent. When the market economy is in recession, the financial expenditure of the port can be reduced by less use of AGVs, so as to achieve cost saving and economic efficiency.
Although we do our best in this paper, there are still some drawbacks. The first is data availability. As some ports' data is unavailable, secondary data from different sources are used in this study, which may lead to bias in efficiency comparison. Another problem is the hypotheses of simulation rules. As all the scenarios in this article are based on the reality summary, some ports' situations may not be represented. Future researchers can improve the related study with advanced simulation methods.
References
[1]. Héctor J. Carlo,Iris F.A. Vis and Kees Jan Roodbergen 2014. Transport operations in container terminals: Literature overview, trends, research directions and classification scheme. European Journal of Operational Research. 236 1.
[2]. Vrakas George,Chan Caroline and Thai Vinh V 2021. The effects of evolving port technology and process optimisation on operational performance: The case study of an Australian container terminal operator. The Asian Journal of Shipping and Logistics. 37 281.
[3]. AlKheder Sharaf, Naif Dana, Musaed Dana, Al Shrekah Shoug, Al Rshaid Munira, Al. Anzi Nada and Baqer Isra'a 2022. Maritime transport management in Kuwait toward an automated port logistical city. Cleaner Logistics and Supply Chain. 3 1000.
[4]. Garrido Salsas Javier,Saurí Sergi,Rúa Carles and Torrent Jordi 2022. Conceptualisation of the Port of the Future based on the Business Canvas Model: Case study of the Vision 2040 for Barcelona. Case Studies on Transport Policy. 10 1427.
[5]. Xiang Xi and Liu Changchun 2021. Modeling and analysis for an automated container terminal considering battery management. Computers & Industrial Engineering. 156 107258.
[6]. Li Xiangda,Peng Yun,Huang Jun,Wang Wenyuan and Song Xiangqun 2021. Simulation study on terminal layout in automated container terminals from efficiency, economic and environment perspectives. Ocean and Coastal Management. 213 105882.
[7]. Houjun Lu and Sai Wang 2019. A study on multi-ASC scheduling method of automated container terminals based on graph theory.Computers & Industrial Engineering.129 404.
[8]. Nikola Kutin, Thanh ThuyNguyen and Thomas Vallée 2017.Relative Efficiencies of ASEAN Container Ports based on Data Envelopment Analysis. The Asian Journal of Shipping and Logistics.33 67.
[9]. Nguyen Thi Le Hang, Park Sung-Hoon,Kim Yuna and Yeo Gi-Tae 2021. An efficiency analysis of container terminals in Southern Vietnam using DEA dynamic efficiency evaluation. The Asian Journal of Shipping and Logistics.37 329.
[10]. Jiabin Luo, Yue Wu and André Bergsten Mendes 2016. Modelling of integrated vehicle scheduling and container storage problems in unloading process at an automated container terminal. Computers & Industrial Engineering.94 32.
[11]. Chin-I. Liu,Hossein Jula and Petros A. Ioannou.(2002).Design, simulation, and evaluation of automated container terminals. IEEE transactions on intelligent transportation systems. 1 64.
[12]. Xuchao Chen, Shiwei He, Yongxiang Zhang and Lu (Carol)Tong 2020. Yard crane and AGV scheduling in automated container terminal: A multi-robot task allocation framework. Transportation Research Part C: Emerging Technologies.114 241.
[13]. Kate Forrest, MichaelMac Kinnon and Brian Tarroja 2020. Estimating the technical feasibility of fuel cell and battery electric vehicles for the medium and heavy duty sectors in California. Applied Energy. 276 1154.
[14]. Ana María Martín-Soberón, Arturo Monfort, Rafael Sapiña and David Calduch 2014. Automation in Port Container Terminals. Procedia - Social and Behavioral Sciences. 160 195.
[15]. Jack Xunjie Luo 2019. Fully automatic container terminals of Shanghai Yangshan Port phase IV. Frontiers of Engineering Management. 6 457.
[16]. Wang Zehao and Zeng Qingcheng 2022. A branch-and-bound approach for AGV dispatching and routing problems in automated container terminals. Computers & Industrial Engineering. 166 107968.
[17]. Meisu Zhong, Yongsheng Yang and Yasser Dessouky 2020.Multi-AGV scheduling for conflict-free path planning in automated container terminals. Computers & Industrial Engineering.142 1063.
[18]. Vis, I. F. A., and Harika, I 2004. Comparison of vehicle types at an automated container terminal. OR Spectrum. 26 143.
[19]. Ning Ma, Chenhao Zhou and Aloisius Stephen 2021. Simulation model and performance evaluation of battery-powered AGV systems in automated container terminals. Simulation Modelling Practice and Theory(prepublish). 106 102146.
[20]. Xin Jianbin, Negenborn Rudy R. and Lodewijks Gabriel 2014. Rescheduling of interacting machines in automated container terminals. IFAC Proceedings Volumes. 47 1698.
[21]. A.CharnesW.W and CooperE.Rhodes 1978. Measuring the efficiency of decision making units. European Journal of Operational Research. 2 429.
[22]. Roll and Y. Hayuth 1993. Port performance comparison applying data envelopment analysis (DEA). Maritime Policy & Management. 20 153.
[23]. R.D.Banker A.CharnesW.W. and Cooper R.Clarke 1989. Constrained game formulations and interpretations for data envelopment analysis.European Journal of Operational Research. 40 299.
[24]. Golany B and Roll Y 1989. An application procedure for DEA. Omega. 17 237.
[25]. James Odeckac and Halvor Schøyen 2020.Productivity and convergence in Norwegian container seaports: An SFA-based Malmquist productivity index approach. Transportation Research Part A: Policy and Practice. 137 222.
[26]. Densberger Nicole Light and Bachkar Khalid 2022. Towards accelerating the adoption of zero emissions cargo handling technologies in California ports: Lessons learned from the case of the Ports of Los Angeles and Long Beach. Journal of Cleaner Production. 347 131255.
[27]. Kevin Cullinane, Dong-Wook Song, Ping Ji and Teng-Fei Wang 2011. An Application of DEA Windows Analysis to Container Port Production Efficiency. Review of Network Economics.3 46.
Cite this article
Chen,Q. (2023). The impact of AGV application on port operating efficiency. Theoretical and Natural Science,18,19-29.
Data availability
The datasets used and/or analyzed during the current study will be available from the authors upon reasonable request.
Disclaimer/Publisher's Note
The statements, opinions and data contained in all publications are solely those of the individual author(s) and contributor(s) and not of EWA Publishing and/or the editor(s). EWA Publishing and/or the editor(s) disclaim responsibility for any injury to people or property resulting from any ideas, methods, instructions or products referred to in the content.
About volume
Volume title: Proceedings of the 2nd International Conference on Computing Innovation and Applied Physics
© 2024 by the author(s). Licensee EWA Publishing, Oxford, UK. This article is an open access article distributed under the terms and
conditions of the Creative Commons Attribution (CC BY) license. Authors who
publish this series agree to the following terms:
1. Authors retain copyright and grant the series right of first publication with the work simultaneously licensed under a Creative Commons
Attribution License that allows others to share the work with an acknowledgment of the work's authorship and initial publication in this
series.
2. Authors are able to enter into separate, additional contractual arrangements for the non-exclusive distribution of the series's published
version of the work (e.g., post it to an institutional repository or publish it in a book), with an acknowledgment of its initial
publication in this series.
3. Authors are permitted and encouraged to post their work online (e.g., in institutional repositories or on their website) prior to and
during the submission process, as it can lead to productive exchanges, as well as earlier and greater citation of published work (See
Open access policy for details).
References
[1]. Héctor J. Carlo,Iris F.A. Vis and Kees Jan Roodbergen 2014. Transport operations in container terminals: Literature overview, trends, research directions and classification scheme. European Journal of Operational Research. 236 1.
[2]. Vrakas George,Chan Caroline and Thai Vinh V 2021. The effects of evolving port technology and process optimisation on operational performance: The case study of an Australian container terminal operator. The Asian Journal of Shipping and Logistics. 37 281.
[3]. AlKheder Sharaf, Naif Dana, Musaed Dana, Al Shrekah Shoug, Al Rshaid Munira, Al. Anzi Nada and Baqer Isra'a 2022. Maritime transport management in Kuwait toward an automated port logistical city. Cleaner Logistics and Supply Chain. 3 1000.
[4]. Garrido Salsas Javier,Saurí Sergi,Rúa Carles and Torrent Jordi 2022. Conceptualisation of the Port of the Future based on the Business Canvas Model: Case study of the Vision 2040 for Barcelona. Case Studies on Transport Policy. 10 1427.
[5]. Xiang Xi and Liu Changchun 2021. Modeling and analysis for an automated container terminal considering battery management. Computers & Industrial Engineering. 156 107258.
[6]. Li Xiangda,Peng Yun,Huang Jun,Wang Wenyuan and Song Xiangqun 2021. Simulation study on terminal layout in automated container terminals from efficiency, economic and environment perspectives. Ocean and Coastal Management. 213 105882.
[7]. Houjun Lu and Sai Wang 2019. A study on multi-ASC scheduling method of automated container terminals based on graph theory.Computers & Industrial Engineering.129 404.
[8]. Nikola Kutin, Thanh ThuyNguyen and Thomas Vallée 2017.Relative Efficiencies of ASEAN Container Ports based on Data Envelopment Analysis. The Asian Journal of Shipping and Logistics.33 67.
[9]. Nguyen Thi Le Hang, Park Sung-Hoon,Kim Yuna and Yeo Gi-Tae 2021. An efficiency analysis of container terminals in Southern Vietnam using DEA dynamic efficiency evaluation. The Asian Journal of Shipping and Logistics.37 329.
[10]. Jiabin Luo, Yue Wu and André Bergsten Mendes 2016. Modelling of integrated vehicle scheduling and container storage problems in unloading process at an automated container terminal. Computers & Industrial Engineering.94 32.
[11]. Chin-I. Liu,Hossein Jula and Petros A. Ioannou.(2002).Design, simulation, and evaluation of automated container terminals. IEEE transactions on intelligent transportation systems. 1 64.
[12]. Xuchao Chen, Shiwei He, Yongxiang Zhang and Lu (Carol)Tong 2020. Yard crane and AGV scheduling in automated container terminal: A multi-robot task allocation framework. Transportation Research Part C: Emerging Technologies.114 241.
[13]. Kate Forrest, MichaelMac Kinnon and Brian Tarroja 2020. Estimating the technical feasibility of fuel cell and battery electric vehicles for the medium and heavy duty sectors in California. Applied Energy. 276 1154.
[14]. Ana María Martín-Soberón, Arturo Monfort, Rafael Sapiña and David Calduch 2014. Automation in Port Container Terminals. Procedia - Social and Behavioral Sciences. 160 195.
[15]. Jack Xunjie Luo 2019. Fully automatic container terminals of Shanghai Yangshan Port phase IV. Frontiers of Engineering Management. 6 457.
[16]. Wang Zehao and Zeng Qingcheng 2022. A branch-and-bound approach for AGV dispatching and routing problems in automated container terminals. Computers & Industrial Engineering. 166 107968.
[17]. Meisu Zhong, Yongsheng Yang and Yasser Dessouky 2020.Multi-AGV scheduling for conflict-free path planning in automated container terminals. Computers & Industrial Engineering.142 1063.
[18]. Vis, I. F. A., and Harika, I 2004. Comparison of vehicle types at an automated container terminal. OR Spectrum. 26 143.
[19]. Ning Ma, Chenhao Zhou and Aloisius Stephen 2021. Simulation model and performance evaluation of battery-powered AGV systems in automated container terminals. Simulation Modelling Practice and Theory(prepublish). 106 102146.
[20]. Xin Jianbin, Negenborn Rudy R. and Lodewijks Gabriel 2014. Rescheduling of interacting machines in automated container terminals. IFAC Proceedings Volumes. 47 1698.
[21]. A.CharnesW.W and CooperE.Rhodes 1978. Measuring the efficiency of decision making units. European Journal of Operational Research. 2 429.
[22]. Roll and Y. Hayuth 1993. Port performance comparison applying data envelopment analysis (DEA). Maritime Policy & Management. 20 153.
[23]. R.D.Banker A.CharnesW.W. and Cooper R.Clarke 1989. Constrained game formulations and interpretations for data envelopment analysis.European Journal of Operational Research. 40 299.
[24]. Golany B and Roll Y 1989. An application procedure for DEA. Omega. 17 237.
[25]. James Odeckac and Halvor Schøyen 2020.Productivity and convergence in Norwegian container seaports: An SFA-based Malmquist productivity index approach. Transportation Research Part A: Policy and Practice. 137 222.
[26]. Densberger Nicole Light and Bachkar Khalid 2022. Towards accelerating the adoption of zero emissions cargo handling technologies in California ports: Lessons learned from the case of the Ports of Los Angeles and Long Beach. Journal of Cleaner Production. 347 131255.
[27]. Kevin Cullinane, Dong-Wook Song, Ping Ji and Teng-Fei Wang 2011. An Application of DEA Windows Analysis to Container Port Production Efficiency. Review of Network Economics.3 46.