


1. Introduction
In recent years, an increasing number of factories have started to use steel structures, which are recyclable, light-weight, and easy to assemble, as a form of large-span structures. The prefabricated steel structure building has the advantages of resource recycling, environmental friendliness, short construction period, good seismic performance and so on, which is more in line with the use requirements of green buildings [1]. This structure has the characteristics of large span and high floor height. Its design and construction differ from conventional frame structures. And currently, domestic researchers have conducted a significant amount of theoretical analysis and experimental research on lightweight portal frame structural systems. The research achievements have been widely applied in practical engineering. During the design and selection stage, it is necessary to discuss in advance the construction measures and various issues that may arise during construction and use. In reality, structures are subjected to various loads, and the magnitudes of these loads also fluctuate.
Structural reliability theory first appeared in the early 20th century, when probability theory was applied to study structural reliability [2]. Using the total probability method, Freudenthal [3] put forth fundamental structural safety issues under random load, which laid the groundwork for structural reliability theory. Zhao et al [4]. suggested that the first-order second-moment approach might be used to study the structural safety coefficient. He then suggested numerical simulation methods for the structural reliability, including the hybrid simulation method, the response surface method, and Monte Carlo simulation. Based on these, more appropriate specifications of I-beams can be used to improve economic efficiency.
Also as an alternative, when designing (or checking) with direct techniques, sophisticated simulations may be used to directly estimate the strength of a part or a structure without the need for further tests. When applied to systems, the load redistribution capacity, redundancy, and robustness of the structures can be fully exploited, ensuring a more uniform reliability across different structural systems and potentially leading to lighter and more affordable designs [5]. Therefore, this paper needs to identify potential load conditions and combine them, and then perform reliability analysis using Monte Carlo simulation.
2. Engineering background
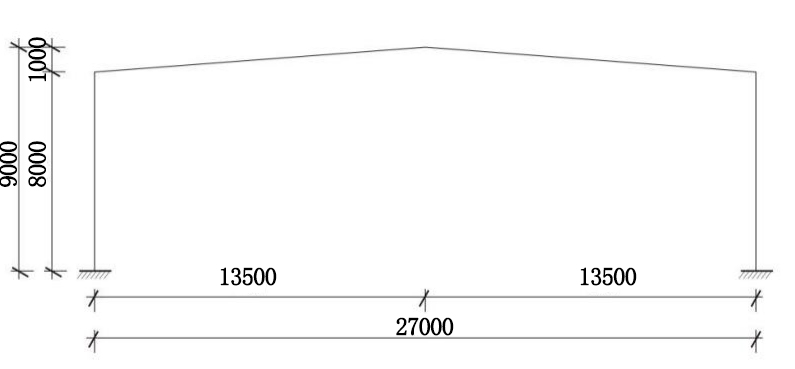
The chosen structure in figure 1 is a typical single-story residential house, often found in factory building. Details of the house’s layout and construction materials are included in the report. The section data and parameters for I-beam sections are provided in figure 2.
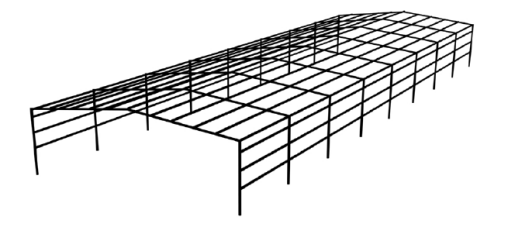
Figure 1. Structure Diagram.
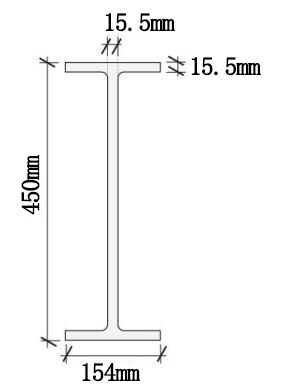
(a) Section diagram (b) Cross-sectional Diagram
Figure 2. Parameters of the members.
3. Load conditions
In terms of mechanical analysis, the essay primarily use the method of moment distribution, and for reliability analysis, and also employ MATLAB for Monte Carlo simulations. The parameters found in the building code specifications are listed in table 1 [6].
Table 1. Basic Parameters.
Type of Load | Dead Load | Snow Pressure | Wind Pressure |
Standard Value | 0.5kN/m2 | 0.5kN/m2 | 0.35kN/m2 |
3.1. Dead load and snow load
Snow load calculation formula is as below.
\( {s_{k}}={u_{r}}{s_{0}} \) (1)
where ur is Roof Snow Load Distribution Coefficient, and so is basic snow pressure. Since the angle formed between the roof and the horizontal plane is significantly less than 25 degrees, the parameter ur is taken as 1 in this case [6]. The snow load can be calculated by equation (1), and its value is equal to 0.5kN/m2. However, to simplify the issue, the paper only focus on one section in figure 2. Since the spacing of the portal frame columns is 7.5m, the uniformly distributed load should be converted into a uniformly distributed line load along the length of the inclined beam.
\( 0.5kN/{m^{2}}×7.5m=3.75kN/m \) (Dead Load) (2)
\( 0.5kN/{m^{2}}×7.5m=3.75kN/m \) (Snow Load) (3)
After they are superimposed, the force action situation is shown in figure 3. Regardless of the displacement in the horizontal direction, the bending moment distribution method was used. And after transmitting for two times, the bending moment diagram was drawn below in figure 4.
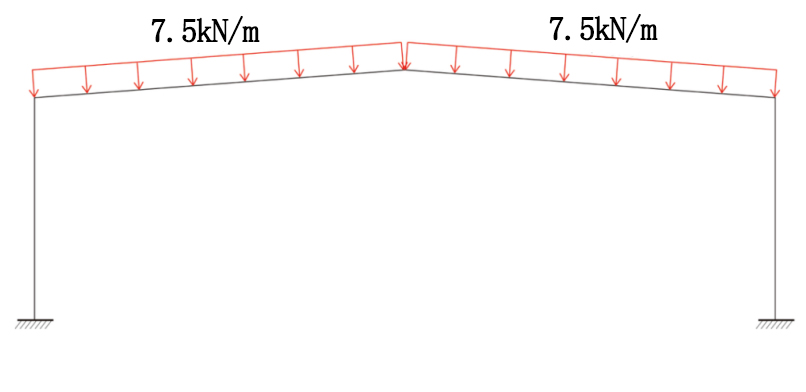
Figure 3. Diagram of snow load combined with dead load.
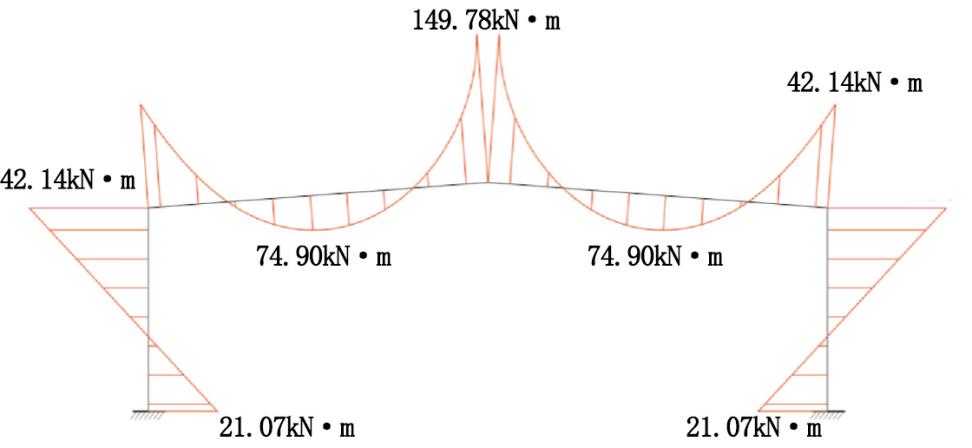
Figure 4. Bending moment diagram.
3.2. Wind load
In this paper, the wind is coming from the left of the structure. According to the code specifications, the wind can be calculated by equation (4), and the result is 0.3675kN/m2 [7, 8].
\( {w_{k}}={u_{s}}{u_{z}}{w_{0}} \) (4)
where uz is the Wind Load Height Variation Coefficient and uz= 1, and w0 is the basic wind pressure, and w0 = 0.35kN/m2×1.05=0.3675kN/m2. The loads on members are calculated in table 2. The simplified diagram of wind load can be drawn in figure 5. In addition, using the bending moment distribution method, the bending moment diagram can be easily drawn in figure 6.
Table 2. Wind loada.
Parameter | Left column | Right column | Left beam | Right beam |
us | +0.25 | -0.55 | -1.00 | -0.65 |
Wind load (kN/m) | +0.685 | -1.516 | -2.756 | -1.792 |
a Notes: Positive sign (pressure) indicates wind force acting from the outside towards the surface; negative sign indicates wind force moving away from the surface, indicating a load direction that is away from the component surface, i.e., generating suction.
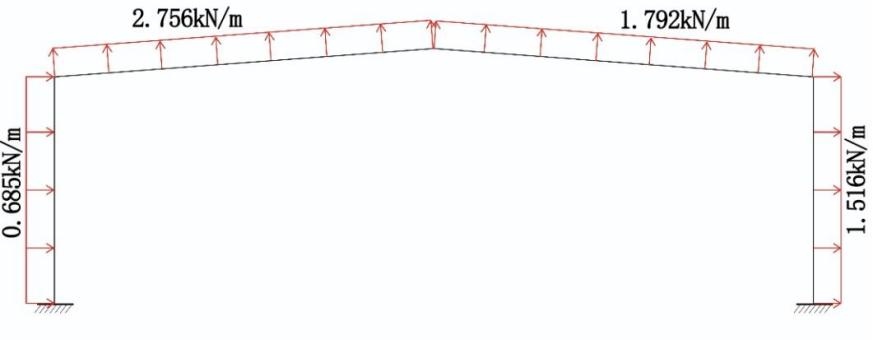
Figure 5. Diagram of wind load.
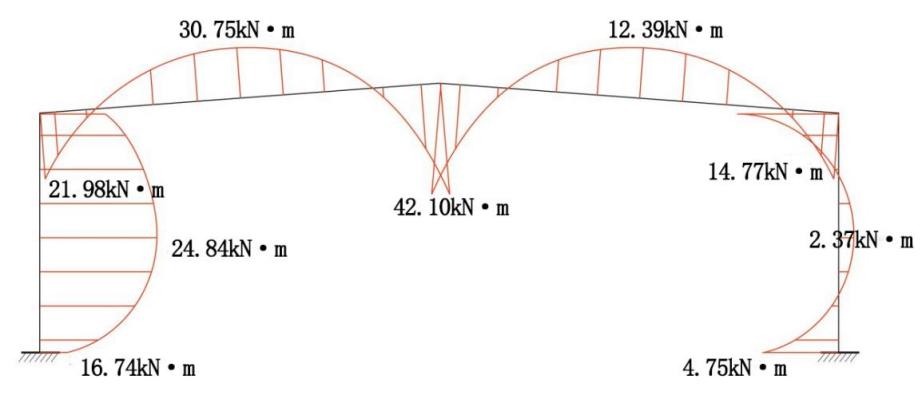
Figure 6. Bending moment diagram.
3.3. Crane load
To simplify the calculation, it is assumed that the maximum (or minimum) wheel pressure of the crane moves 0.5m horizontally along the axis of the rigid frame column, and the corresponding bending moment will be generated [9]. Table 3 shows the carne parameter. The value of the bending moment generated is 310 kN × 0.5m= 155 kN·m, and 102kN×(-0.5)m=-51kN·m. And the simplified diagram of crane load can be drawn in figure 7. As the former loads, the bending moment diagram of crane load can be drawn with bending moment distribution method in figure 8.
Table 3. Crane Parameters
Lifting Weight Gn (t) | Span Lk (m) | Weight of the Trolley g (t) | Total Weight G (t) | Maximum Wheel Pressure Pmax (kN) | Minimum Wheel Pressure Pmin (kN) |
32 | 27 | 11.1 | 50 | 310 | 102 |
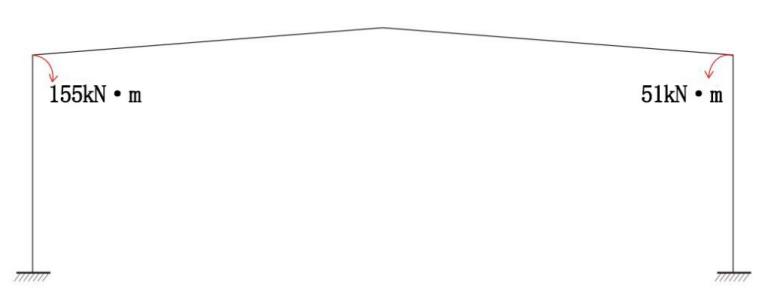
Figure 7. Diagram of crane load.
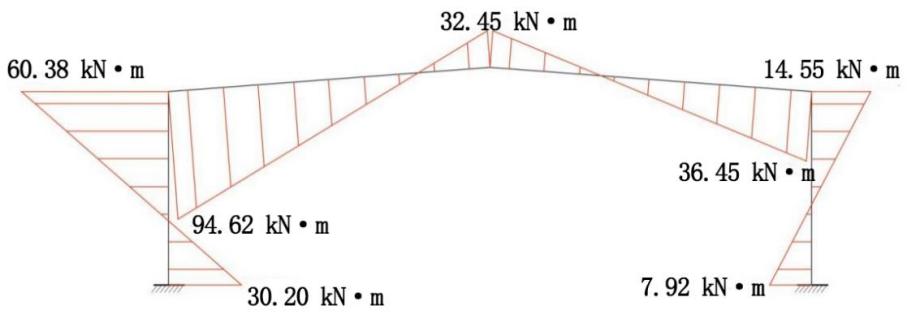
Figure 8. Bending moment diagram.
4. Reliability analysis
Compared to other probabilistic methods, Monte Carlo simulation avoids complex mathematical computations. By conducting a Monte Carlo simulation in MATLAB with a predetermined number of iterations of 10,000, changing the load magnitude or I-beam cross-sectional properties under three different load conditions, one can obtain a fragile curve for each case. Figure 9 represents the variations of load change with the probability of failure. Figure 10 represents the variations of the moment of inertia of the cross-section with the probability of failure under snow load, wind load, and crane load conditions respectively. From the above set of images, it can be observed that there is always a critical point or a sudden change in the probability of failure with respect to the variables. Looking at individual variables, the crane load should not exceed 190 tons, and the combined snow load and dead load should not exceed 15 kN/m. A basic wind pressure within the range of 2.5 kN/m is considered more suitable. For the moment of inertia, it is believed that it will be better to consider them in a combined manner. Therefore, another round of Monte Carlo simulation is conducted, which only considering the superposition of maximum bending moments. The simulation results are shown in figure 11. Using this method, the appropriate value of moment of inertia should be 2.8×10⁻⁴ m4.
|
| |
(a) Crane load | (b) Snow load combined with dead load | |
| ||
(c) Basic wind pressure | ||
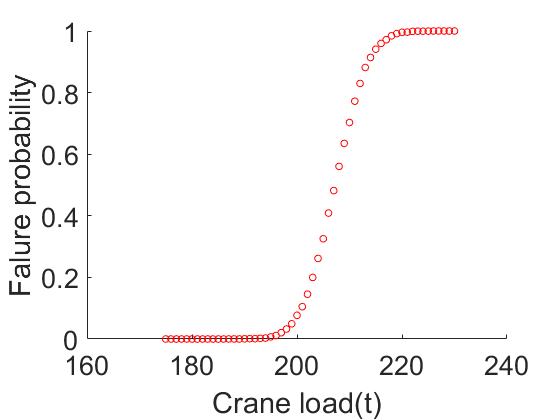
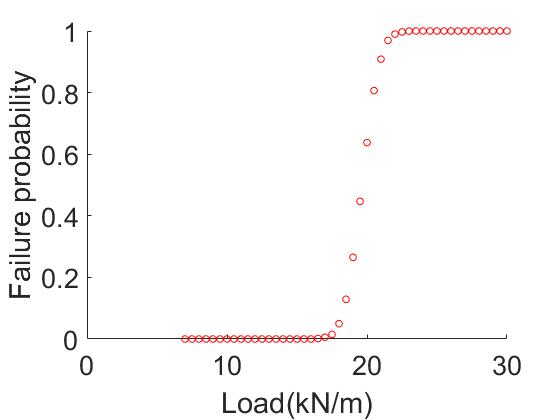
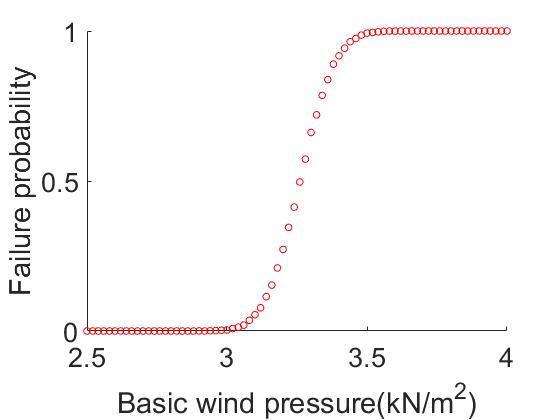
Figure 9. Fragility curve under different load conditions.
|
| |
(a) Snow load combined with dead load | (b) Wind load | |
| ||
(c) Crane load | ||
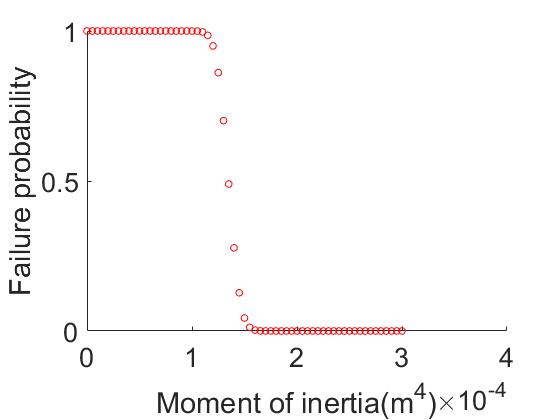
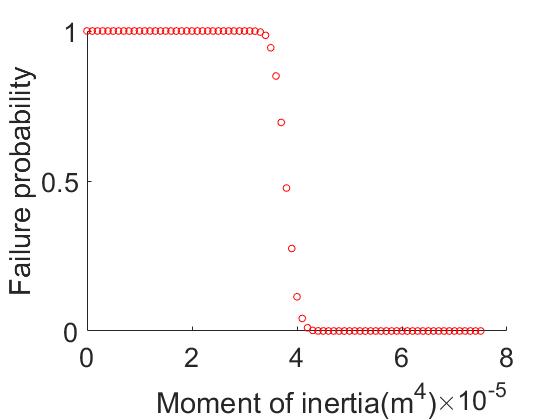
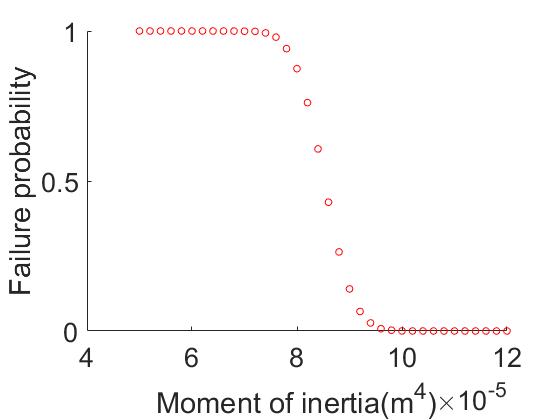
Figure 10. Curve of Failure Probability Changes with Moment of Inertia under Different Load Conditions.
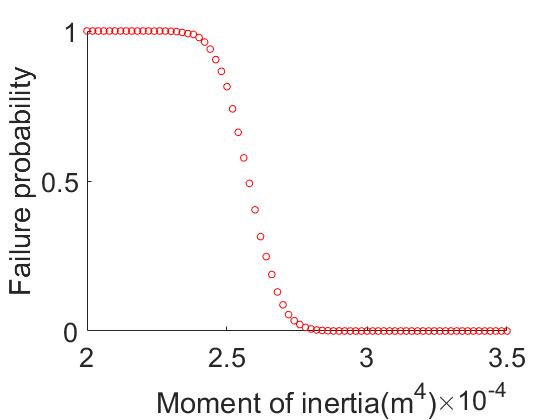
Figure 11. Fragility Curve under Combined Load Effects.
5. Limit state design
When the effects of actions and action effects are considered in a linear relationship, the design value of the basic combination effects should be calculated using the most unfavorable value in the following equation. It is worth mentioning that in the wind load case, the wind load assumed is favorable for the beam. Therefore, the coefficient at the location of the originally planned maximum bending moment is set to 0, and other maximum bending moment values are considered instead. The design service life of this structure is 50 years, therefore the load adjustment factor is taken as 1 [10].
\( Sd=\sum _{i≥1}γGiSGik+γPSP+γQ1γL1SQ1k+\sum _{j≥1}γQjφcjγLjSQjk\ \ \ (5) \)
where \( γGi \) is sub-factor coefficient for the ith permanent load effect, \( SGik \) is effects of the ith permanent load effect’s characteristic value, \( γP \) is sub-factor coefficient for prestressing effects, \( SP \) is effects of representative values related to prestressing, \( γQ1 \) is sub-factor coefficient for the first variable load effect, \( γL1 \) is load adjustment factor for the first consideration of the structural design service life, \( SQ1k \) is Effects of the first characteristic value of the variable load effect, \( γQj \) is sub-factor coefficient for the jth variable load effect, \( φcj \) is Combination value coefficient for the jth variable load effect. In our project, \( Sp \) is equal to 0 for there is no prestressing. \( γg \) is equal to 1.2 and \( γQ \) is equal to 1.5 according to unified standard for reliability design of building structures. Besides, due to the design service life of the structure being 50 years, the coefficient \( γL \) is set to 1.
With the data above and using equation (5), it can be easily calculated that Sd is equal to 373.904. The limit state design for the ultimate capacity of structural or structural component failure or excessive deformation should meet the following requirement [10].
\( γ0Sd≤Rd\ \ \ (6) \)
where \( γ0 \) is importance factor and \( Rd \) is design resistance value. In this case, in equation (6), the structural importance factor \( γ0 \) is taken as 1.0, so Rd is equal to 373.904. As shown in figure 12, the moment of inertia should be more than 3.65×10⁻⁴ m4.
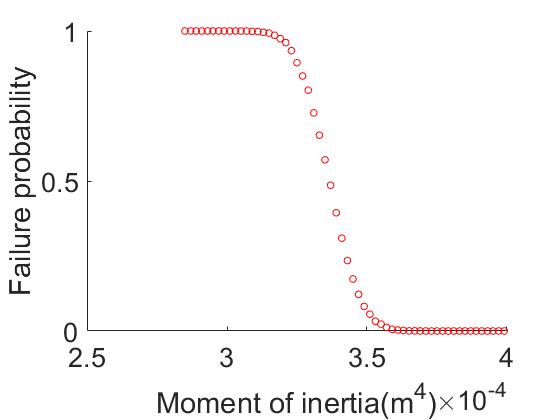
Figure 12. Fragility curve for limit state design.
6. Conclusion
In this paper, Monte Carlo simulation is primarily used to calculate the failure probability in order to determine the appropriate moment of inertia. Additionally, limit state design is employed to calculate the appropriate design value.
The reason why the design value in limit state design is larger than the pure superposition is because limit state design takes into account various factors such as the service life and importance level of the building. Furthermore, it is easy to feel the convenience of Monte Carlo simulation, as it does not involve complex mathematical calculations, yet its accuracy is not inferior to other complex methods. However, it must be acknowledged that there are several factors that have not been taken into account in this paper. For example, the assumption of no lateral displacement in the frame, the assumption of all components using the same material, and the exclusion of seismic loads from consideration.
In future research, there are many other factors that can be taken into consideration. For example, as a portal steel frame, the analysis of the stress on the welding points between components, as well as factors such as the depth of foundation, are worth exploring.
References
[1]. Liu Q 2022 Design and Application of Large-Span Steel Structure Factory Buildings China Construction Metal Structure (06) 96-98
[2]. Wang J, Hu C and Liu Z et al. 2023 Study on Structural Reliability Analysis Method Based on Chance Theory Buildings 13(5) 1245
[3]. Freudenthal A M 1947 The safety of structures Trans ASCE 112 125–159
[4]. Zhao G F, Cao J Y and Zhang K Q 2011 Reliability of Engineering Structure Science Press: Beijing, China 25–105
[5]. Zhang H, Liu H and Ellingwood R B et al. 2018 System Reliabilities of Planar Gravity Steel Frames Designed by the Inelastic Method in AISC 360-10 Journal of Structural Engineering 144(3) 1-3
[6]. Building Structural Load Specifications: GB 50009-2012 Beijing: China Architecture & Building Press, 2012
[7]. Technical Specifications for Light Steel Structures of Portal Frame Modular Houses: CECS102-2002 Beijing: China Architecture & Building Pres 2022
[8]. Arrayago Itsaso,Rasmussen Kim J.R. & Zhang Hao 2022 System-based reliability analysis of stainless steel frames subjected to gravity and wind loads Structural Safety 97 102-211
[9]. Standard design of steel structures: GB 50017-2017 Beijing: China Architecture & Building Press 2017
[10]. Unified standard for reliability design of building structures: GB 50068-2018 Beijing: China Architecture & Building Press 2018
Cite this article
He,M. (2023). Research on decision and risk analysis for portal frame. Theoretical and Natural Science,25,266-273.
Data availability
The datasets used and/or analyzed during the current study will be available from the authors upon reasonable request.
Disclaimer/Publisher's Note
The statements, opinions and data contained in all publications are solely those of the individual author(s) and contributor(s) and not of EWA Publishing and/or the editor(s). EWA Publishing and/or the editor(s) disclaim responsibility for any injury to people or property resulting from any ideas, methods, instructions or products referred to in the content.
About volume
Volume title: Proceedings of the 3rd International Conference on Computing Innovation and Applied Physics
© 2024 by the author(s). Licensee EWA Publishing, Oxford, UK. This article is an open access article distributed under the terms and
conditions of the Creative Commons Attribution (CC BY) license. Authors who
publish this series agree to the following terms:
1. Authors retain copyright and grant the series right of first publication with the work simultaneously licensed under a Creative Commons
Attribution License that allows others to share the work with an acknowledgment of the work's authorship and initial publication in this
series.
2. Authors are able to enter into separate, additional contractual arrangements for the non-exclusive distribution of the series's published
version of the work (e.g., post it to an institutional repository or publish it in a book), with an acknowledgment of its initial
publication in this series.
3. Authors are permitted and encouraged to post their work online (e.g., in institutional repositories or on their website) prior to and
during the submission process, as it can lead to productive exchanges, as well as earlier and greater citation of published work (See
Open access policy for details).
References
[1]. Liu Q 2022 Design and Application of Large-Span Steel Structure Factory Buildings China Construction Metal Structure (06) 96-98
[2]. Wang J, Hu C and Liu Z et al. 2023 Study on Structural Reliability Analysis Method Based on Chance Theory Buildings 13(5) 1245
[3]. Freudenthal A M 1947 The safety of structures Trans ASCE 112 125–159
[4]. Zhao G F, Cao J Y and Zhang K Q 2011 Reliability of Engineering Structure Science Press: Beijing, China 25–105
[5]. Zhang H, Liu H and Ellingwood R B et al. 2018 System Reliabilities of Planar Gravity Steel Frames Designed by the Inelastic Method in AISC 360-10 Journal of Structural Engineering 144(3) 1-3
[6]. Building Structural Load Specifications: GB 50009-2012 Beijing: China Architecture & Building Press, 2012
[7]. Technical Specifications for Light Steel Structures of Portal Frame Modular Houses: CECS102-2002 Beijing: China Architecture & Building Pres 2022
[8]. Arrayago Itsaso,Rasmussen Kim J.R. & Zhang Hao 2022 System-based reliability analysis of stainless steel frames subjected to gravity and wind loads Structural Safety 97 102-211
[9]. Standard design of steel structures: GB 50017-2017 Beijing: China Architecture & Building Press 2017
[10]. Unified standard for reliability design of building structures: GB 50068-2018 Beijing: China Architecture & Building Press 2018