


1. Introduction
The global financial market, especially the stock market, has consistently been a subject of intrigue and meticulous examination. Its volatile nature and immense potential for profit and loss have made it a central focus for investors, economists, and researchers. Predicting the stock market's future movements is akin to forecasting the weather. At the same time, specific patterns can be discerned, and the multitude of variables at play makes achieving complete accuracy challenging. However, with the emergence of sophisticated statistical methodologies and computational capabilities, there's a rejuvenated optimism in the quest to predict stock market trajectories accurately. Historically, the stock market's dynamics were deciphered using rudimentary financial metrics and overarching economic trends [1]. But as the world's economies became intricately interwoven and multifaceted, these conventional techniques began to exhibit their constraints. Smith et al. underscored the necessity of assimilating global economic markers when scrutinizing a specific nation's stock market, attributing this to the observable domino effect in international markets [2].
Similarly, Jones shed light on the profound impact of geopolitical occurrences on stock market trajectories, positing that external determinants often overshadow domestic economic metrics [3]. The contemporary era has witnessed the burgeoning role of technology and data analytics in forecasting stock market directions. The big data revolution has endowed researchers with a treasure trove of information, from the sentiments echoed on social media to granular real-time trading statistics [4]. Thompson and Lee embarked on a journey to discern the relationship between stock market fluctuations and the mood of social media, especially platforms like Twitter. Their findings cemented the significant interrelation between these two realms [5]. Contrarily, Kapoor and his team wielded et al. Machine learning techniques to dissect real-time trading data, registering a prediction precision that overshadowed conventional methodologies [6]. Yet, as technology has ushered in advanced analytical tools, it has simultaneously birthed new challenges. The stock market's volatility has reached unprecedented levels, with algorithmic and high-frequency trading instigating abrupt market shifts [7]. Anderson and Zhao have spotlighted the pitfalls of an unwavering reliance on data analytics. They emphasized the importance of comprehending the foundational algorithms that power trading bots [8]. Many statistical techniques have been championed for their efficacy in forecasting stock market dynamics. Time Series Analysis, for instance, has enjoyed widespread adoption, with Wang and his colleagues vouching for its prowess in anticipating short-term market shifts [9]. Logistic Regression Analysis, a tool employed by Tian et al. in their lung cancer trend predictions, has also carved a niche in the financial domain. It is particularly adept at forecasting binary outcomes, such as a market surge or slump [10].
In recent years, stock market prediction has become a popular research topic in the financial field. Koukaras et al. discussed in the literature how to use Weibo sentiment analysis and machine learning to predict stock market trends. They mainly used data on Twitter and StockTwits and adopted various machine learning classification models, such as SVM, KNN, and MLP. Cristescu et al. emphasized the importance of market news sentiment analysis in stock market prediction in literature [10]. They demonstrated that sentiment analysis can improve the accuracy of stock market forecasts by comparing the results of regression models with and without market news sentiment analysis. Srijiranon et al. proposed a hybrid framework combining proposed a hybrid framework combining Principal Component Analysis (PCA), Empirical Mode Decomposition (EMD), and Long Short-Term Memory (LSTM) methods in the literature for stock market price prediction [9]. They combined with sentiment analysis to further improve the accuracy of prediction. These three documents all emphasize the critical role of sentiment analysis in stock market prediction and provide different methods and frameworks to achieve more accurate predictions. Given this backdrop, the paper endeavors to harness the ARIMA model's capabilities to predict impending Apple’s stock market trends. By amalgamating many determinants, ranging from economic markers to technological catalysts, we aspire to furnish a holistic instrument. This tool aims to guide investors and researchers as they traverse the capricious terrains of the stock market, seeking to demystify its unpredictable ebbs and flows.
2. Methods
2.1. Data source
The data for predicting Apple's future price is sourced from reputable financial databases that track stock prices and market trends. Specifically, the data gets exaggerated from the Kaggle website, which hosts datasets for various research purposes. This dataset was meticulously compiled by Mysar Ahmad Bhat, who gathered the information from the online Apple Stock Price Prediction System. The dataset was published and updated in 2022 and encompasses the stock prices for Apple Inc. for 100 trading days.
2.2. Variable selection
The dataset comprises data for 100 trading days, capturing the stock price movements of Apple Inc. It includes data points for days when the stock price increased and decreased. In this context, the data's age refers to how recent the data is, ranging from the start of the fiscal year to the end. The dataset is enriched with five crucial determinants of stock price movements. These variables include (table 1):
Table 1. Basic information of Apple’s Stock in 100 trading days as a function of time.
Statistic | Close/Last | Volume | Open | High | Low |
Average | 175.846 | 82410190.0 | 176.592 | 177.882 | |
Maximum | 177.97 | 109259500 | 179.49 | 180.13 | |
Maximum | 09/18/2023 | 09/18/2023 | 09/18/2023 | 09/18/2023 | 09/18/2023 |
Minimum | 174.21 | 60895760 | 174.0 | 176.1 | 173.58 |
Minimum | 09/12/2023 | 09/12/2023 | 09/12/2023 | 09/12/2023 | 09/12/2023 |
S.D. | 1.423 | 19236494.2 | 1.94606 | 1.783 | 1.056 |
Table 1 provides a detailed breakdown of these variables, their logograms for easy reference, and their numbers, representing the frequency of their occurrence or significance in the dataset. The sample of the dataset is 100 trading days.
2.3. Method introduction
This paper aims to predict Apple's stock price using the Autoregressive Integrated Moving Average (ARIMA) model. The ARIMA model examines past stock prices to predict future prices. The primary variable we're looking at is Apple's stock price (Y) over time. First, we gather historical daily closing prices of Apple's stock. We then prepare this data by cleaning up any inaccuracies and ensuring it suits the ARIMA model. To set up the ARIMA model, we need to figure out three parameters: the order of differencing (d), the order of autoregression (p), and the order of moving average (q). Once the model is set up, we use it to make predictions about future stock prices of Apple. We check how well our model is doing by looking at the difference between predicted and actual prices in our historical data. We use software tools SPSSAU and SPSSPRO for all the statistical work. We follow the same approach as in the previous section, where we looked at the relationship between 15 factors and lung cancer using Probit Regression. ARIMA combines two basic methods (autoregressive and moving average) with a step called differencing to help predict future values in a data series, like stock prices, based on past weights. The autoregressive part (p) looks at past values in the data, the moving average part (q) looks at past errors, and the differencing step (d) helps make the data more predictable by removing trends.
3. Results and discussion
The ARIMA model’s prowess in financial forecasting is unparalleled, especially when it comes to predicting the future values of stock prices. The integration of autoregressive components, moving averages, and differencing makes ARIMA a versatile tool, capable of adapting to various trends and patterns in time series data. This adaptability is crucial, as financial markets are influenced by an array of factors, ranging from macroeconomic indicators to investor sentiment. By meticulously analyzing past data points and forecast errors, ARIMA provides a nuanced understanding of stock market behaviors. This understanding is not just quantitative; it encapsulates the essence of market dynamics, offering insights that go beyond mere numbers. The model’s ability to make sense of chaotic financial data, to find order in the apparent randomness, is a testament to its efficacy and reliability (Figure 1).
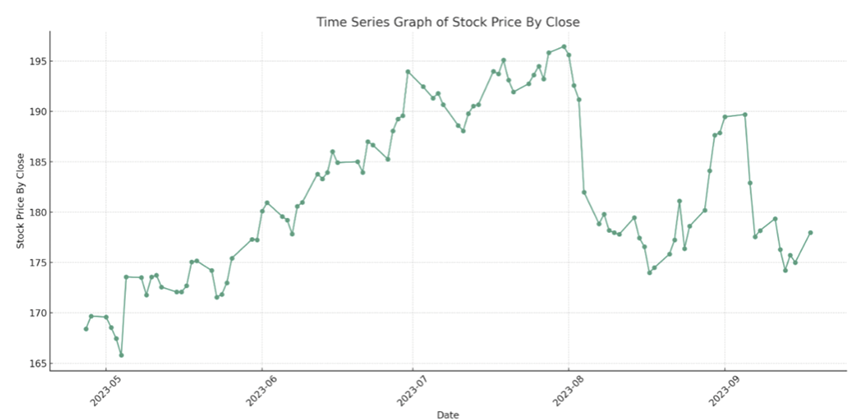
Figure 1. Stock by Close as a Function of Time.
According to the Figure 1, the financial markets are a theater of volatility, with stock prices constantly dancing to the tunes of supply and demand. Fig1 captures this dance, highlighting the peaks and valleys that characterize stock price movements. The fluctuations observed in the graph are not anomalies; they are intrinsic features of financial markets, reflecting the ongoing tussle between bullish and bearish sentiments. This volatility, however, is not without patterns. The stock price’s predilection for the 180-dollar mark is a pattern worth noting. It suggests a level of resistance, a gravitational pull that the stock price seems to adhere to. This observation is invaluable for forecasters and investors, as it provides a tangible reference point for future predictions. The implications of this volatility are manifold. For traders, it represents an arena of opportunities, a chance to profit from short-term price movements. For long-term investors and analysts, it underscores the importance of having a robust predictive model, a tool that can navigate the turbulent waters of the stock market and provide reliable forecasts(Figure 2, 3).
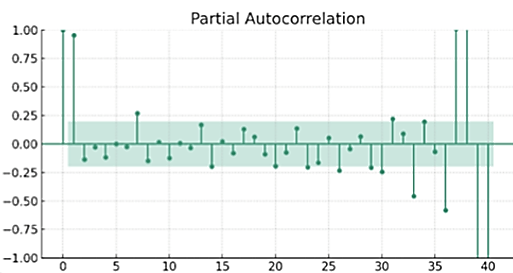
Figure 2. Stock Price by Close Acf Graph.
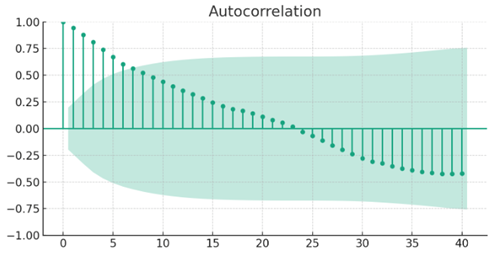
Figure 3. Stock Price By Close PAcf Graph.
Understanding the internal structures of time series data is paramount for accurate forecasting, and this is where ACF and PACF plots come into play. Fig 2 presents these plots, offering a window into the data’s soul. The ACF plot, with its gradual decline, tells a story of diminishing influence, highlighting how past values progressively lose their grip on future values. The PACF plot in Fig 3 complements this story, showcasing a sharp drop after a certain lag. This drop is not just a visual cue; it’s a directive, guiding modelers towards simpler, more efficient autoregressive models. The sharpness of the drop is a feature, not a bug, highlighting the initial lags’ significance and rendering subsequent lags redundant. Ensuring that these plots are presented distinctly is not just a matter of aesthetics; it’s a matter of clarity. It allows for a focused analysis, ensuring that the nuances of autocorrelation are not lost in translation.
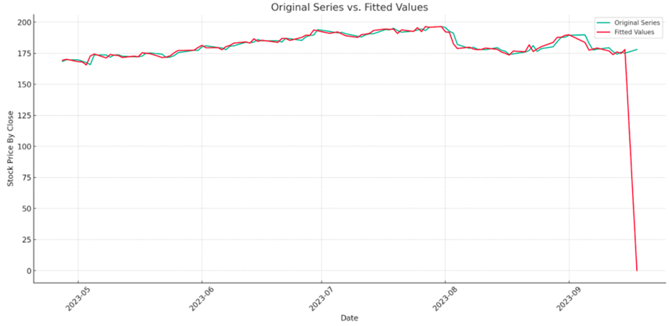
Figure 4. ARIMA model results.
Figure 4 provides a visual evaluation of the ARIMA model, juxtaposing the observed stock prices with the model’s predictions. The blue line, represents the actual market behavior, and the red line, represents the ARIMA model’s predictions, dance in harmony, highlighting the model’s aptitude in capturing the stock’s essence. This visual harmony translates to trust, instilling confidence in the model’s predictive capabilities. The cost of the ARIMA model, estimated at around 175 dollars, is not just a validation of its accuracy; it’s a testament to its precision, showcasing its ability to provide reliable forecasts that resonate with the market’s realities. The journey through stock price volatility, autocorrelation analysis, and ARIMA model evaluation culminates in a holistic understanding of stock price behaviors. This understanding is not superficial but deep-rooted, grounded in rigorous analysis and keen observation. This comprehensive view is a beacon, guiding forecasters and investors through the labyrinth of financial markets. It ensures that predictions are not just educated guesses; they are informed, well-founded forecasts that stand the test of time. By integrating insights across different dimensions of analysis, we ensure that our understanding is robust, our predictions are reliable, and our strategies are sound. This is not just analysis; this is enlightenment, a clarity that empowers us to confidently navigate the future.
4. Conclusion
The present analysis explores the factors that might play pivotal roles in forecasting Apple's future stock prices utilizing the ARIMA (Autoregressive et al.) model. The outcomes suggest that certain variables, such as market trends, technological advancements, and competitive dynamics, may have substantial bearings on Apple's stock price trajectory. However, some nuances were brought to light. Given the historical data utilized, it was recognized that this model may harbor inaccuracies due to inherent limitations, like the exclusion of real-time market shocks or unforeseeable macroeconomic shifts. The sample data didn't encapsulate all possible market conditions or global economic changes, lending a degree of skepticism to the model's precision.
Nonetheless, the merits of this investigation are manifold and entirely instrumental. Firstly, this study embarks on an analytical journey using the ARIMA model, a method laden with empirical rigor, to dissect the potential underpinnings of Apple's stock price movements. This analytical paradigm brings a fresh perspective to financial forecasting and unveils a visually intuitive manner to comprehend the complex interplay of variables at hand. Instead of a univariate analysis often seen in prior studies, a more encompassing multivariate analysis was adopted, thereby enriching the analytical depth of this endeavor. Secondly, the insights garnered herein could be monumental for investors, financial analysts, and stakeholders, providing them with a nuanced understanding of the probable directional cues of Apple's stock prices.
Moreover, the study opens the portals to a plethora of subsequent investigations. For instance, exploring the congruency of the ARIMA model with real-time data or juxtaposing it with other predictive models could unearth a treasure trove of understanding, potentially leading to more robust predictive frameworks. Through the lens of continuous improvement, the findings and methodologies employed in this study are not just a culmination but a commencement, steering the discourse towards a more nuanced and holistic understanding of financial market dynamics.
References
[1]. Chandar S, Sumathi M and Sivanandam S 2016 Prediction of Stock Market Price using Hybrid of Wavelet Transform and Artificial Neural Network. Hydrological sciences journal.
[2]. Rouf N, et al. 2022 Impact of Healthcare on Stock Market Volatility and Its Predictive Solution Using Improved Neural Network. Statistical Mechanics and its Applications.
[3]. Alshammari B M, et al. 2022 Stock market prediction by applying big data mining. Machine Learning and Applications.
[4]. Patil N R, et al. SMAP - A Stock Market Analysis and Prediction Web Application. Working paper.
[5]. Nti I K, et al. 2019 Random Forest Based Feature Selection of Macroeconomic Variables for Stock Market Prediction. Social Science Electronic Publishing.
[6]. Strader T, et al. 2020 Machine Learning Stock Market Prediction Studies: Review and Research Directions. Journal of International Technology and Information Management.
[7]. Saxena U R, Parth S and Gaurav G 2022 Comprehensive Study of Machine Learning Algorithms for Stock Market Prediction during COVID-19. Working paper.
[8]. Rouf N, et al. 2021 Stock Market Prediction Using Machine Learning Techniques: A Decade Survey on Methodologies, Recent Developments, and Future Directions. International Journal of Scientific Research in Computer Science Engineering and Information Technology.
[9]. Koukaras P, et al. 2020 Stock Market Prediction Using Microblogging Sentiment Analysis and Machine Learning. Advances in Intelligent Systems and Computing.
[10]. Marian P R. 2022 Using Market News Sentiment Analysis for Stock Market Prediction. Working paper.
Cite this article
Liu,X. (2023). Predicting Apple’s future stock price using ARIMA model. Theoretical and Natural Science,26,209-214.
Data availability
The datasets used and/or analyzed during the current study will be available from the authors upon reasonable request.
Disclaimer/Publisher's Note
The statements, opinions and data contained in all publications are solely those of the individual author(s) and contributor(s) and not of EWA Publishing and/or the editor(s). EWA Publishing and/or the editor(s) disclaim responsibility for any injury to people or property resulting from any ideas, methods, instructions or products referred to in the content.
About volume
Volume title: Proceedings of the 3rd International Conference on Computing Innovation and Applied Physics
© 2024 by the author(s). Licensee EWA Publishing, Oxford, UK. This article is an open access article distributed under the terms and
conditions of the Creative Commons Attribution (CC BY) license. Authors who
publish this series agree to the following terms:
1. Authors retain copyright and grant the series right of first publication with the work simultaneously licensed under a Creative Commons
Attribution License that allows others to share the work with an acknowledgment of the work's authorship and initial publication in this
series.
2. Authors are able to enter into separate, additional contractual arrangements for the non-exclusive distribution of the series's published
version of the work (e.g., post it to an institutional repository or publish it in a book), with an acknowledgment of its initial
publication in this series.
3. Authors are permitted and encouraged to post their work online (e.g., in institutional repositories or on their website) prior to and
during the submission process, as it can lead to productive exchanges, as well as earlier and greater citation of published work (See
Open access policy for details).
References
[1]. Chandar S, Sumathi M and Sivanandam S 2016 Prediction of Stock Market Price using Hybrid of Wavelet Transform and Artificial Neural Network. Hydrological sciences journal.
[2]. Rouf N, et al. 2022 Impact of Healthcare on Stock Market Volatility and Its Predictive Solution Using Improved Neural Network. Statistical Mechanics and its Applications.
[3]. Alshammari B M, et al. 2022 Stock market prediction by applying big data mining. Machine Learning and Applications.
[4]. Patil N R, et al. SMAP - A Stock Market Analysis and Prediction Web Application. Working paper.
[5]. Nti I K, et al. 2019 Random Forest Based Feature Selection of Macroeconomic Variables for Stock Market Prediction. Social Science Electronic Publishing.
[6]. Strader T, et al. 2020 Machine Learning Stock Market Prediction Studies: Review and Research Directions. Journal of International Technology and Information Management.
[7]. Saxena U R, Parth S and Gaurav G 2022 Comprehensive Study of Machine Learning Algorithms for Stock Market Prediction during COVID-19. Working paper.
[8]. Rouf N, et al. 2021 Stock Market Prediction Using Machine Learning Techniques: A Decade Survey on Methodologies, Recent Developments, and Future Directions. International Journal of Scientific Research in Computer Science Engineering and Information Technology.
[9]. Koukaras P, et al. 2020 Stock Market Prediction Using Microblogging Sentiment Analysis and Machine Learning. Advances in Intelligent Systems and Computing.
[10]. Marian P R. 2022 Using Market News Sentiment Analysis for Stock Market Prediction. Working paper.