


1. Introduction
1.1. Black hole in universe
Einstein’s General Theory of Relativity, proposed in 1915, elucidates how mass and energy curve spacetime and therefore explains the structure and evolution of the universe. This theory revolutionized our understanding of the relationships between time, space, and gravity. In a matter of a few weeks following its formulation, Karl Schwarzschild successfully tackled Einstein’s field equations of General Relativity, yielding a pivotal result—the Schwarzschild radius:
\( {R_{s}}=\frac{2GM}{{c^{2}}} \) (1)
The Schwarzschild radius delineates a critical threshold: when mass is compressed to a size smaller than its Schwarzschild radius, a black hole forms, indicating gravity’s supremacy to the extent that even light cannot escape. Building upon this insight, Schwarzschild formulated the Schwarzschild metric:
\( d{s^{2}}=-(1-\frac{{r_{s}}}{r}){c^{2}}d{t^{2}}+\frac{1}{1-\frac{{r_{s}}}{r}}d{r^{2}}+{r^{2}}d{Ω^{2}} \) (2)
This mathematical expression describes the spacetime geometry around a black hole, allowing us to grasp the gravitational characteristics of black holes. In summary, Schwarzschild’s contributions lay the foundation for understanding black holes and the fundamentals of General Relativity.
However, the idealized assumptions of spherical symmetry in the Schwarzschild metric and Kerr Black Hole solution limit their representation of black hole behavior. In the 1970s, Dr. Roger Penrose introduced the concept of ‘trapped surfaces,’ transcending these assumptions by demonstrating that all light rays on the trapped surface converge towards the center, marking the singularity of a black hole—the boundary where space and time cease to exist. This achievement profoundly confirmed the existence of black holes and the robustness of Einstein’s theory of general relativity. It earned him the Nobel Physics Prize “for the discovery that black hole formation is a robust prediction of the general theory of relativity” in 2020 [1]. Advancing technology enabled astronomers to detect two black holes via radio observations (Figure 1) at the centers of the M87 galaxy and the Milky Way’s Sagittarius A*.
|
|
The SMBH situated at the core of the M87 galaxy is positioned approximately 55 million light-years from Earth and possesses a diameter of roughly 38 billion kilometers. | The SMBH situated at the heart of the Milky Way galaxy is positioned about 26,000 light-years from Earth and has a diameter of approximately 23.6 million kilometers. |
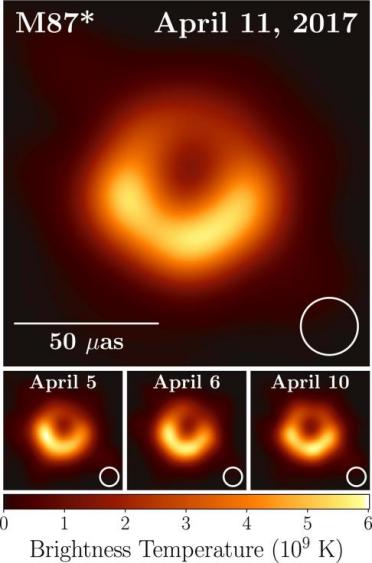
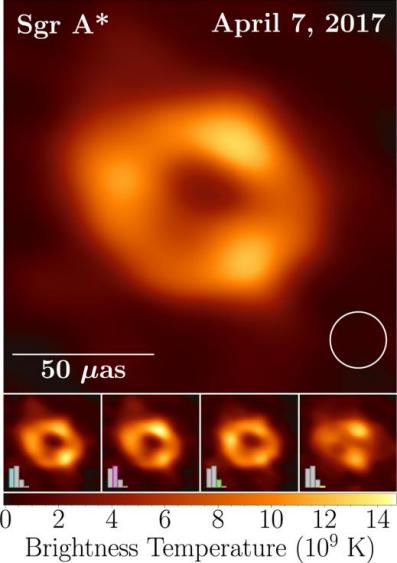
Figure 1. The central region is the actual black hole “shadow,” while the surrounding luminous ring results from high-energy material heated, accelerated, and emitting radio radiation within the intense gravitational field of the black hole [2].
1.2. Active Black Holes in Galaxies
The discovery of quasars in the 1960s is a major breakthrough in astronomy. Quasars are incredibly luminous and constantly emit light, outshining entire galaxies. Quasars’ brightness results from the gravitational collapse of swirling gas around them, forming massive accretion disks with high-energy nuclear reactions and particle production, making them among the brightest and most enduring sources of radiation in the universe. These black holes, ranging from millions to billions of solar masses, exert immense gravitational forces and interact with their surroundings, leading to various phenomena.
1.2.1. Accretion Disk. The accretion disk around SMBHs consists of significant gas and dust, pulled in by gravity toward the black hole’s vicinity. As the material gradually collapses from the outer parts of the accretion disk to its inner regions, it generates intense friction and compression. In this process, the material heats up to extremely high temperatures, releasing substantial energy. This energy is propagated in various wavelengths of radiation, including visible light, ultraviolet, and X-rays.
1.2.2. Emission Lines. The gas within the accretion disk generates various spectral lines at high temperatures, such as the Balmer series lines of hydrogen and emission lines of helium, as well as both broad and narrow emission lines. By analyzing these spectral lines, astronomers can glean insights into the properties of the material surrounding the black hole, including its motion and temperature.
1.2.3. Jets. Certain SMBHs near the cores of active galaxies generate jets, high-speed streams of charged particles ejected from the black hole’s poles. These jets are observed in radio wavelengths and extend over significant distances. The origin of these jets is intricately linked to factors like the black hole’s spin, magnetic fields, and interactions with the material within the accretion disk.
1.2.4. Variability. The radiations from the cores of active galaxies often exhibit pronounced variability, where the brightness changes over time. This variability may result from the unstable motion of material within the accretion disk, causing fluctuations in the released energy.
1.2.5. Unified Model of Active Galactic Nuclei. The Unified Model of Active Galactic Nuclei (AGN) (Figure 2) characterizes quasars as a specific type of AGN dominated by SMBHs surrounded by an accretion disk of gas. When the central black hole accretes matter from the disk, a substantial amount of energy is released in the form of electromagnetic radiation, covering the entire electromagnetic spectrum. Meanwhile, in radio galaxies, emission lines and jets are typically associated with the Unified Model of AGN. In this model, emission lines and jets are often considered to be caused by the activity of the central black hole in the AGN. Emission lines are radiation lines emitted by the material in the accretion disk and are typically visible in the visible and X-ray spectra. Jets, on the other hand, are powerful streams of matter and energy emitted from the central black hole of the AGN, extending into the cosmos. They contain high-energy particles and produce intense radio emissions.
| Figure 2. Accretion disk surrounds the central black hole, assuming a flat, disk-like shape. The broad emission line region, located closer to the core of the AGN, produces broad spectral lines due to high gas velocities and turbulence, often associated with intense activity, like the accretion disk. The narrow emission line region, farther from the central black hole, contributes to narrow spectral lines, as gas moves at lower velocities and is less turbulent. The jet extends outward from the AGN’s core, often moving at relativistic speeds [3]. |
1.3. Observation of the Gas in Quasars
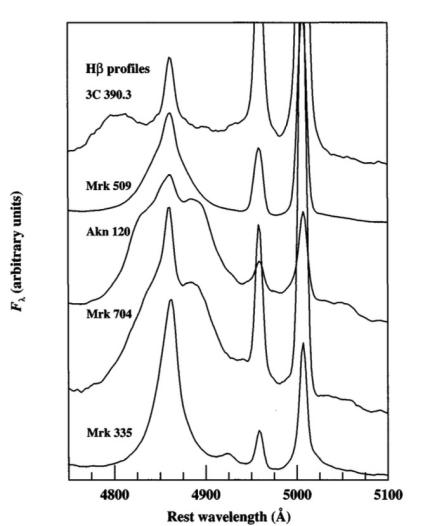
High-speed gas motion is essential for studying AGN, specifically the broad emission lines in quasar spectra, with velocities around 5000 \( km/s \) , revealing gas speed and AGN’s internal structure. Broad emission lines result from Doppler effect, where gas motion velocities are directly proportional to line widths in the spectra. Figure 3 depicts emission line profiles, elucidating the impact of high-speed gas motion on AGN’s internal processes.
| Figure 3. The H \( β \) emission-line profiles in the spectra of these five AGNs provide insight into the diversity observed in broad-line profiles. Each spectrum represents an average of numerous individual spectra collected over several months [4]. |
1.4. The Gas as Inflows feeding Black Holes
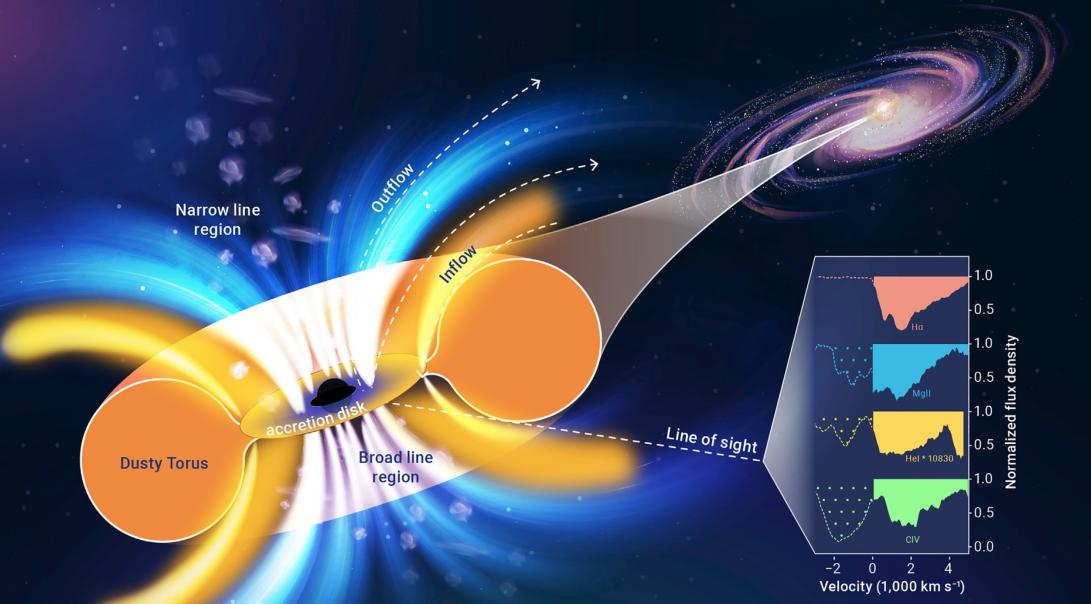
Analyzing quasar spectra reveals substantial gas along the line of sight, providing insights into gas properties and dynamics. This technique allows us to observe inflows towards SMBHs. Hydrogen Balmer lines and metastable neutral helium multiples are valuable for studying cold, dense gas due to their resistance to saturation. The strength of hydrogen lines correlates with electron density and ionization parameter, while helium lines primarily depend on the ionization parameter. Joint analysis of these lines provides information on electron density, ionization parameter, and the absorber’s distance from the central ionizing source. Recent experiments identified redshifted H I and He I* BALs in a subset of eight quasars, notably J1035 + 2422 (Figure 4), exhibited a wide Doppler velocity structure, suggesting radial inward gas motion towards the SMBH accretion disk. Taking non-pure radial free-fall motion into account, the derived distance from the innermost gas to the SMBH serves as an upper limit. Photo-ionization modeling confirms this result from the simplified dynamical analysis, further constraining the distance of inflows to the SMBH as R \( ∼ \) 1000 gravitational radii, near the quasar’s accretion disk outer edge. Redshifted H I and He I* BALs provide compelling evidence of massive inflows fueling SMBH accretion disks and sustaining quasar luminosity [5].
| Figure 4. The spectrum of quasar J1035 + 2422 reveals redshifted H I and He I* BALs, indicating significant amounts of cold, dense, high-column-density infalling gas with a wide Doppler velocity structure. This supports the idea of massive inflows directly feeding the quasar’s accretion disk [5]. |
2. Theory
2.1. Structure of Hydrogen atoms
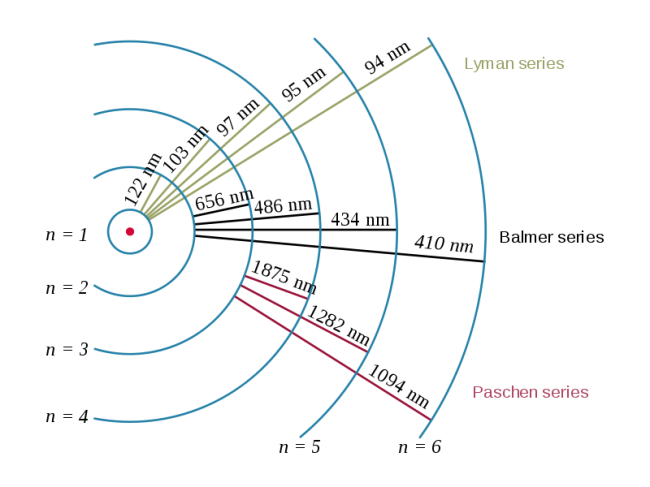
The hydrogen atom consists of a nucleus with a proton and an orbiting electron. Electrons occupy energy levels determined by the principal quantum number ( \( n \) ). Electron energy level changes in hydrogen result in the emission or absorption of photons at specific frequencies, creating distinct hydrogen emission lines with unique wavelengths. Figure 5 shows Lyman, Balmer, and Paschen series.
| Figure 5. This figure provides an overview of the hydrogen atom’s structure, electron transitions, and characteristic wavelengths of hydrogen emission lines. It includes the Lyman series, Balmer series, and Paschen series, illustrating the energy level shifts within the hydrogen atom [6]. |
In the Bohr model, electrons orbit the nucleus in different energy levels denoted by integer values of \( n \) . The Balmer series is crucial for hydrogen spectroscopy, involving transitions from higher energy levels ( \( n \gt 2 \) ) to \( n=2 \) . The emitted photon’s frequency can be described by the Rydberg formula:
\( \frac{1}{λ}={R_{H}}(\frac{1}{{2^{2}}}-\frac{1}{{n^{2}}}) \) (3)
Here, \( λ \) represents the wavelength of the spectral line, \( {R_{H}} \) is the Rydberg constant, and \( n \) is an integer representing the energy level to which the electron transitions. Notable lines include:
1. H \( α \) : Transition from \( n=3 \) to \( n=2 \) , with a wavelength of 656.3 nm, appearing as red.
2. H \( β \) : Transition from \( n=4 \) to \( n=2 \) , with a wavelength of 486.1 nm, appearing as blue.
Furthermore, Boltzmann distribution relates particle distribution across energy levels to temperature and energy level differences, described by a formula:
\( \frac{{N_{i}}}{{N_{j}}}=\frac{{g_{i}}}{{g_{j}}}{e^{-\frac{{E_{i}}-{E_{j}}}{kT}}} \) (4)
Where \( {N_{i}} \) and \( {N_{j}} \) are the number of particles in energy levels \( i \) and \( j \) . \( {g_{i}} \) and \( {g_{j}} \) are the degeneracies of these energy levels (indicating how many microstates correspond to each level). \( {E_{i}} \) and \( {E_{j}} \) are the energies of levels \( i \) and \( j \) . - \( k \) is the Boltzmann constant. \( T \) is the absolute temperature.
The Boltzmann distribution indicates that more particles reside at lower energy levels, making Balmer lines more likely to be observed since they involve a larger number of stable, lower-energy state particles. Furthermore, Balmer lines fall within the visible spectrum and exhibit a moderate intensity. Consequently, for a clearer spectral signal, our preference is to concentrate on the Balmer line series.
2.2. Doppler Effect
The Doppler effect is a fundamental phenomenon in electromagnetics. When a light source and an observer approach each other, the frequency of electromagnetic waves increases, leading to a blueshift in the light, while when they move apart, the frequency decreases, causing a redshift.
\( f \prime =\frac{f}{1+\frac{{v_{o}}\cdot cos(θ)}{c}} \) (6)
\( f \prime \) denotes the frequency, while \( f \) represents the frequency emitted by the source of light. The variable \( c \) represents the speed of light in a vacuum, \( {v_{o}} \) denotes the velocity of the observer, and \( θ \) represents the angle between the direction of observer’s motion and direction of the incident light wave.
Conversely, the Doppler wavelength change focuses on alterations in wavelength. As the source and observer move relative to each other, the wavelength of the wave also changes, expressed by the formula:
\( \frac{Δλ}{λ}=\frac{{v_{o}}-{v_{s}}}{v} \) (7)
\( Δλ \) represents the wavelength change, \( λ \) is the original wavelength, and other symbols have the same meanings as above.
In the context of quasar spectra, the Doppler effect’s application is particularly significant. The width of emission lines in quasar spectra is correlated with the speed of gas molecules. Gas molecules moving at various speeds generate spectral lines with distinct Doppler frequency shifts, resulting in broader lines.
2.3. Broad Line Regions in Quasars
The Broad Emission Line Region (BELR) (Figure 6) in AGN is crucial for understanding AGN’s internal processes and the central black hole. It is characterized by exceptionally wide emission lines, such as H \( α \) and H \( β \) , with line widths exceeding thousands of kilometers per second. These broad lines suggest the presence of high-speed gas clouds, possibly influenced by rapid rotation around the central SMBH or intense radiation and high-velocity winds from the black hole vicinity.
Theoretical models of the BELR involve the accretion of matter onto a SMBH, which leads to the excitation of high-energy electrons. These electrons collide with surrounding gas clouds, resulting in the emission of spectral lines. Additionally, the accretion process generates radiation pressure, which can create powerful winds that affect the formation of emission lines. While the Rotating Cloud Model is widely accepted, direct observational evidence is lacking, leaving room for alternative models such as the Blowing Clouds Model, which suggests that radiation pressure and high-speed flows drive gas clouds away from the core, producing broad emission lines without dependence on gas rotation.
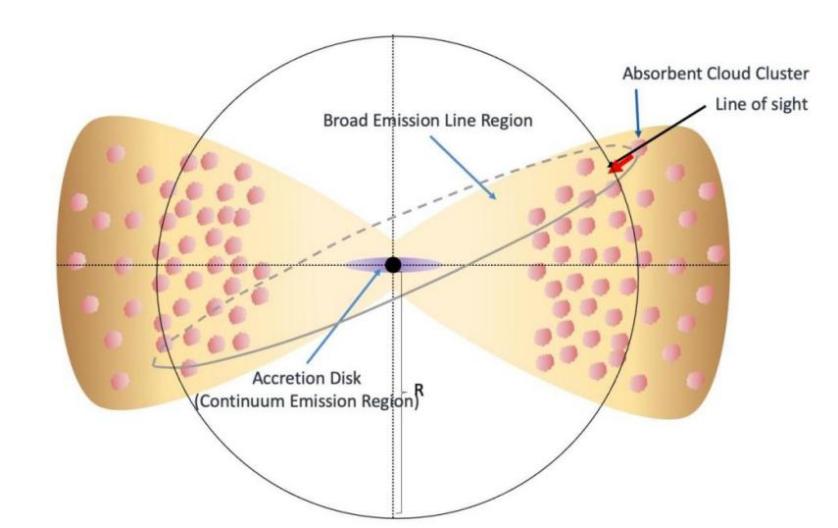
Figure 6. The axial cross-section diagram for the structure of Broad Mission Line Region.
3. Data Analysis
All data in this section is sourced from Sloan Digital Sky Survey (SDSS) DR18 [7].
3.1. Survey for Hydrogen Balmer Absorptions in Quasar Spectra
Obtain 750,414 quasar spectra from the SDSS DR18 database, followed by redshift correction and in-depth analysis of absorption features.
3.1.1. Redshift Measurement and Correction. To compare the spectral data with standard wavelengths, the observed wavelengths need to be converted to actual wavelengths.
3.1.2. Spectral Target Selection. We developed a program utilizing advanced queries on coordinates, luminosity, and redshift to filter spectral targets, reducing the pool for research to approximately 3,000.
3.1.3. Absorption Feature Analysis and Physical Modeling. For the selected targets, the spectral images with specific absorption line wavelengths from the database are zoomed in and traversed using programs.
• Characterization of Components: Further characterization of the components of the absorption lines was undertaken, encompassing parameters such as line width, depth, relative strength.
• Comparative Analysis with Databases: Rigorous spectral characterization comparisons are made with databases containing a wide range of elemental and molecular spectral signatures.
After screening, dozens of spectra with typical quasar spectral characteristics are obtained.
3.1.4. Spectral Compilation and Identification of Variable Spectra. We organized the selected dozens of spectra and observed that the same quasar had been observed multiple times at different time intervals. Among these spectra, three targets exhibited significant variations over several decades. These three targets are as follows: SDSS J0247-0714, SDSS J0948+4335, and SDSS J0957+3030.
3.2. Discovery of Variable Balmer Absorptions in Three Quasars
During the process of absorption line spectroscopic exploration, we have noticed 3 celestial objects with rare Balmer absorption lines being observed multiple times. Distinct emission and absorption lines are visible at the wavelengths of H \( α \) (6564.61) and H \( β \) (4862.68). These absorption lines exhibited significant variations in different time observations, a novel phenomenon.
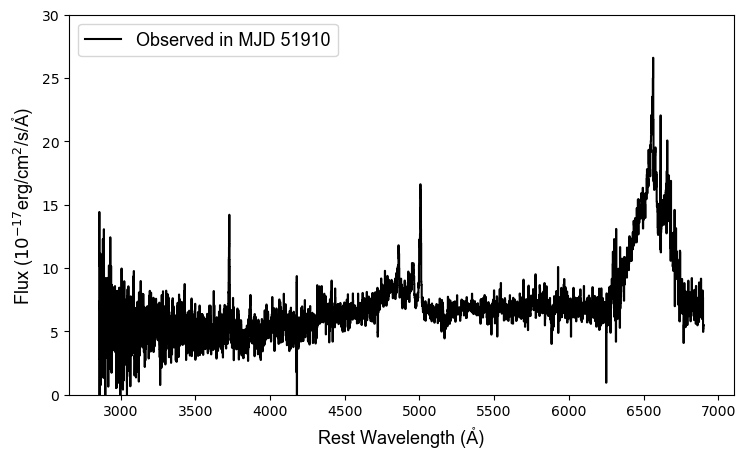
3.2.1. SDSS J0247-0714. The spectral images here for SDSS J0247-0714 (Figure 7) show a redshift of 0.33488 and were captured on MJD 51910, which corresponds to January 1, 2001.
| Figure 7. The spectrum of SDSS J0247-0714, observed on MJD 51910 (January 1, 2001), displays a redshift of 0.33488. |
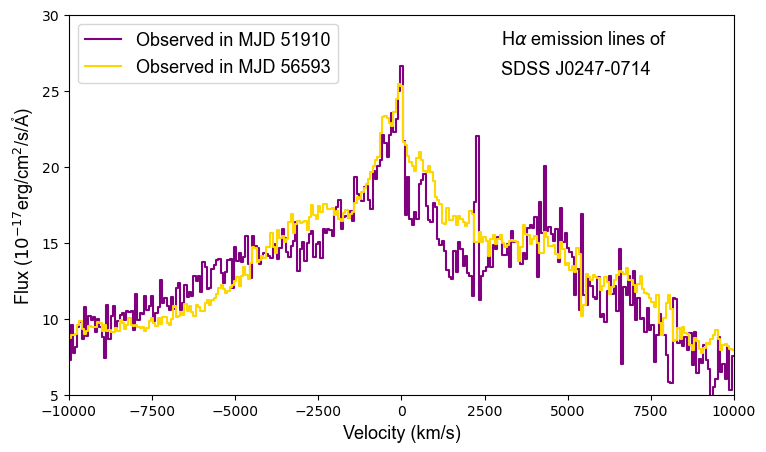
The following images (Figure 8) display observations of the quasar SDSS J0247-0714. From these images, we can clearly see that the emission lines have hardly changed, but the depth of the absorption lines has significantly decreased within the range of \( -3000 \) to \( 2500 km/s. \)
| Figure 8. The changes in absorption features of H \( α \) emission lines in SDSS J0247-0714, observed on MJD 51910 (January 1, 2001) and MJD 56593 (October 28, 2013), respectively. |
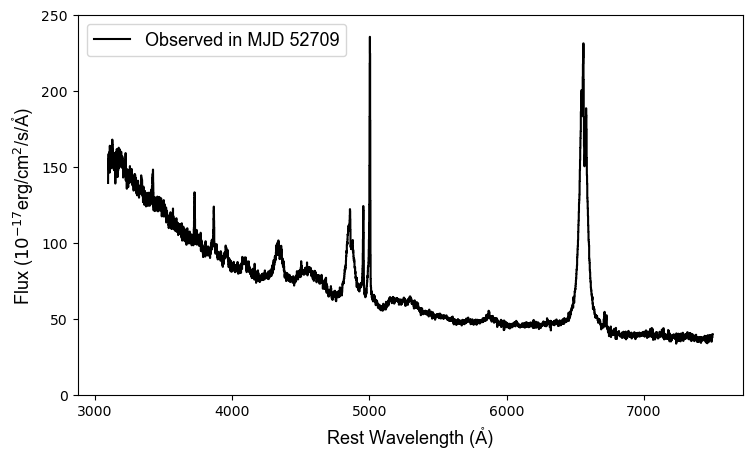
3.2.2. SDSS J0948+4335. The spectral images for SDSS J0948+4335 (Figure 9) show a redshift of 0.22760 and were captured on MJD 52709, which corresponds to March 11, 2003.
| Figure 9. The spectrum of SDSS J0948+4335, observed on MJD 52709 (March 11, 2003), displays a redshift of 0.22760. |
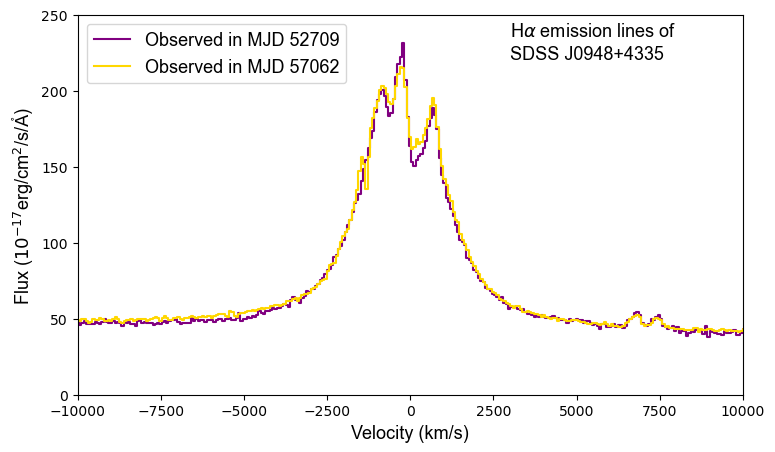
The following images (Figure 10) display observations of the quasar SDSS J0247-0714. From these images, we can clearly see that the emission lines have hardly changed, but the depth of the absorption lines has significantly decreased within the range of \( -2000 \) to \( 2000 km/s \) .
| Figure 10. The changes in absorption features of H \( α \) emission lines in SDSS J0948+4335, observed on MJD 52709 (March 11, 2003) and MJD 57062 (February 9, 2015). |
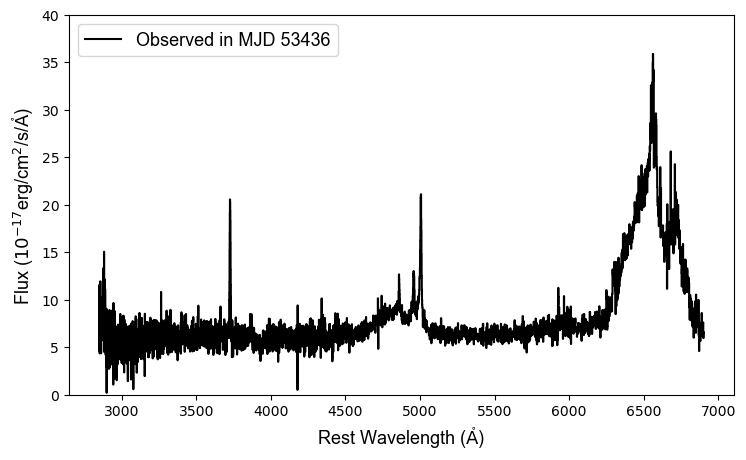
3.2.3. SDSS J0957+3030. The spectral images for SDSS J0957+3030 (Figure 11) show a redshift of 0.33518 and were captured on MJD 53436, which corresponds to March 7, 2005.
| Figure 11. The spectrum of SDSS J0957+3030, observed on MJD 53436 (March 7, 2005), displays a redshift of 0.33518. |
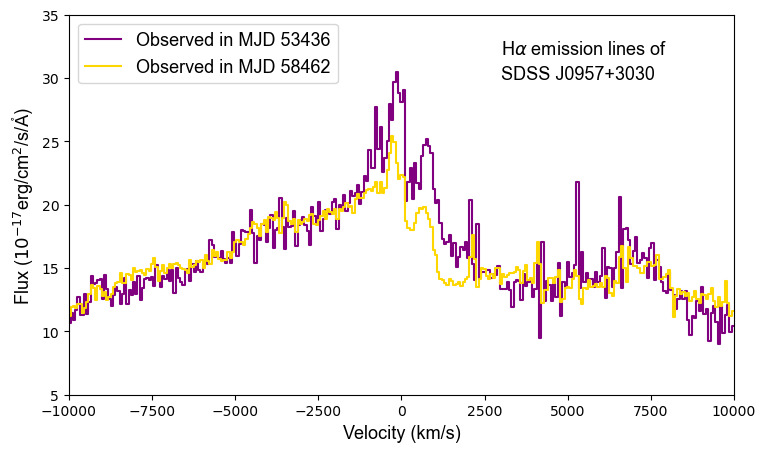
The following images (Figure 12) display observations of the quasar SDSS J0957+3030. From these images, we can clearly see that the emission lines have hardly changed, but the depth of the absorption lines has significantly decreased within the range of \( -4000 \) to \( 3000 km/s \) .
| Figure 12. The changes in absorption features of H \( α \) emission lines in SDSS J0957+3030, observed on MJD 53436 (March 7, 2005) and MJD 58462 (December 10, 2018). |
3.3. Measurements of the Velocity of Broad Line Region Clouds
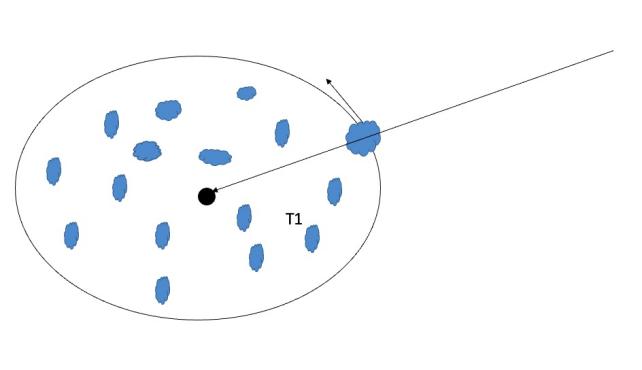
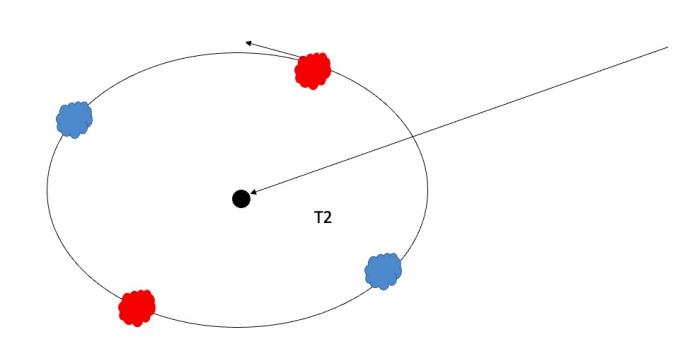
In the rotating cloud model, absorption lines are generated by the broad-line region as the background light source. Yellow disks in Figure 13 represent emission clouds, while red clouds signify absorption clouds. Similar to the way Mercury passing in front of the Sun causes variations in luminosity, known as “variability,” absorption clouds passing through the broad-line region induce similar light changes. Analyzing the timing of this variability allows us to estimate cloud rotational motion velocity.
|
|
Broad Line Region (BLR) Structure Profile Along the Line of Sight. | The yellow disks represent emission clouds, while the red clouds represent absorption clouds. |
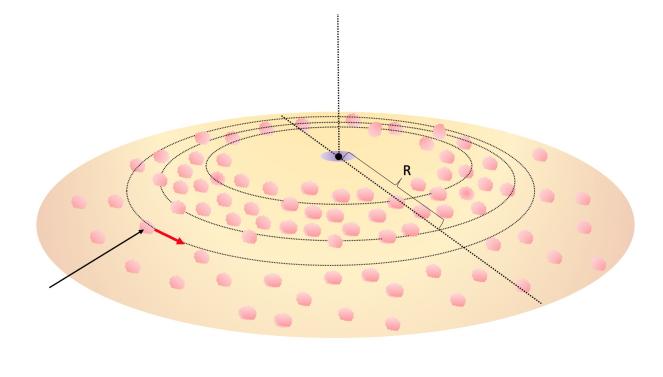
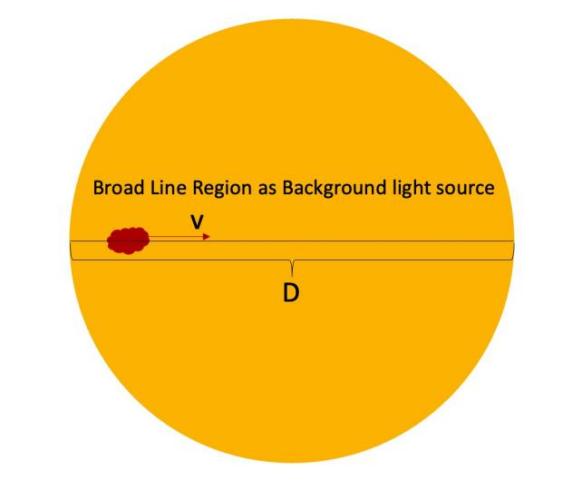
Figure 13. Absorption clouds crossing BLER cause luminosity changes, known as “variability”.
3.3.1. Data Processing Methods
3. Calculate the time difference between the two observations:
\( Δt={MJD_{B}}-{MJD_{A}} \) (8)
Here \( Δt \) represents the time interval between the two spectroscopic observations (in days), \( {MJD_{A}} \) and \( {MJD_{B}} \) respectively represent the Modified Julian Date of the first and second observations. To convert this time interval to seconds, we can use the following equation: \( t=Δt×24×60×60 \) .
4. We can determine the dimensions of the background light source by using the formula that relates luminosity to the size of the broad-line region (L-R) in active galactic nuclei.
\( \frac{{R_{BLR}}}{10ldys}=(2.23±0.21){[\frac{{λL_{λ}}(5100Å)}{{10^{44}}ergs {s^{-1}}}]^{-0.69±0.05}} \) (9)
\( {R_{BLR}} \) represents the size of the BLR in units of light-days, while \( {λL_{λ}}(5100Å) \) denotes the luminosity at a wavelength of 5100 Å, expressed in units of \( ergs{s^{-1}} \) as energy flux. \( 10ldys \) is the standard unit for measuring the size of the BLR. The exponents, \( 2.23±0.21 \) and \( 0.69±0.05 \) , signify the power and index governing the relationship between \( {R_{BLR}} \) and \( {λL_{λ}}(5100Å) \) , respectively [8].
5. Calculate the velocity of the cloud cluster’s motion,
\( v=\frac{2×{R_{BLR}}×c×24×60×60}{t} \) (10)
Here, \( c \) represents the speed of light approximately equal to \( 3×{10^{5}} km/s \) . The variable \( v \) denotes the velocity of the cloud cluster’s motion, measured in \( km/s \) .
3.3.2. Example Calculation Procedure. Let’s begin with the calculation for J0247-0741: Calculating the time difference between the two observations:
\( t=(56593-51910)×24×60×60=4.0×{10^{8}}s \)
Then, substituting the known values into the formula to calculate cosmological distances, the \( {R_{BLR}} \) of BLR: 26.6 light days. Finally, we calculate the velocity of the cloud cluster’s motion:
\( v=\frac{2×{R_{BLR}}×3×{10^{5}}×24×60×60}{t}=3407.57762825735=3400 km/s \)
Repeat the same steps for the other two targets, J0948+4335 and J0957+3030, and we get:
Table 1. The Measurements of 3 Quasars
Spectrum | Time (s) | Radius of Broad Line Region (light days) | v (km/s) |
J0247-0741 | \( 4.0×{10^{8}} \) | 26.6 | 3400 |
J0948+4335 | \( 3.8×{10^{8}} \) | 66.1 | 9100 |
J0957+3030 | \( 1.6×{10^{8}} \) | 26.6 | 8600 |
4. Discussion
4.1. Two Potential Models for Broad Emission Lines in Quasars
When discussing our experiments, a key challenge was identifying absorptions within complex emissions. We compared spectra under different observational conditions to detect variations, likely caused by moving absorbing clouds. When absorbing clouds crossed our line of sight (Figure 14a), absorption lines appeared, while they were absent when clouds deviated from the line (Figure 14b). Additionally, the emission features observed represent a statistical behavior of a substantial number of cloud formations, and as such, they are expected to exhibit minimal temporal variations.
|
|
Absorption Cloud in Line of Sight | Absorption Cloud Off the Line of Sight |
Figure 14. Two schematic diagrams within the Rotating Cloud Model. | |
Today, scientists utilize the rotating cloud model to measure black hole mass in quasars, a critical aspect of galaxy and cosmology research. Additionally, a novel model, known as the “Outflow Model” (Figure 15b), has been identified. While its suitability for quasars remains uncertain, it exhibits strikingly similar broad-line features in the spectrum akin to those in quasar spectra. In the Outflow Model, a central celestial body emits substantial high-energy radiation, including X-rays, ultraviolet, and visible light, exerting pressure on the surrounding gas. This pressure leads to the formation of a high-speed gas outflow, a phenomenon referred to as radiation pressure driving. As this high-speed gas outflow intersects spectral lines, it interacts with photons, giving rise to absorption lines (when the gas absorbs photons) and emission lines (when the gas re-emits photons) in the spectrum. Notably, the spectra of supernovae (Figure 15a) display broad lines resembling those observed in quasar spectra.
|
|
iPTF13ehe was observed on six different occasions, revealing spectra over time relative to its peak brightness. For the third nebular spectrum taken at \( +278 \) days post-peak, we detected both broad and narrow H \( α \) components [9]. | The outflow model entails high-energy radiation from a central celestial body expelling surrounding gas rapidly. When this outflow intersects with spectral lines, it interacts with photons, causing absorption and emission lines to appear in the spectrum. |
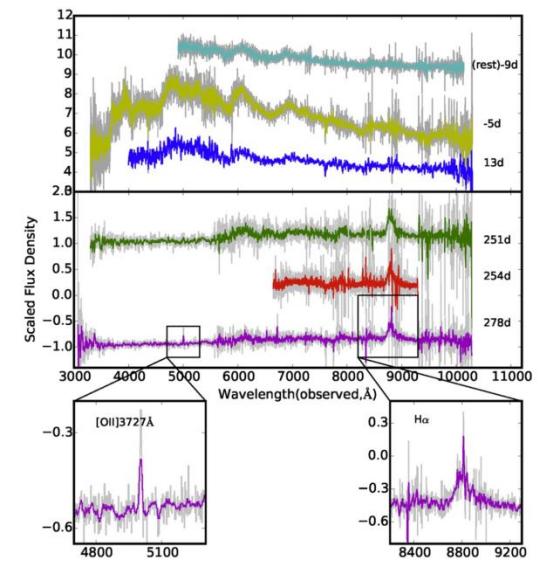
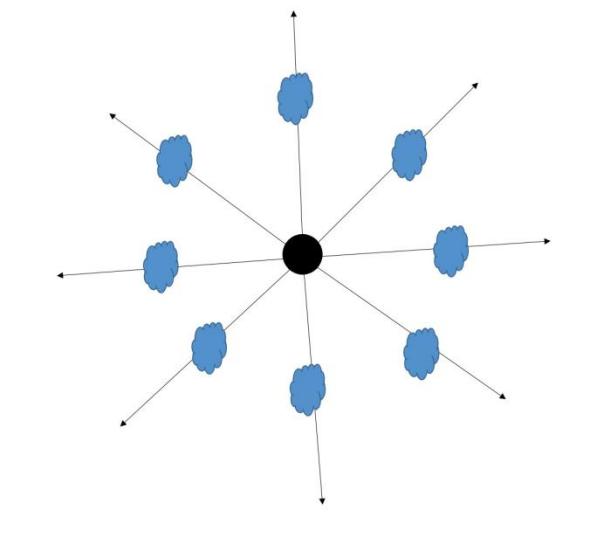
Figure 15. The left image shows the spectral pattern of the iPTF13ehe supernova, resembling quasar spectra with broad lines. The right image depicts the outflow model present in supernova explosions.
4.2. Direct Observation Evidence for Rotating Clouds Model
In our study, we explored absorption line spectroscopy in quasars and discovered variable Balmer absorption lines in three quasars. This unique phenomenon, characterized by significant changes in observed absorption lines over time, was previously undocumented. We conducted a detailed analysis of multiple spectra from these quasars and discussed the factors influencing these spectral variations.
In our pursuit of understanding the underlying physics, we investigated the velocity of broad-line region clouds in section 3.3, employing the rotating cloud model to analyze the impact of absorption clouds on luminosity variability. Our analysis yielded the following velocities for the absorption cloud motion in the three quasars:
6. SDSS J0247-0714: \( 3400 km/s \)
7. SDSS J0948+4335: \( 9100 km/s \)
8. SDSS J0957+3030: \( 8600 km/s \)
According to Peterson, the speed of the wide-line regions of quasars is usually several thousand kilometers per second, which is consistent with our expectations [4]. This suggests that cloud clumps responsible for absorption may also emit radiation, depending on their visibility relative to the background light source. Therefore, we classify this spectrum as that of a quasar. Our study faces the challenge of distinguishing between absorption and complex emission characteristics in quasar spectra, and we explore two potential models to explain the observed broad spectral line features.
The first model used for measuring SMBHs is the rotating cloud model. In this model, the motion of cloud clusters causes variations in quasar spectra. In section 3.2, we present three images (Figure 8, 10, 12) and analyze photometric variability. We observe significant changes in absorption lines at different times. Figure 14 vividly illustrates this phenomenon, showing a noticeable decrease in luminosity when absorbing cloud clusters partially obstruct the emission line region. These images directly confirm the applicability of the rotating cloud model.
Outflow Model, the second model, occurs in supernova explosions (Figure 15a), creating broad lines resembling quasar spectra. This offers an alternative explanation for quasar spectral features. In this model, high-energy radiation from a central celestial body exerts pressure on surrounding gas, causing high-speed gas outflows, known as radiation pressure driving (Figure 15b). When these high-speed gas outflows intersect with spectral lines, they interact with photons, resulting in the appearance of absorption and emission lines in the spectrum. Notably, in this model, the ejected clouds move in straight lines, resulting in constant absorption lines and no variation once a cloud cluster is in the line of sight. This contradicts the finding in section 3.2. Thus, extensive photometric studies confirm the rotation model for broad emission lines in quasars, providing direct observational evidence.
5. Conclusion
This study creatively used quasar absorption lines to investigate individual cloud nature and motion, finding three quasars with hydrogen Balmer absorptions. Over a decade, three quasars showed significant variabilities, rejecting the blowing-wind model, and supporting the rotation model, confirming cloud orbits around central black holes. Rotation velocities of eclipse clouds match expected emission line cloud velocities, providing strong evidence for their similarity.
Acknowledgments
I would like to thank SDSS team for the critical spectral data and my physics teacher, Ms. Erin Ma, for her valuable guidance. This work is entirely independent, including all automated processing codes, and contains no previously published content beyond the cited sources in the References section.
References
[1]. The Nobel Committee for Physics (2020). Theoretical foundation for black holes and the supermassive com-pact object at the Galactic centre.
[2]. Event Horizon Telescope Collaboration et al. (2022). “First Sagittarius A* Event Horizon Telescope Results. I. The Shadow of the Supermassive Black Hole in the Center of the Milky Way”. In: 930.2, L12, p. L12. doi: 10.3847/2041-8213/ac6674.
[3]. Mihos, Chris (2015). AGNschematic. Image retrieved from http://burro.astr.cwru.edu/Academics/ Astr222/Galaxies/Active/unified.html.
[4]. Peterson, Bradley M. (2004). An Introduction to Active Galactic Nuclei. The Pitt Building, Trumpington Street, Cambridge, United Kingdom: THE PRESS SYNDICATE OF THE UNIVERSITY OF CAM-BRIDGE.
[5]. Jiang, Peng et al. (2023). “Tracing the massive inflows feeding super-massive black holes in quasars”. In: The Innovation 4.1, p. 100376. doi: 10.1016/j.xinn.2023.100376.
[6]. Wikipedia contributors (2023). Hydrogen spectral series. Updated on 4 September 2023. url: https://en. wikipedia.org/wiki/Hydrogen_spectral_series.
[7]. Almeida, Andrés et al. (2023). “The Eighteenth Data Release of the Sloan Digital Sky Surveys: Targeting and First Spectra from SDSS-V”. In: 267.2, 44, p. 44. doi: 10.3847/1538-4365/acda98.
[8]. Kaspi, Shai et al. (Aug. 2005). “THE RELATIONSHIP BETWEEN LUMINOSITY AND BROAD-LINE REGION SIZE IN ACTIVE GALACTIC NUCLEI”. In: The Astrophysical Journal 629. Printed in U.S.A., pp. 61–71. doi: 10.1086/431276.
[9]. Yan, Lin et al. (Dec. 2015). “Detection of Broad Hα Emission Lines in the Late-Time Spectra of a Hydrogen- Poor Superluminous Supernova”. In: The Astrophysical Journal 814. 14pp, p. 108. doi: 10.1088/0004- 637X/814/2/108.
Cite this article
Wang,X. (2023). Direct observation evidence for the origin of broad emission lines in quasars: Understanding emission via absorption. Theoretical and Natural Science,26,261-272.
Data availability
The datasets used and/or analyzed during the current study will be available from the authors upon reasonable request.
Disclaimer/Publisher's Note
The statements, opinions and data contained in all publications are solely those of the individual author(s) and contributor(s) and not of EWA Publishing and/or the editor(s). EWA Publishing and/or the editor(s) disclaim responsibility for any injury to people or property resulting from any ideas, methods, instructions or products referred to in the content.
About volume
Volume title: Proceedings of the 3rd International Conference on Computing Innovation and Applied Physics
© 2024 by the author(s). Licensee EWA Publishing, Oxford, UK. This article is an open access article distributed under the terms and
conditions of the Creative Commons Attribution (CC BY) license. Authors who
publish this series agree to the following terms:
1. Authors retain copyright and grant the series right of first publication with the work simultaneously licensed under a Creative Commons
Attribution License that allows others to share the work with an acknowledgment of the work's authorship and initial publication in this
series.
2. Authors are able to enter into separate, additional contractual arrangements for the non-exclusive distribution of the series's published
version of the work (e.g., post it to an institutional repository or publish it in a book), with an acknowledgment of its initial
publication in this series.
3. Authors are permitted and encouraged to post their work online (e.g., in institutional repositories or on their website) prior to and
during the submission process, as it can lead to productive exchanges, as well as earlier and greater citation of published work (See
Open access policy for details).
References
[1]. The Nobel Committee for Physics (2020). Theoretical foundation for black holes and the supermassive com-pact object at the Galactic centre.
[2]. Event Horizon Telescope Collaboration et al. (2022). “First Sagittarius A* Event Horizon Telescope Results. I. The Shadow of the Supermassive Black Hole in the Center of the Milky Way”. In: 930.2, L12, p. L12. doi: 10.3847/2041-8213/ac6674.
[3]. Mihos, Chris (2015). AGNschematic. Image retrieved from http://burro.astr.cwru.edu/Academics/ Astr222/Galaxies/Active/unified.html.
[4]. Peterson, Bradley M. (2004). An Introduction to Active Galactic Nuclei. The Pitt Building, Trumpington Street, Cambridge, United Kingdom: THE PRESS SYNDICATE OF THE UNIVERSITY OF CAM-BRIDGE.
[5]. Jiang, Peng et al. (2023). “Tracing the massive inflows feeding super-massive black holes in quasars”. In: The Innovation 4.1, p. 100376. doi: 10.1016/j.xinn.2023.100376.
[6]. Wikipedia contributors (2023). Hydrogen spectral series. Updated on 4 September 2023. url: https://en. wikipedia.org/wiki/Hydrogen_spectral_series.
[7]. Almeida, Andrés et al. (2023). “The Eighteenth Data Release of the Sloan Digital Sky Surveys: Targeting and First Spectra from SDSS-V”. In: 267.2, 44, p. 44. doi: 10.3847/1538-4365/acda98.
[8]. Kaspi, Shai et al. (Aug. 2005). “THE RELATIONSHIP BETWEEN LUMINOSITY AND BROAD-LINE REGION SIZE IN ACTIVE GALACTIC NUCLEI”. In: The Astrophysical Journal 629. Printed in U.S.A., pp. 61–71. doi: 10.1086/431276.
[9]. Yan, Lin et al. (Dec. 2015). “Detection of Broad Hα Emission Lines in the Late-Time Spectra of a Hydrogen- Poor Superluminous Supernova”. In: The Astrophysical Journal 814. 14pp, p. 108. doi: 10.1088/0004- 637X/814/2/108.