


1. Introduction
The study of population has always been of great significance to China's social development. Chin pointed out that China's population growth is an obstacle to social and economic development [1]. More in-depth research is needed to analyse the conflict between population and modern China's social economy and assess how best to slow down population growth. Philos also concluded that demographic patterns are the causes and effects of human behavior in other important areas, such as survival, cooperation, politics, and culture so that emographics are very difficult to predict, at least in the short term [2].
Today, China's demographic problems are having other effects, such as an aging population, pointed out by Bao [3]. As there are few articles on the Internet about the future population forecast of China, indicating that there is a lack of research in this aspect, however, population problem is an important factor in social development, considering this, this paper A population census is a comprehensive survey conducted by governments to count and collect information about the residents of a country or region. aims to predict the population development trend of China and analyze the characteristics of population change in China in the past several years.
There are many ways to predict population, but given the complexity of the factors affecting population change, it is difficult to assess which method is the most effective in practice. The first way is through Census Data Analysis. A population census is a comprehensive survey conducted by governments to count and collect information about the residents of a country or region [4]. Census data analysis provides a comprehensive and accurate snapshot of a population at a particular point in time, making it a valuable tool for understanding a nation’s composition and needs, as well as for guiding public and private sector decisions [5]. Extrapolation is the second way, it is a statistical and mathematical technique used to make predictions or estimate future values based on existing data or trends [6]. It involves extending or projecting existing data points into the future, assuming that the established trend or pattern will continue [7].
Extrapolation can be a valuable tool for making forecasts and projections, but it should be employed with care and in conjunction with a critical evaluation of the data and context to ensure the reliability of the predictions [8]. The method of using the logistic growth model is also a common approach in demography. The logistic growth model is particularly useful when expecting the population to reach a carrying capacity, meaning a limit to growth based on available resources [9]. Moreover, using the logistic growth model allows us to incorporate the concept of carrying capacity and can be valuable for understanding how populations might stabilize as they approach their maximum sustainable size [10]. However, like all models, it should be used with an understanding of its assumptions and limitations, and in conjunction with other demographic methods for more accurate predictions [11]. To sum up, after consideration and optimization, this paper will use the time series model in R language to analyze the population of China.
2. Methodology
2.1. Data source and preprocessing
The initial step in predicting the Chinese population is to collect historical population data. Reliable sources for this data include government publications, international organizations and academic databases. And this literature, data is collected from Kaggle Website, World Bank and Google Scholar to ensure that the data is accurate, comprehensive, and covers a significant historical time span.
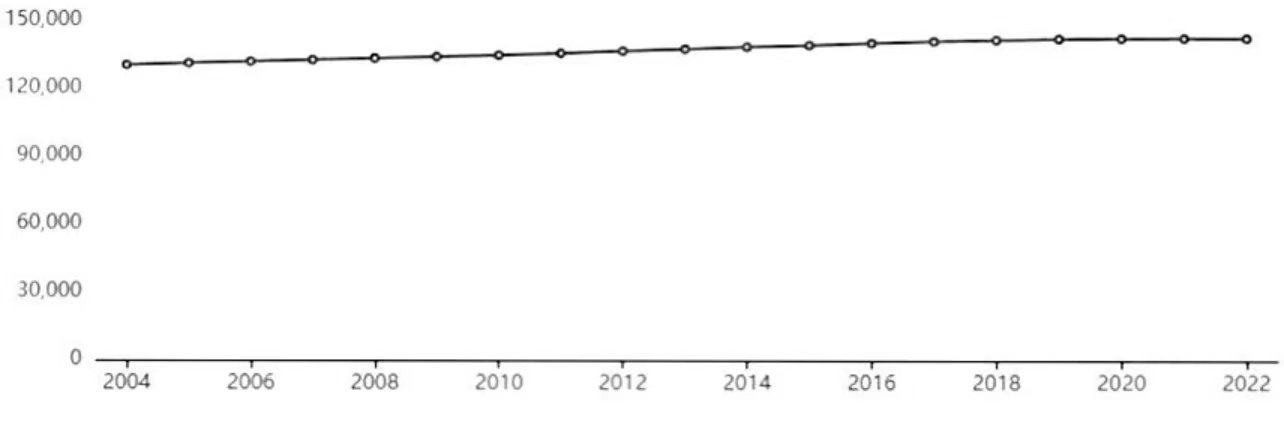
Figure 1. Population data of China in the past 20 years (unit: 10,000).
After having the historical population data (Figure 1), it is needed to preprocess it. Data preprocessing involves tasks like cleaning the data, handling missing values, and structuring it in a way that's suitable for time series analysis in R. Commonly used R packages for data manipulation include `dplyr` and `tidyr` (Figure 2).
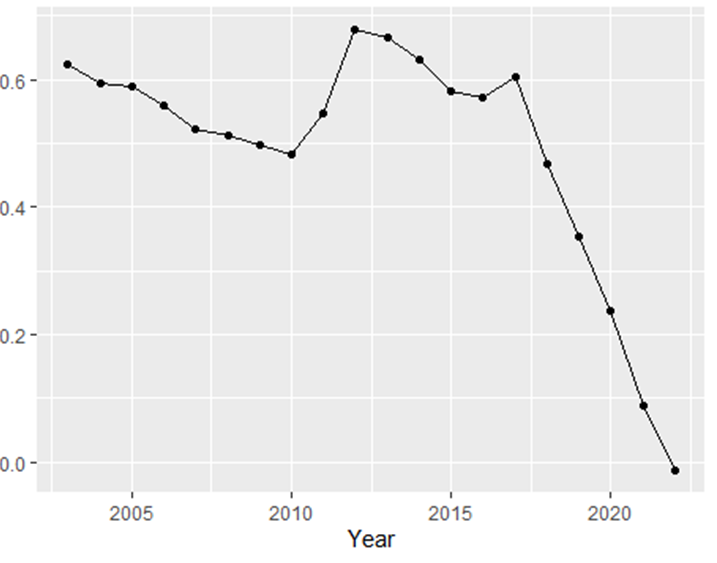
Figure 2. Population growth rate of China (‰).
2.2. Data exploration
It is essential to comprehend past population trends before developing a predictive time series model.
Making time series graphs, producing summary statistics, and spotting any underlying patterns or anomalies in the data are all components of data exploration. R provides several programs for visualizing data, including `ggplot2` and `plotly`.
Trend components and seasonality are common in time series data. It is possible to identify these components by breaking down the time series, which facilitates the modeling and prediction of population growth. To accomplish this, R offers functions like `decompose()`. The time series is divided into its seasonal, trend, and remaining components by the decomposition.
2.3. Model introduction
This study selects a suitable time series model to forecast population increase. The properties of the data determine which model is best. State space models, exponential smoothing, and autoregressive indexed moving average (ARIMA) are examples of common models.
The Chinese population is predicted in this instance using the ARIMA model. Estimating model parameters for the ARIMA model is necessary. These parameters include the moving average order (q), autoregressive order (p), and differencing order (d). R has functions in the `forecast} package like `auto.arima()} to assist in finding the best-fitting model. Based on the data, the `auto.arima()` method automatically determines which ARIMA model fits the data the best.
2.4. Model evaluation
Evaluate the performance of the time series model by comparing the forecasted population values with real-world data if available. Common evaluation metrics for time series forecasting include Mean Absolute Error (MAE), Mean Squared Error (MSE), and Root Mean Squared Error (RMSE). Use R's built-in functions to calculate these metrics.
Beyond simple time series analysis, there are numerous difficulties involved in predicting the Chinese population.
Think about include other factors like migration patterns, mortality rates, and fertility rates that could have an impact on population growth. For more accurate forecasts, advanced time series techniques like state space models or machine learning models can be applied. Collaboration with demographers and statisticians is valuable for refining population predictions and accounting for the many factors influencing population dynamics.
Population projections should be regularly updated with new data, and the model should be recalibrated as needed. Additionally, consider conducting scenario analysis to account for different assumptions and uncertainties, especially when predicting population trends over long time horizons.
3. Results and discussion
3.1. Model fitting and forecasting
With the selected ARIMA model, now it becomes possible to fit it to the historical population data and generate forecasts for future years. R's `forecast` package includes functions like `Arima()` for model fitting and `forecast()` for generating predictions. After which the ARIMA model is fitted to the time series data and generate forecasts for the next 25 years (adjust the value of `h` accordingly).
ARIMA models work well when the population data is stationary. Stationarity means that the statistical properties of the data, such as mean and variance of Chinese population, remain constant in general over time. If the population data shows trends or seasonality, differencing can be applied to make it stationary, which is a key requirement for ARIMA. This model is also designed to capture autocorrelation in the data. If there is a correlation between the Chinese population at onetime point and the population at a previous time point, an ARIMA model can model this relationship. Furthermore, ARIMA models are relatively simple and intuitive, making them a good choice for basic time series forecasting tasks. They don't require extensive domain knowledge or complex parameter tuning.
3.2. Model results
China's population will continue to grow over the next decade. Although the birth rate has declined in recent years, thanks to advances in medical technology and the continuous improvement of the social security system, the death rate will remain stable and the natural population growth rate will remain at a certain level. China's population is expected to reach about 1.55 billion in the next decade, and the growth rate will gradually slow (Table 1).
Table 1. China's population forecast for the next ten year.
Year | Population of China (unit: a hundred million) |
2023 | 14.36 |
2024 | 14.49 |
2025 | 14.62 |
2026 | 14.75 |
2027 | 14.88 |
2028 | 15.01 |
2029 | 15.14 |
2030 | 15.27 |
2031 | 15.41 |
2032 | 15.55 |
2033 | 15.69 |
3.3. Test of model fitting
Generally speaking, the model fits well with the data of Chinese population in the past few years as the residuals mostly lie within the critical area, indicating that the presented results of the future forecasts are reliable to a large extent (Figure 3). However, the figure for residuals still has a relatively obvious gap between the normal distribution, so that there may still be some deviation from the forecast.
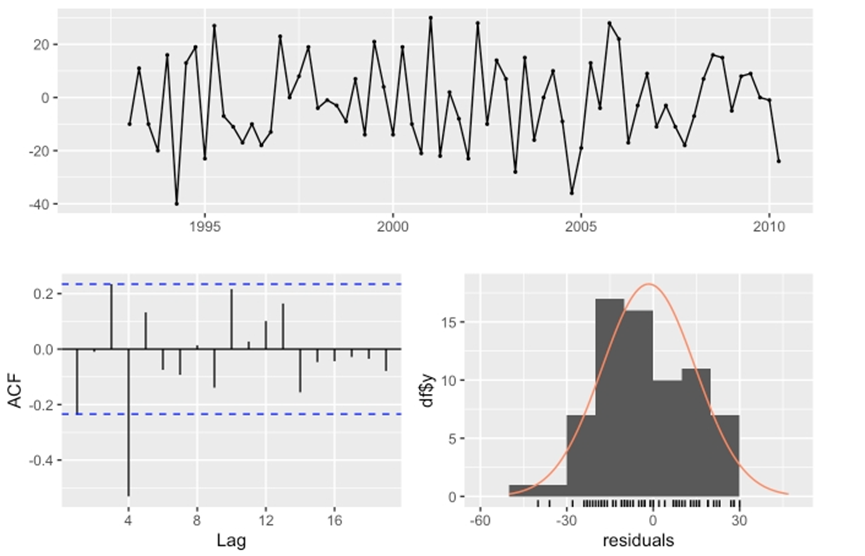
Figure 3. Test for residuals.
3.4. Model evaluation
The uncertainty of the outcome mainly comes from the properties of ARIMA models, as they assume that the relationships between data points are linear. If the Chinese population data exhibits nonlinear patterns, ARIMA may not perform well. In addition, ARIMA models typically don't account for external factors, such as government policies or major events that could impact population growth. Including such factors might require a more complex model. Moreover, the quality and completeness of the historical population data are crucial. Missing data or inaccuracies can affect the model's performance, so that the accuracy of the Chinese population database also affects the reliability of the results.
4. Conclusion
In the past 20 years, the birth rate of China's population has not shown an obvious cyclical and general trend. Generally speaking, in the past 20 years, China's birth rate has experienced a change from rising to falling. In the future, with the worsening of the aging population and the adjustment of the birth policy, China's birth rate is likely to continue to decline. The overall neonatal mortality rate in China has shown a significant downward trend. China's newborn mortality rate has experienced a change from high to low in the past two decades, which is mainly due to the continuous improvement and improvement of the country's medical and health care system. Considering further development of medical technology and the deepening of primary medical and health services, China's neonatal mortality is expected to be further reduced. In general, the mortality rate in China has experienced a change from high to low in the past two decades. China's mortality rate is likely to remain at a low level in the following period if the state of society continues. In the past two decades, the growth rate of China's total population has generally shown a downward trend. It is not a case affected by white noise, as the margin distribution is not uniform or approximate to normal distribution. China's total population growth rate has changed from high to low. China's total population growth rate is predicted to remain at a low level in the future, with the intensification of the aging population and the adjustment of the birth policy.
In conclusion, while population predictions provide valuable insights into future population trends, it's essential to approach them with humility and recognize the inherent uncertainties in long-term projections. Predicting the Chinese population is a challenging endeavor, and results should be used as a tool for informed decision-making such as policy decisions and long-term planning related to infrastructure, healthcare, education, and other public services rather than as absolute certainties. Regular updates and the consideration of multiple scenarios are key practices for producing more robust and reliable population predictions.
References
[1]. Liu C 1989 Characteristics of the population studies in China. Chin J Popul Sci, 1(4), 375-379.
[2]. hennan S and Sear R 2021 Archaeology, demography and life history theory together can help us explain past and present population patterns. Philos Trans R Soc Lond B Biol Sci, 18, 376.
[3]. Bao J, Tang Q and Chen Y 2018 Individual nursing care for the elderly among China's aging population. Biosci Trends, 11(6), 694-696.
[4]. Okui T 2023 Association between infant mortality and parental educational level: An analysis of data from Vital Statistics and Census in Japan. PLoS One, 18(6), 286530.
[5]. Smallwood S and Lynch K 2010 An analysis of patient register data in the Longitudinal Study - what does it tell us about the quality of the data? Popul Trends, 141, 148-66.
[6]. Wang D, Wang S J, Xu J and Lababidi S 2022 A targeted simulation-extrapolation method for evaluating biomarkers based on new technologies in precision medicine. Pharm Stat, 21(3), 584-598.
[7]. Coleman M P 2020 Axon Degeneration: Which Method to Choose? Methods Mol Biol, 21(43), 3-12.
[8]. Sevilimedu V and Yu L 2022 Simulation extrapolation method for measurement error: A review. Stat Methods Med Res, 31(8), 1617-1636.
[9]. Jin W, McCue S W and Simpson M J 2018 Extended logistic growth model for heterogeneous populations. J Theor Biol, 14, 51-61.
[10]. Reeves S and Bernstein I M 2008 Optimal growth modeling. Semin Perinatol, 32(3),148-153.
[11]. Peleg M and Corradini M G 2011 Microbial growth curves: what the models tell us and what they cannot. Crit Rev Food Sci Nutr, 51(10), 917-945.
Cite this article
Yang,S. (2023). The analysis and forecast of Chinese population using ARIMA model. Theoretical and Natural Science,26,273-278.
Data availability
The datasets used and/or analyzed during the current study will be available from the authors upon reasonable request.
Disclaimer/Publisher's Note
The statements, opinions and data contained in all publications are solely those of the individual author(s) and contributor(s) and not of EWA Publishing and/or the editor(s). EWA Publishing and/or the editor(s) disclaim responsibility for any injury to people or property resulting from any ideas, methods, instructions or products referred to in the content.
About volume
Volume title: Proceedings of the 3rd International Conference on Computing Innovation and Applied Physics
© 2024 by the author(s). Licensee EWA Publishing, Oxford, UK. This article is an open access article distributed under the terms and
conditions of the Creative Commons Attribution (CC BY) license. Authors who
publish this series agree to the following terms:
1. Authors retain copyright and grant the series right of first publication with the work simultaneously licensed under a Creative Commons
Attribution License that allows others to share the work with an acknowledgment of the work's authorship and initial publication in this
series.
2. Authors are able to enter into separate, additional contractual arrangements for the non-exclusive distribution of the series's published
version of the work (e.g., post it to an institutional repository or publish it in a book), with an acknowledgment of its initial
publication in this series.
3. Authors are permitted and encouraged to post their work online (e.g., in institutional repositories or on their website) prior to and
during the submission process, as it can lead to productive exchanges, as well as earlier and greater citation of published work (See
Open access policy for details).
References
[1]. Liu C 1989 Characteristics of the population studies in China. Chin J Popul Sci, 1(4), 375-379.
[2]. hennan S and Sear R 2021 Archaeology, demography and life history theory together can help us explain past and present population patterns. Philos Trans R Soc Lond B Biol Sci, 18, 376.
[3]. Bao J, Tang Q and Chen Y 2018 Individual nursing care for the elderly among China's aging population. Biosci Trends, 11(6), 694-696.
[4]. Okui T 2023 Association between infant mortality and parental educational level: An analysis of data from Vital Statistics and Census in Japan. PLoS One, 18(6), 286530.
[5]. Smallwood S and Lynch K 2010 An analysis of patient register data in the Longitudinal Study - what does it tell us about the quality of the data? Popul Trends, 141, 148-66.
[6]. Wang D, Wang S J, Xu J and Lababidi S 2022 A targeted simulation-extrapolation method for evaluating biomarkers based on new technologies in precision medicine. Pharm Stat, 21(3), 584-598.
[7]. Coleman M P 2020 Axon Degeneration: Which Method to Choose? Methods Mol Biol, 21(43), 3-12.
[8]. Sevilimedu V and Yu L 2022 Simulation extrapolation method for measurement error: A review. Stat Methods Med Res, 31(8), 1617-1636.
[9]. Jin W, McCue S W and Simpson M J 2018 Extended logistic growth model for heterogeneous populations. J Theor Biol, 14, 51-61.
[10]. Reeves S and Bernstein I M 2008 Optimal growth modeling. Semin Perinatol, 32(3),148-153.
[11]. Peleg M and Corradini M G 2011 Microbial growth curves: what the models tell us and what they cannot. Crit Rev Food Sci Nutr, 51(10), 917-945.