


1. Introduction
Clostridium difficile (C. difficile), a Gram-positive bacterium capable of forming spores [1], was first identified in the anaerobic fecal microbiota of newborns [2]. Initially, Bartlett et al found that C. difficile could cause antibiotic-associated pseudomembranous colitis in patients [3]. Weakening of colonization resistance in the gut flora allows unrestricted colonization by C. difficile, leading to C. difficile infection (CDI) [4]. The misuse of some commonly used broad-spectrum antibiotics, including penicillins and cephalosporins, is the leading cause of CDI.
In recent times, there has been an increasing focus on the issue of microbial antibiotic resistance resulting from the inappropriate use of antibiotics [5], especially the antibiotic resistance of C. difficile in the treatment and prevention of CDI. Even though FMT has been validated as a efficacious therapy for recurrent Clostridium difficile infection (rCDI) [6], and numerous clinical trials of newly developed narrow-spectrum antibiotics effective against C. difficile have been completed [7, 8], a series of antibiotic regimens, such as vancomycin, fidaxomicin and metronidazole, remain a mainstream and cost-effective method for both initial and recurrent CDI patients today. However, many prevalent clinical isolates of C. difficile are multidrug-resistant, with a noticeable increasing trend, posing a significant threat to public safety [9-11]. Furthermore, according to data from the Centers for Disease Control and Prevention (CDC) in the United States in 2015, there were approximately 453,000 cases of CDI annually, resulting in approximately 29,000 fatalities. Since 2002, the global incidence of CDI has shown a consistent year-on-year increase, affecting not only one specific country but various regions across the world [12, 13], making research on C. difficile antibiotic resistance particularly important.
In summary, in response to the significant issue of C. difficile antibiotic resistance, this paper will collect and screen clinical data on C. difficile antibiotic resistance research from publicly available databases between 2010 and 2023. It will conduct a meta-analysis of the resistance results produced by the three antibiotics mentioned above and explore the heterogeneity sources through heterogeneity testing. Subgroup analyses will be conducted to discuss the contributions of variables such as region to heterogeneity, revealing the multidimensional differences in C. difficile antibiotic resistance. Using these methods to investigate antibiotic resistance in C. difficile under different antibiotics is of great significance for analyzing the risk factors for resistance and developing antibiotics against C. difficile. It also holds important reference value for improving existing clinical antibiotic treatment for CDI.
2. Methods
2.1. Data origin and selection
2.1.1. Search strategy. The main data sources for this study are from databases including Wanfang Data, CNKI (China National Knowledge Infrastructure), PubMed, Science of Direct, Web of Science, and Scopus. The search was conducted using random combinations of keywords such as “Clostridium difficile”, “antimicrobial agents,” “antibiotics,” “resistance,” “clinical trials,” “vancomycin,” “fidaxomicin,” and “metronidazole,” among others. Articles published from June 2005 to June 2023 were included in the study.
2.1.2. Selection criteria. All studies included in the analysis were screened multiple times by three authors, and were excluded if they had the following conditions: (1) The study did not present antibiotic resistance results for Clostridium difficile. (2) The resistance rate was not clearly reported. (3) The study was a meta-analysis, systematic review, or not an original research article. (4) Duplicate reports from the same database. (5) Conference abstracts and articles without full text as requested by the authors. (6) The antibiotics used did not include vancomycin, fidaxomicin, or metronidazole (if one of these was used, it was considered for inclusion).
2.1.3. Definition of antimicrobial resistance. According to guidelines provided by the European Committee for Antimicrobial Susceptibility Testing (EUCAST) or the Clinical and Laboratory Standards Institute (CLSI), the determination of resistance is typically based on clinical assessment and the minimum inhibitory concentration (MIC) of the microorganism. In this study, following a comprehensive data assessment, a lower limit will be defined as the criterion for ascertaining resistance, thus standardizing the qualitative results (presence or absence of resistance).
2.2. Research protocol
2.2.1. Data extraction. After retrieving the full-text data, each article will be systematically assigned a unique identifier, and a comprehensive set of information will be gathered from each article, including its title, authorship, journal source, publication date, research objectives, study type, geographical focus, and target population. Additionally, details about disease diagnostic criteria and outcome assessment standards will be collected. The statistical methods employed in the studies, the quality assessment applied, and the reported results and conclusions will also be documented.
2.2.2. Quality assessment. The quality assessment of the research will be conducted in accordance with the quality assessment criteria outlined in the Cochrane Systematic Reviewer’s Handbook, which includes evaluating the literature’s quality and bias risk. The Revman quality assessment tool will be employed to appraise the methodological quality of the studies that are finally included for analysis. Initial evaluations will be performed by two reviewers, and any discrepancies in the literature data will be adjudicated by a third reviewer.
2.2.3. Statistical analysis. In the R programming software, a meta-analysis will be performed. A forest plot will be created, and the I² statistic will be calculated. Utilizing Bayesian Markov Chain Monte Carlo (MCMC) algorithms, covariate-adjusted analyses will be conducted on the data derived from the random-effects model. Efficacy and resistance analysis will utilize rates as the statistical measure, with continuous data measurements relying on weighted mean differences or standardized mean differences. Each effect size will be reported with a 95% confidence interval (CI).
2.2.4. Study outcomes. Subgroup analyses will be conducted mainly based on geographic regions (North America, Europe Union, Asia-Pacific, Middle East and Africa). In case significant heterogeneity is observed and there are more than five studies included, further subgroup analyses will be considered based on publication date, treatment duration, antimicrobial susceptibility testing methods, research quality, among other relevant factors. When the number of studies within a category exceeds five, potential publication bias will also be analyzed.
3. Results and discussion
3.1. Query outcomes
A total of 518 articles published between June 2005 and June 2023 were included following an initial screening of titles and abstracts, subsequent to indexing from six databases. Following full-text review, 424 articles were excluded, and 94 articles underwent a quality assessment (Fig. 1).
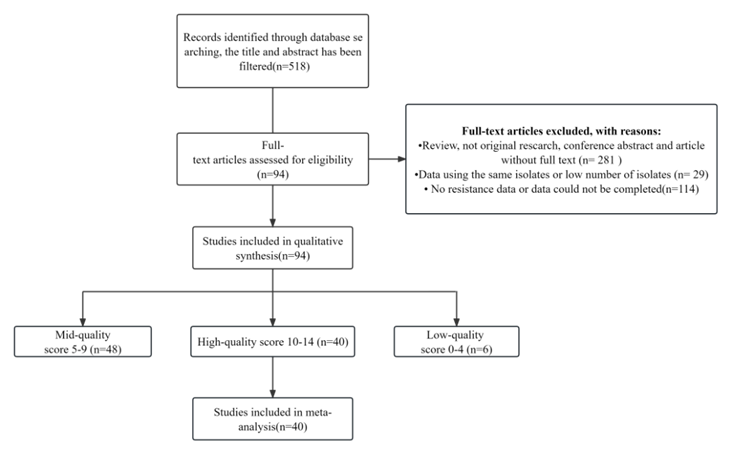
Figure 1. Chart Displaying the Study Screening Progress.
Criteria for non-inclusion during the second screening encompassed the absence of resistance data, non-original research, and unavailability of full-text, among others. Quality assessment scores ranged from 5 to 13 points. Ultimately, 40 articles with scores of 10 or higher and complete data were incorporated (Fig. 1).
3.2. Features of included studies
The 40 studies included in this analysis encompassed randomized controlled trials (RCTs) conducted in a total of eight countries and regions, with a sample size of 7,458 participants (4,840 for vancomycin, 2,722 for metronidazole, and 4,075 for fidaxomicin). The majority of studies originated from the Americas, including North America and South America (n=16), followed by the Asia-Pacific region (n=11). The agar dilution method was the most commonly used antimicrobial susceptibility testing technique (n=24), followed by the E-test method (n=9). All studies employed a cross-sectional design. Importantly, all 40 studies (100%) were considered to be of good quality and with limited bias. For the distribution of publication years, please refer to Table 1, 2, and 3 for specific details regarding the categorization of the three antibiotics.
Table 1. An overview of certain literature integrated into the Vancomycin Meta-Analysis.
author | year | region | test | evaluation | n | n_resistance | MIC_breakpoint μg/ml |
Goldstein, E. J. et al. | 2011 | CA | Agar dilution | 10 | 321 | 21 | 2 |
Goldstein, E. J. et al. | 2011 | US | Agar dilution | 10 | 285 | 29 | 2 |
Nerandzic, M. M. et al. | 2012 | NA | Agar dilution | 11 | 301 | 54 | 2 |
Nerandzic, M. M. et al. | 2012 | NA | Agar dilution | 11 | 141 | 10 | 2 |
Gerding, D. N. at al. | 2016 | NA | Agar dilution | 11 | 78 | 1 | 2 |
Chen Yunbo | 2010 | APac | E-test | 12 | 163 | 0 | 2 |
Emmanuel, A. Z. et al | 2015 | MX | E-test | 11 | 31 | 0 | 4 |
Emmanuel, A. Z. et al | 2016 | MX | E-test | 11 | 63 | 0 | 4 |
Kouhsari, E. et al. | 2017 | MEA | E-test | 12 | 35 | 3 | 2 |
Table 2. An overview of certain literature integrated into the Fidaxomicin Meta-Analysis.
author | year | region | test | evaluation | n | MIC_breakpoint | treatment_failure_ |
Goldstein, E. J. et al. | 2011 | NA+EU | Agar dilution | 10 | 396 | 1 | 46 |
Petrella, L. A. et al. | 2012 | NA+EU | Agar dilution | 11 | 120 | 1 | 15 |
Mikamo, H. et al | 2018 | JP | Agar dilution | 12 | 104 | 2 | 34 |
Table 3. An overview of certain literature integrated into the Metronidazole Meta-Analysis.
author | year | region | test | evaluation | n | n_resistance | MIC_breakpoint μg/ml |
Goldstein, E. J. et al. | 2011 | CA | Agar dilution | 10 | 321 | 21 | 2 |
Goldstein, E. J. et al. | 2011 | US | Agar dilution | 10 | 285 | 29 | 2 |
Goldstein, E. J. et al. | 2011 | EU | Agar dilution | 10 | 119 | 17 | 2 |
Emmanuel, A. Z., et al | 2015 | MX | E-test | 11 | 31 | 0 | 4 |
Emmanuel, A. Z. et al | 2016 | MX | E-test | 11 | 63 | 0 | 4 |
P Shoaei. et al | 2016 | MEA | E-test | 11 | 19 | 0 | 2 |
Kouhsari, E. et al. | 2017 | MEA | E-test | 12 | 35 | 3 | 2 |
Mohammad, S. et al. | 2017 | MEA | Agar dilution | 11 | 21 | 3 | 2 |
Małgorzata, A. et al. | 2021 | EU | Agar dilution | 12 | 215 | 0 | 2 |
Mikamo, H. et al | 2018 | JP | Agar dilution | 12 | 108 | 0 | 2 |
3.3. Antimicrobial resistance
Table 4 and Table 5 present the Weighted Pooled Resistance Rate (WPR) of C. difficile for three antibiotics, along with the Weighted Pooled Failure Rate of Clinical Cure (WPF) for two of the antibiotic therapies.
Table 4. WPR for three antibiotics.
Antibiotics | Breakpoint (mg/L) | Tested n | Resistance n (%) | WPR | 95% CI | Heterogeneity |
Vancomycin | ≥2 | 4840 | 202(4.17) | 0.0354 | 0.0134 - 0.0651 | 93.90% |
Fidaxomicin | ≥1 | 1651 | 18(1.09) | 0.0051 | 0 - 0.0205 | 82.70% |
Metronidazole | ≥2 | 3705 | 132(3.56) | 0.0371 | 0.0048 - 0.0904 | 92.80% |
Metronidazole | ≥32 | 252 | 6(2.38) | 0.0370 | 0 - 0.2677 | 91.10% |
Table 5. WPF of Vancomycin and Fidaxomicin.
Antibiotics | Patients | Cure failure n (%) | WPF | 95% CI | Heterogeneity |
Vancomycin | 3780 | 832(22.01) | 0.2195 | 0.1645 - 0.2798 | 94.00% |
Fidaxomicin | 2003 | 329(16.43) | 0.1757 | 0.1107 - 0.2516 | 93.60% |
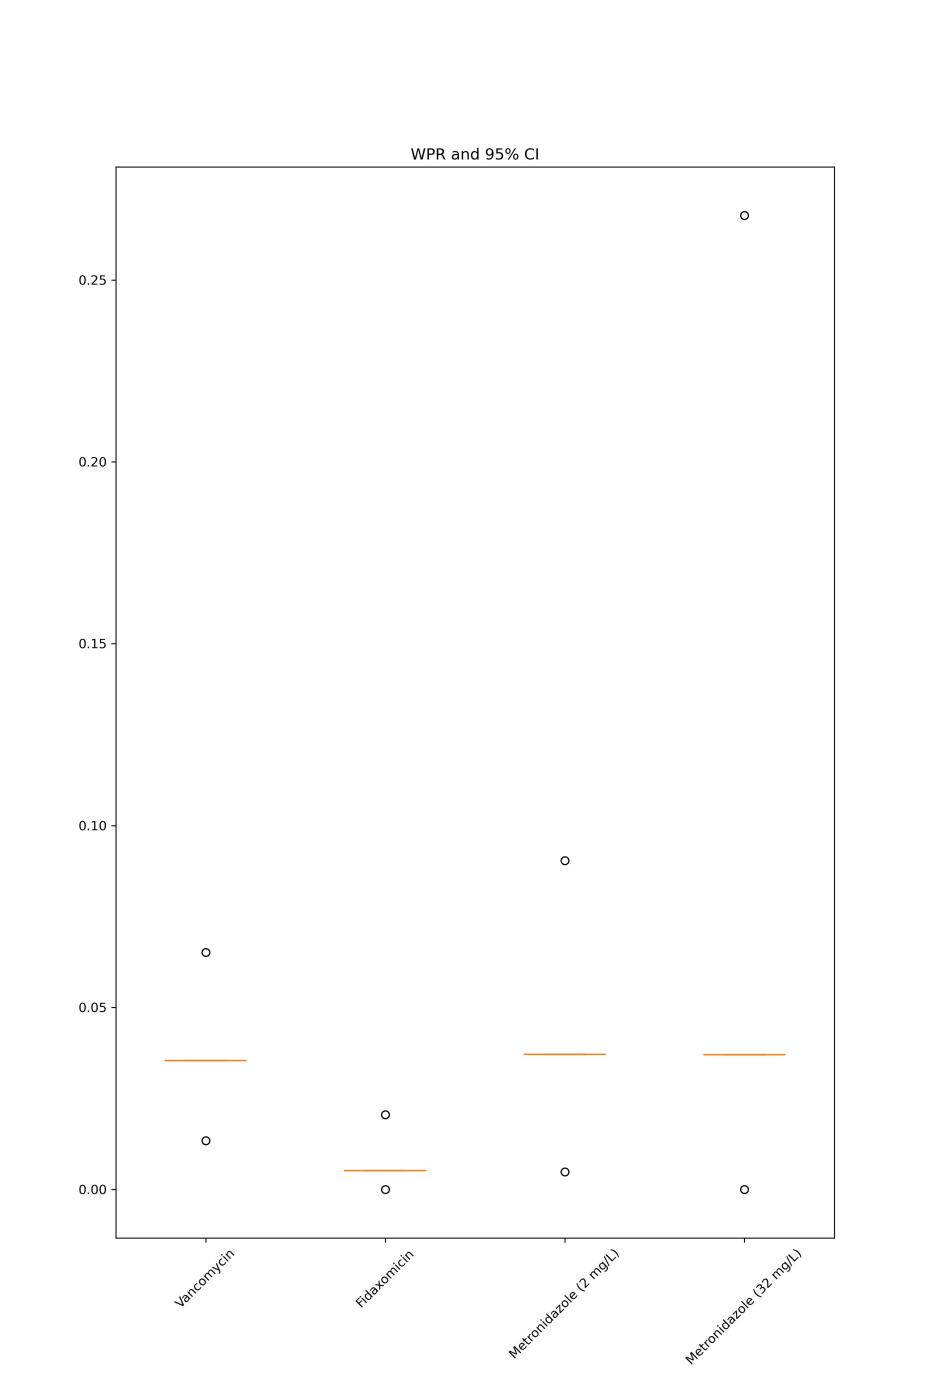
Figure 2. WPR and 95%CI for the three antibiotics.
As figure 2 shows, C. difficile weighted pooled resistance rates and 95% CI are presented for vancomycin, fidaxomicin, metronidazole (at the 2mg/L breakpoint), and metronidazole (at the 32mg/L breakpoint). Horizontal lines denote WPR, and dots indicate the range of 95% CI.
3.3.1. Vancomycin. 32 studies were incorporated, involving the examination of 4,861 C. difficile isolates. The breakpoint for resistance was 2 mg/L. The WPR was 3.72% (95% CI 1.48% ~ 6.71%) with substantial heterogeneity (I² = 93.7%) and no significant publication bias (Peters test, p-value = 0.1863). In the subgroup analysis of the regions from which the literature data came, significant differences were found in this study (p-value < 0.0001) and the highest WPRs were observed in European Union (9.40%, 95% CI 0 ~ 41.80%) followed by North America (8.40%, 95% CI 3.6% ~ 14.6%). Data from 2005 to 2015 (WPR 3.00%, 95% CI 0.54% ~ 6.91%) and from 2016 to 2021 (WPR 4.45%, 95% CI 1.16% ~ 9.21%) was compared, revealed an increase in resistance rate but without significance (p-value = 0.4393).
The WPF was determined by data from 19 studies where 3780 C. difficile isolates were tested. The WPF was 21.95% (95% CI 16.45% ~ 27.98%) with substantial heterogeneity (I² = 94.0%) and no significant publication bias (Peters test, p-value = 0.6820).
In the regional subgroup analyses, a statistically significant distinction was detected (p-value < 0.0001), with the European Union displaying the highest clinical cure failure rates (42.01%, 95% CI 34.00% ~ 50.23%), followed by the Asia-Pacific region (34.26%, 95% CI 25.57% ~ 43.50%). Data from 2006 to 2015 (WPF 20.66%, 95% CI 15.11% ~ 26.80%) and from 2016 to 2021 (WPF 29.54%, 95% CI 12.45% ~ 49.89%) was compared, revealed an increase in resistance rate but without significance (p-value = 0.3147).
3.3.2. Fidaxomicin. 10 studies selected breakpoint of 1 mg/L where 1651 isolates were tested. The WPR to fidaxomicin was 0.51% (95% CI 0 ~ 2.05%), demonstrating considerable heterogeneity (I² = 82.7%) and a lack of significant publication bias (Peters test, p-value = 0.1324). In the regional subgroup analyses, a statistically significant distinction was noted (p-value = 0.0169). North America displayed the highest fidaxomicin resistance rate (3.76%, 95% CI 0.79% ~ 8.35%), while all other regions exhibited rates below 0.01%. Data from 2010 to 2015 (WPR 0.57%, 95% CI 0 ~ 3.68%) and from 2016 to 2018 (WPR 0.33, 95% CI 0 ~ 1.91%) revealed a slight decrease but without significance (p-value = 0.9632).
The WPF was determined by data from 10 studies with 2,003 isolates. The WPF was 17.57% (95% CI 11.07% ~ 25.16%) with substantial heterogeneity (I² = 93.6%) and no significant publication bias (Peters test, p-value = 0.2613). In the regional subgroup analyses, a statistically significant disparity was identified (p-value < 0.0001). The European Union recorded the highest rates of treatment failure (42.01%, 95% CI 34.00% ~ 50.23%), followed by the Asia-Pacific region (34.26%, 95% CI 25.57% ~ 43.50%). Data from 2007 to 2012 (WPF 9.33%, 95% CI 6.35% ~ 12.79%) and from 2013 to 2019 (WPF 28.43%, 95%CI 23.18% ~ 33.98%), revealed a significant increase (p-value < 0.0001).
3.3.3. Metronidazole. 32 studies selected breakpoint of 2 mg/L where 3957 isolates were tested. The WPR stood at 3.18% (95% CI 0.56% ~ 7.27%), reflecting notable heterogeneity (I² = 91.6%) and a minor degree of publication bias (Peters test, p-value = 0.0405). In the regional subgroup analyses, a statistically significant contrast was established (p-value < 0.0001). The Middle East and Africa region exhibited the highest resistance rate to metronidazole (22.86%, 95% CI 4.41% ~ 48.64%), followed by North America (6.06%, 95% CI 0.12% ~ 17.58%). Data from 2005 to 2015 (WPR 0.68%, 95% CI 0 ~ 2.08%) and from 2016 to 2021 (WPR 5.46%, 95% CI 0.77% ~ 13.10%) revealed a significant increase (p-value = 0.0482).
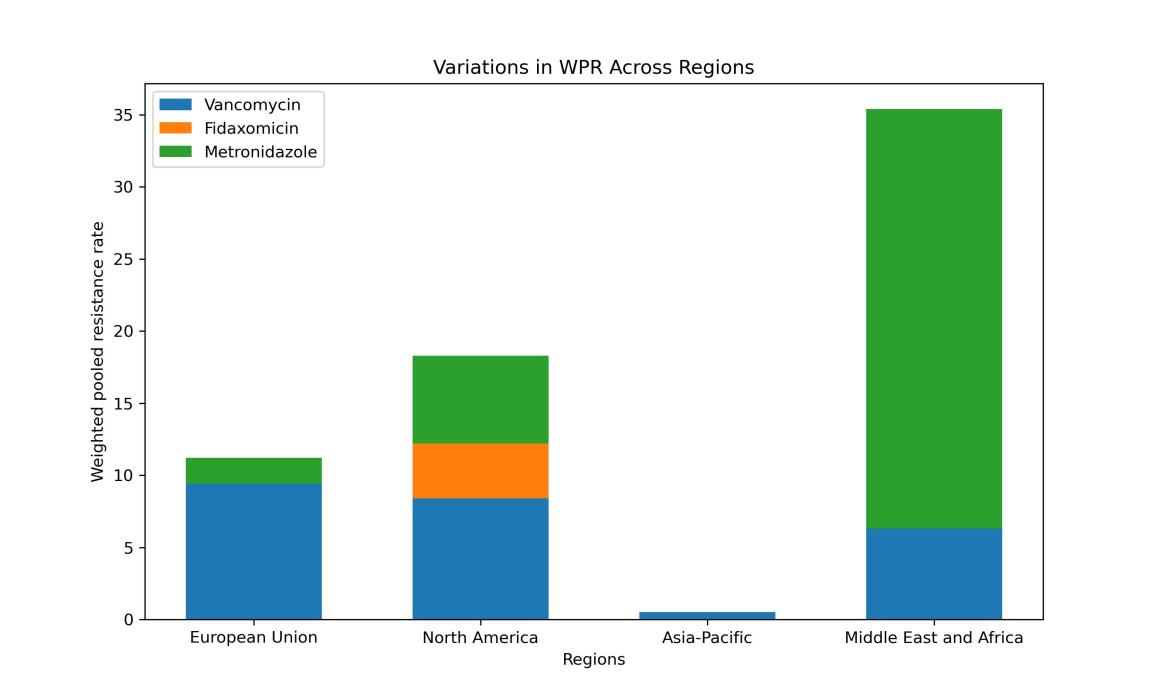
Figure 3. Subgroup analysis about data categorized by regions.
Within four distinct global regions, the respective resistance rates to Vancomycin, Fidaxomicin and Metronidazole are illustrated in the figure 3.
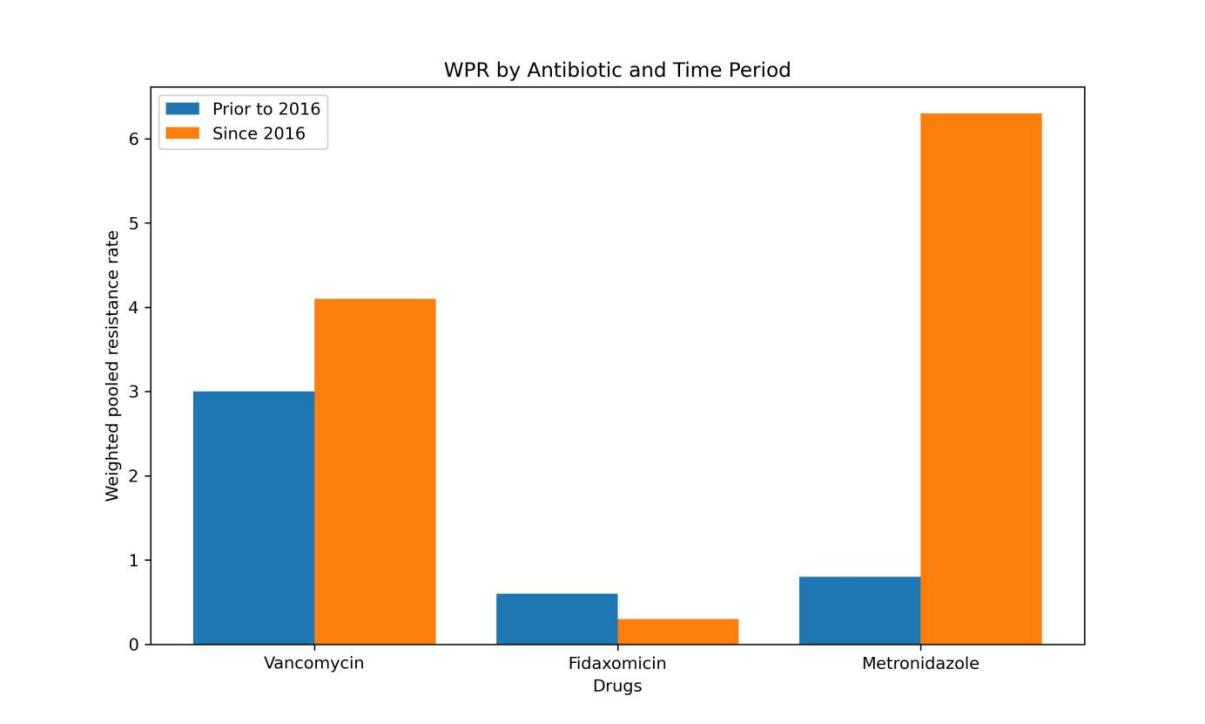
Figure 4. Subgroup analysis about data categorized by years.
Figure 4 compares the disparity in resistance to the same antibiotic between two time periods: prior to 2016 and since 2016.
3.4. Discussion
Previous studies have compared the efficacy and antimicrobial susceptibility of these antibiotics, revealing lower cure rates among patients treated with Fidaxomicin, yet without more comprehensive data on resistance [14]. In contrast, this paper used meta-analysis to separately assess the resistance profile of C. differential against Vancomycin, Fidaxomicin, and Metronidazole in the clinical treatment process of CDI. The data were all sourced from high-quality research to ensure the credibility of the results, and sub-group analysis was conducted to explore differences in resistance rates and clinical cure failure rates among different regions and years.
Metronidazole shows the highest resistance in C. difficile, followed by vancomycin, with the lowest resistance seen for fidaxomicin (Fig. 2). Correspondingly, fidaxomicin therapy for CDI is associated with a lower clinical cure failure rate than vancomycin (Table 5), suggesting that C. difficile is most sensitive to Fidaxomicin. However, the clinical cure failure rate of Fidaxomicin has significantly increased from 2007 to 2019 (Fig. 4), while its resistance rate has not significantly changed, implying that there may be other factors besides resistance affecting the treatment effect of Fidaxomicin on CDI.
Significant regional variations exist in C. difficile resistance to the three antibiotics, notably with high resistance rates observed in North America for all three (Fig. 3). The resistance rate to metronidazole significantly rose from before 2016 to after 2016, highlighting a worsening effectiveness of metronidazole against C. difficile (Fig. 4). Furthermore, the combination of Agar dilution and E-test methods for susceptibility testing did not have a statistically significant impact on the results (Supplementary Figure).
This study included 26 literature items (100%) all of which had high-quality methodology with low risk of bias. The analysis of resistance to Vancomycin, Fidaxomicin, and Metronidazole showed no significant publication bias. The limitations of this study include: (i) there were few studies included in the analysis of the clinical failure rate of Metronidazole, which affected its further sub-group analysis and to some extent the test efficiency of the meta-analysis; (ii) the sensitivity analysis results showed that the unclear severity classification of the disease and the length of follow-up did not affect the initial analysis results, but the inclusion of relevant literature based on disease severity classification may cause potential selection bias.
4. Conclusion
Through the above methods, exploration on the resistance of Clostridium difficile to Vancomycin, Fidaxomicin, and Metronidazole in different regions provides important reference value for improving existing clinical antibiotic treatment plans for CDI. Nevertheless, given the constraints of the research methodology, additional confirmation is required through meticulously planned multicenter and extensive-sample clinical trials to establish more efficacious treatment strategies for patients with Clostridium difficile infection (CDI).
Authors Contribution
The authors contributed equally to this work, and their names were arranged in alphabetical order.
References
[1]. Modaber I 1975 Clostridium difficile. J. Acta Med Iran, 18(3-4), 111-128.
[2]. Hall I C and O’toole E 1935 Intestinal flora in new-born infants: with a description of a new pathogenic anaerobe, Bacillus difficilis. J. American journal of diseases of children, 49(2), 390-402.
[3]. Bartlett J G, Chang T W, Gurwith M, et al. 1978 Antibiotic-associated pseudomembranous colitis due to toxin-producing clostridia. J. The New England journal of medicine, 298(10), 531-534.
[4]. Sandhu B K, Mcbride S M 2018 Clostridioides difficile. J. Trends in microbiology, 26(12), 1049-1050.
[5]. Ramirez J, Guarner F, Bustos Fernandez L, et al. 2020 Antibiotics as Major Disruptors of Gut Microbiota. J. Frontiers in cellular and infection microbiology, 10, 572912.
[6]. Reigadas E, Van Prehn J, Falcone M, et al. 2021 How to: prophylactic interventions for prevention of Clostridioides difficile infection. J. Clin Microbiol Infect, 27(12), 1777-1783.
[7]. Feuerstadt P, Louie T J, Lashner B, et al. 2022 SER-109, an Oral Microbiome Therapy for Recurrent Clostridioides difficile Infection. J. The New England journal of medicine, 386(3), 220-9.
[8]. Carlson T and Gonzales-Luna A J 2020 Antibiotic treatment pipeline for Clostridioides difficile infection (CDI): A wide array of narrow-spectrum agents. J. Current infectious disease reports, 22, 1-11.
[9]. Stogios P J and Savchenko A 2020 Molecular mechanisms of vancomycin resistance. J. Protein science: a publication of the Protein Society, 29(3), 654-669.
[10]. Oprita R, Bratu M, Oprita B, et al. 2016 Fecal transplantation - the new, inexpensive, safe, and rapidly effective approach in the treatment of gastrointestinal tract diseases. J. Journal of medicine and life, 9(2), 160-162.
[11]. Spigaglia P, Mastrantonio P and Barbanti F 2018 Antibiotic Resistances of Clostridium difficile. J. Advances in experimental medicine and biology, 1050, 137-159.
[12]. Lessa F C, Mu Y, Bamberg W M, et al. 2015 Burden of Clostridium difficile infection in the United States. J. The New England journal of medicine, 372(24), 2369–2370.
[13]. Kuijper E, Coignard B, Tüll P, et al. 2006 Emergence of Clostridium difficile‐associated disease in North America and Europe. J. Clin Microbiol Infect, 12, 2-18.
[14]. Dai J, Gong J and Guo R 2022 Real-world comparison of fidaxomicin versus vancomycin or metronidazole in the treatment of Clostridium difficile infection: a systematic review and meta-analysis. J. European Journal of Clinical Pharmacology, 78(11), 1727-1737.
Cite this article
Guo,T.;Jiang,Z.;Yu,Q. (2023). Prevalence of antibiotic resistance in Clostridium difficile: A meta-analysis. Theoretical and Natural Science,27,202-210.
Data availability
The datasets used and/or analyzed during the current study will be available from the authors upon reasonable request.
Disclaimer/Publisher's Note
The statements, opinions and data contained in all publications are solely those of the individual author(s) and contributor(s) and not of EWA Publishing and/or the editor(s). EWA Publishing and/or the editor(s) disclaim responsibility for any injury to people or property resulting from any ideas, methods, instructions or products referred to in the content.
About volume
Volume title: Proceedings of the 2nd International Conference on Modern Medicine and Global Health
© 2024 by the author(s). Licensee EWA Publishing, Oxford, UK. This article is an open access article distributed under the terms and
conditions of the Creative Commons Attribution (CC BY) license. Authors who
publish this series agree to the following terms:
1. Authors retain copyright and grant the series right of first publication with the work simultaneously licensed under a Creative Commons
Attribution License that allows others to share the work with an acknowledgment of the work's authorship and initial publication in this
series.
2. Authors are able to enter into separate, additional contractual arrangements for the non-exclusive distribution of the series's published
version of the work (e.g., post it to an institutional repository or publish it in a book), with an acknowledgment of its initial
publication in this series.
3. Authors are permitted and encouraged to post their work online (e.g., in institutional repositories or on their website) prior to and
during the submission process, as it can lead to productive exchanges, as well as earlier and greater citation of published work (See
Open access policy for details).
References
[1]. Modaber I 1975 Clostridium difficile. J. Acta Med Iran, 18(3-4), 111-128.
[2]. Hall I C and O’toole E 1935 Intestinal flora in new-born infants: with a description of a new pathogenic anaerobe, Bacillus difficilis. J. American journal of diseases of children, 49(2), 390-402.
[3]. Bartlett J G, Chang T W, Gurwith M, et al. 1978 Antibiotic-associated pseudomembranous colitis due to toxin-producing clostridia. J. The New England journal of medicine, 298(10), 531-534.
[4]. Sandhu B K, Mcbride S M 2018 Clostridioides difficile. J. Trends in microbiology, 26(12), 1049-1050.
[5]. Ramirez J, Guarner F, Bustos Fernandez L, et al. 2020 Antibiotics as Major Disruptors of Gut Microbiota. J. Frontiers in cellular and infection microbiology, 10, 572912.
[6]. Reigadas E, Van Prehn J, Falcone M, et al. 2021 How to: prophylactic interventions for prevention of Clostridioides difficile infection. J. Clin Microbiol Infect, 27(12), 1777-1783.
[7]. Feuerstadt P, Louie T J, Lashner B, et al. 2022 SER-109, an Oral Microbiome Therapy for Recurrent Clostridioides difficile Infection. J. The New England journal of medicine, 386(3), 220-9.
[8]. Carlson T and Gonzales-Luna A J 2020 Antibiotic treatment pipeline for Clostridioides difficile infection (CDI): A wide array of narrow-spectrum agents. J. Current infectious disease reports, 22, 1-11.
[9]. Stogios P J and Savchenko A 2020 Molecular mechanisms of vancomycin resistance. J. Protein science: a publication of the Protein Society, 29(3), 654-669.
[10]. Oprita R, Bratu M, Oprita B, et al. 2016 Fecal transplantation - the new, inexpensive, safe, and rapidly effective approach in the treatment of gastrointestinal tract diseases. J. Journal of medicine and life, 9(2), 160-162.
[11]. Spigaglia P, Mastrantonio P and Barbanti F 2018 Antibiotic Resistances of Clostridium difficile. J. Advances in experimental medicine and biology, 1050, 137-159.
[12]. Lessa F C, Mu Y, Bamberg W M, et al. 2015 Burden of Clostridium difficile infection in the United States. J. The New England journal of medicine, 372(24), 2369–2370.
[13]. Kuijper E, Coignard B, Tüll P, et al. 2006 Emergence of Clostridium difficile‐associated disease in North America and Europe. J. Clin Microbiol Infect, 12, 2-18.
[14]. Dai J, Gong J and Guo R 2022 Real-world comparison of fidaxomicin versus vancomycin or metronidazole in the treatment of Clostridium difficile infection: a systematic review and meta-analysis. J. European Journal of Clinical Pharmacology, 78(11), 1727-1737.