


1. Introduction
The central nervous system (CNS) disorders, including psychiatric and neurological conditions such as Alzheimer’s disease, Parkinson’s disease, schizophrenia, depression, epilepsy, and multiple sclerosis, affect a significant portion of the global population. These disorders can have a profound impact on patients’ quality of life, making it a significant unmet medical need for effective treatments.
Currently, many CNS disorders lack satisfactory treatment options. While medications are available for some conditions, they often suffer from limited efficacy, significant side effects, or only the ability to address the symptoms but not the underlying causes. Developing drugs that can penetrate the brain and target specific disease mechanisms hold the potential to improve patient outcomes [1]. Given the significant burden of CNS disorders and limited treatment options available, there is a high demand for CNS drugs that can effectively penetrate the brain and reach the target.
One of the major challenges researchers face is developing drugs that can effectively penetrate the blood-brain barrier (BBB). BBB is a highly restricted barrier that separates the bloodstream from the brain, protecting the brain from potentially harmful substances [2]. While the BBB is crucial for maintaining brain homeostasis, it also poses challenges when developing drugs that need to reach the brain. The BBB contains efflux transporters, such as P-glycoprotein (P-gp) and breast cancer resistance protein (BCRP), that actively pump drugs out of the brain back into the bloodstream [3]. These transporters recognize a broad range of structurally diverse compounds and can significantly limit the brain penetration of potential therapeutics. Overcoming the efflux transporters’ activity is a major challenge in achieving sufficient drug concentrations in the brain.
Elacridar is a known P-gp and BCRP inhibitor that has potential to overcome the efflux activity of the transporters and therefore enhance drug penetration across the BBB [4]. By inhibiting the efflux transporters at the BBB, elacridar can enhance the influx of these transporters’ substrates (such as paclitaxel and topotecan), thereby increasing their availability in the CNS [4]. Notably, elacridar is not one of the first generation of P-gp and BCRP inhibitors developed: it is discovered and developed after two rounds of previous experimentation. Before elacridar was discovered, verapamil and cyclosporine-A were tested as potential efflux transporter inhibitors; however verapamil and cyclosporine-A unsatisfactory potency gave rise to preclinical tests of subsequent generation of drugs such as valspodar [4]. Following the finding of valspodar’s inhibition on cytochrome P450, the third generation of efflux inhibitor – elacridar – was discovered [5]. Currently, elacridar shows potential to effectively inhibit the activity of the two BBB transporters. However, despite the promise of elacridar, the clinical pharmacokinetics (PK) of elacridar remains largely unoptimized and therefore a better understanding of its PK profile is essential to realizing its potential in improving brain penetration for treating CNS disorders.
PK is the study of drug movement in body systems, and is considered an important pillar of drug discovery for its revelation to scientists and clinicians of one drug’s movement and concentration changes in the body [6]. Pharmacodynamics (PD), a field harvesting equally fundamental information to aid drug discovery, studies the extent and duration of action that a drug can trigger in test models [7]. The two fields complement with observations and the monitoring of ADME (absorption, distribution, metabolism, and excretion), a quartet narrating how a drug enters an organism’s systems, gets distributed to all parts of the body by systemic flow (usually the bloodstream), becomes metabolized by different organs and gets eventually removed from the body together with its metabolites.
Pharmacokinetic-pharmacodynamic modeling (PK/PD modeling) is a mathematical and statistical approach used to describe and quantify the relationship between the concentration of a drug (pharmacokinetics) and its effect on the body (pharmacodynamics) [8]. PK/PD modeling is a valuable tool in drug development and clinical pharmacology for understanding and predicting drug response based on drug concentrations. For instance, PK/PD modeling could enable scientists to develop and refine designs for drug delivery to optimize the therapeutic regimen.
Herein, we used PK/PD modeling to explore the brain penetrating potential of elacridar.
2. PK Parameters and Concepts
The study of PK includes constructing a function that illustrates the time course of drug concentration in plasma. Such modeling of drug concentration requires examination and consideration of various parameters, such as dose (D), dosing interval (𝛕), bioavailability (F), clearance (CL), volume of distribution (Vd), elimination and absorption rate constants (ka, ke) and half-life (t1/2). The meaning of these parameters is illustrated below:
Bioavailability (F) is the fraction that enters systemic circulation, elucidating how much of the drug can be absorbed into the blood plasma and delivered to its intended target organs or tissues. The bioavailability of a drug depends on its route of administration: for instance, if a drug is injected intravenously to the patient, it is considered 100% bioavailable as it is directly delivered to the systemic circulation; on the other hand, if the drug is orally administered in the form of tablets, it would have a lower bioavailability value because only a fraction of the dose can be absorbed and is subject to gut and hepatic metabolism, also known as first pass effect (Figure 1):
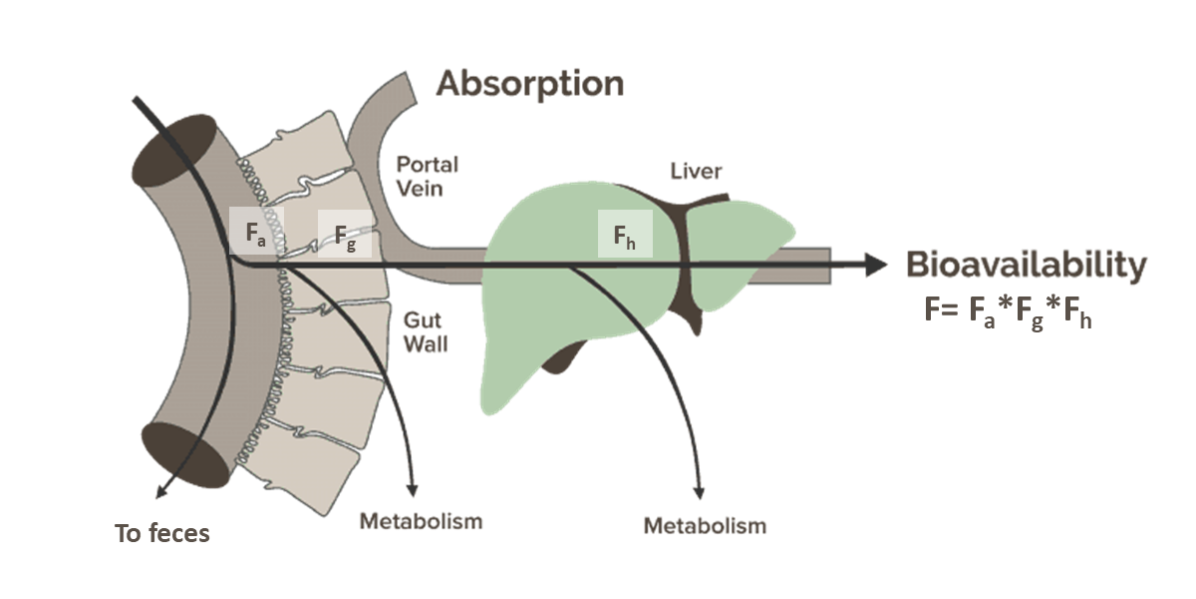
Figure 1. First pass effect, also known as first-pass metabolism, refers to the phenomenon where a portion of an orally administered drug is metabolized before reaching systemic circulation. F = Fa ✕ Fg ✕ Fh, where Fa is the fraction absorbed; Fg is the fraction escaping gut metabolism, and Fh is the fraction escaping hepatic metabolism
Clearance (CL), measured in L/hr or mL/min, is defined as the volume from which a drug is completely removed per unit time. CL reflects how quickly the body eliminates a drug. The major routes of clearance include: 1) hepatic clearance where drugs are broken down by specific enzymes in the liver; 2) renal clearance through which unchanged drugs are excreted into urine, and 3) biliary clearance where the drugs are excreted into bile.
Volume of distribution (Vd) is the total volume of body fluid that the drug circulates in its ADME process. Volume can be calculated by dividing the total amount of the drug by the concentration of a drug at a given time. Vd is used to assess how extensively a drug is distributed throughout the body.
Elimination rate constant (ke) is defined as ke = CL/V. Ke is a PK parameter used to describe the rate of drug removal from the body. It is an essential parameter in determining the drug’s elimination half-life (t1/2), which can be calculated using t1/2 = ln(2) / ke.
The starting concentration, C(0), describes the initial concentration of the drug in the body immediately after its administration. It is calculated as D/Vd, dose divided by volume. In intravenous injections, the C(0) equates to the Cmax as the total drug is directly administered to systemic circulation.
Area under curve (AUC), namely, calculates the total area under the concentration-time function of the drug. It is a measure of total drug exposure over time, and is calculated by the equation of D*F/CL, the total dose of drug entering systemic circulation divided by clearance.
To construct a PK model for elacridar, two routes of administration were considered – intravenous (IV) and extravascular dosing, in this paper considered the modeling for oral (PO) administration route. I have constructed four models to examine the relationship between different parameters and human PK profile of elacridar.
3. PK model building
PK modeling is a mathematical and statistical approach used to describe and predict the concentration-time profiles of drugs in the body based on various physiological and pharmacological parameters. The purpose of PK modeling is to predict the drug concentration time course under a certain dosing regimen. This prediction allows optimization of the dose and dosing interval based on the therapeutic window. This therapeutic window refers to the drug concentration within which a medication is effective while avoiding significant toxicity.
This project developed a PK model of elacridar based on four classic PK models: 1) single-dose intravenous model, 2) multiple-dose intravenous model, 3) single-dose extravascular model, and 4) multiple-dose extravascular model. All above models assume one-compartment distribution kinetics. The therapeutic window of elacridar is determined by the IC50 using various probe substrates (lower bound) and preclinical in vivo studies that showed no toxicity (upper bound).
3.1. Single-dose IV model
Single-dose IV model describes the time course of a drug when it is directly administered into the bloodstream as a single-dose. A typical IV model is shown in Figure 2. When a drug is administered intravenously, the entire amount enters systemic circulation, and therefore no absorption is involved in this route of administration and the bioavailability is considered 100%. Under such circumstances, there are only three input and four output parameters:
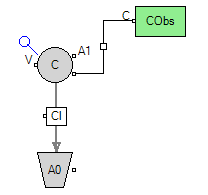
Figure 2. A typical intravenous PK model
Input parameters:
D (mg)
CL (L/hr)
V (L)
Output parameters:
C(0) (mg/L)
ke (/hr)
t1/2 (hr)
AUCinf (mg*hr/L)
As one of the simplest PK model, an IV elacridar model can be constructed using the following equation:
\( C(A)=C(0)×{{e^{-{k_{e}}·t}}^{}} \) (1)
Where \( C(A) \) refers to the concentration of drug A in the body at a given time. As the dose is directly delivered to systemic circulation, the aforementioned starting concentration, \( C(0) \) , can be simple represented as:
\( C(0)=D/V \) (2)
Of which D and V are inputs into the model. Given the simulation of concentration change, a new intermediate parameter \( dAA \) can be conceived that illustrates how much the amount of the drug is cleared from systemic circulation due to elimination processes. As this variable involves the clearance of a drug, or the speed of eliminating a drug from systemic circulation, it can be described using the following equation:
\( dAA=∆t×C(A)×CL \) (3)
Where the \( C(A) \) is the drug concentration derived from the previous moment. Herein, the total amount of drug entering systemic circulation during the time interval, \( AA \) , can then be computed using the following equation:
\( A{A_{last}}=A{A_{previous}}-dAA \) (4)
The two intermediate variables are not essential for this model due to its simple requirements. However, they will play a more significant role in latter models that are more complex to construct and manipulate.
A typical single-dose IV bolus PK profile is shown in Figure 3, with exponential decay shown in linear and logarithmic scale.
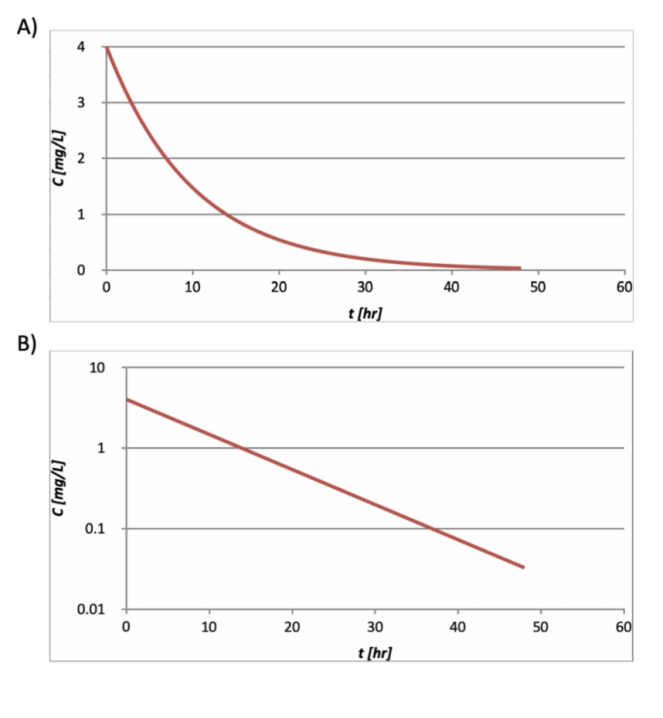
Figure 3. The PK function of a single-dose, intravenous dosed drug with plasma concentration in A) linear scale, and B) logarithmic scale.
3.2. Multiple-dose IV model
Similar to the single-dose IV model, the multiple-dose IV model describes the time course of an intravenously administered drug; the difference is that this model concerns repeat dose. Upon repeat dose, accumulation may occur, which eventually leads to a steady state in which the rate of drug administration equals the rate of drug elimination. At steady state, the drug concentration in the body remains relatively constant over time, and the overall drug exposure becomes predictable. Compared to single-dose IV model, multiple-dose model has to two additional input parameters – 𝛕 (dosing interval) and N (number of doses). As repeat dose leads to a steady state, output parameters are obtained such as Css,max (steady-state maximal concentration), Css,min (steady-state minimal concentration) and AUCss (steady-state area under curve).
The formulation for starting \( C(0) \) and intermediate variable \( dAA \) is calculated as expressed in the single-dose IV model; however, a difference exists in the setting of time. As a new dose of the drug will be administered every 𝛕 hours after the previous one, the concentration cannot be calculated using the aforementioned equation as it neglects the accumulation of added dose. In this case, two additional intermediate variables can be created: \( NA \) , describing the total number of doses the drug is administered at a given time, and \( InputA \) , the total dose amount administered.
As an integer, \( NA \) can be formulated as:
\( NA=Int(t/τ)+1 \) (5)
And hence, if the model detects that the value \( NA \) changes by one unit, \( InputA \) will be added. Hereby, \( AA \) acts as an efficient intermediate variable to conveniently calculate the concentration:
\( A{A_{last}}=A{A_{previous}}-dAA+InputA \)
\( C(0)=AA/V \) (6)
A typical multiple-dose IV PK profile is illustrated as in Figure 4.
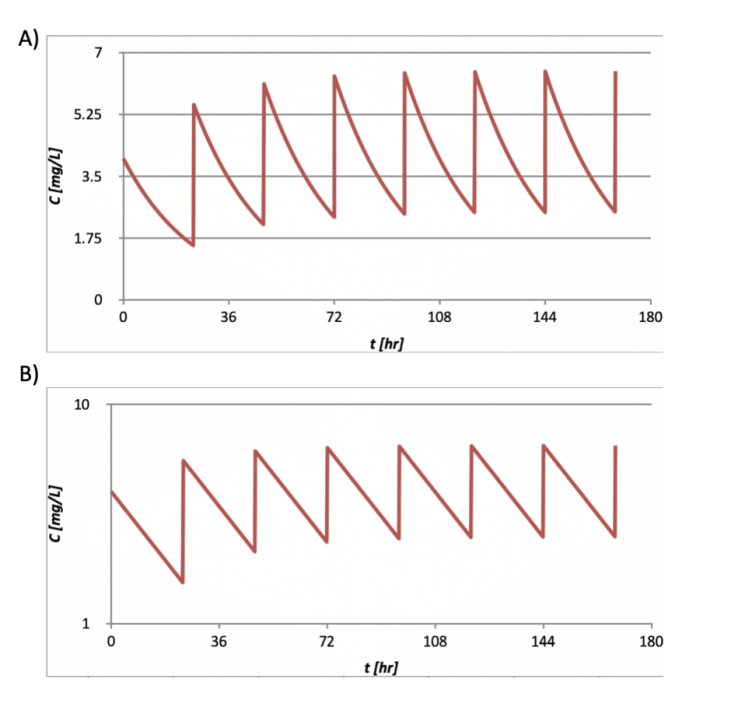
Figure 4. The PK function of a multiple-dose, intravenous dosed drug with plasma concentration in A) linear scale, and B) logarithmic scale.
3.3. Single-dose extravascular model
Single-dose extravascular model describes the time course of a drug upon single-dose by routes other than intravenous injection, typically through oral administration. A typical extravascular model is shown in Figure 5. Compared to the IV model previously described, the oral model includes considerations of bioavailability (F) and absorption rate constant (ka). It is important to note, without F, CL and V cannot be calculated because the amount entering systemic circulation is unknown. In case F is not determined, the CL and V are expressed as CL/F and V/F to incorporate the F term. Additionally, as oral administration involves the absorption process, the concentration rises over time until reaches Cmax and gradually declines afterwards.
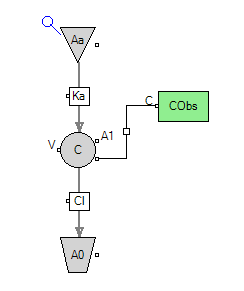
Figure 5. A typical extravascular model
The intermediate variables and data that needs to be calculated additionally includes “Amount to be absorbed” ( \( AaA \) ) using the following equation:
\( AaA=F×D×{{e^{-{k_{a}}×t}}^{}} \) .(7)
With this consideration, the calculation of the amount change ( \( dAA \) ) can be represented as below:
\( dAA=Δt×(CL×C(A)-AaA×ka) \) (8)
where ∆t refers to the change of time, \( C(A) \) represents the concentration of the drug in the body at the previous moment, and \( AaA \) represents the aforementioned ‘amount to be absorbed’ by the target organs from the systemic circulation.
With \( dAA \) , the total amount of drugs present in the body (AA) could be calculated as the \( AaA \) subtract \( dAA \) at the previous unit time, just as formulated in the two previous models.
A typical PK profile of the single-dose, extravascular model is illustrated in Figure 6. A absorption phase can be identified from the models (the yellow curve before Cmax).
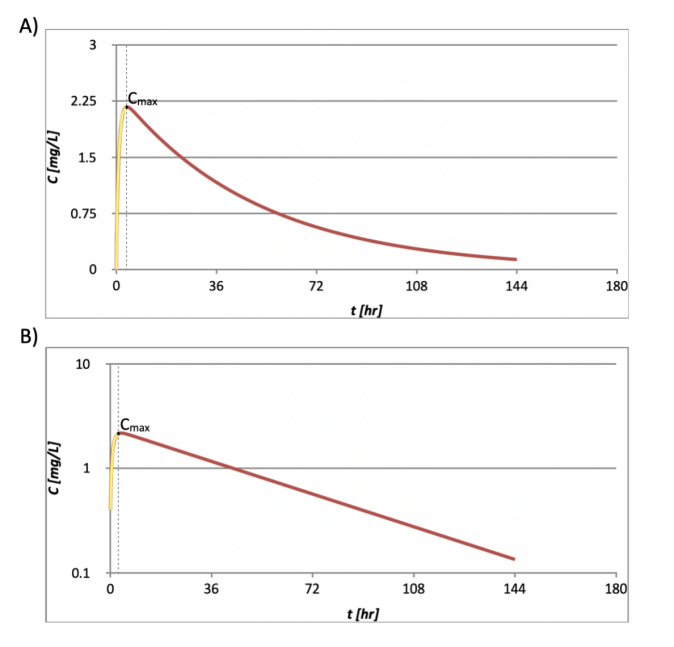
Figure 6. The PK function of a single-dose, extravascular dosed drug with plasma concentration in A) linear scale, and B) logarithmic scale. The absorption phase before Cmax is highlighted in yellow.
3.4. Multiple-dose extravascular model
Multiple-dose extravascular model describes the time course of a drug administered through an extravascular route upon repeat dose. Due to repeat dose, a steady state can be reached after a certain number of doses. The intermediate variables \( NA \) and \( InputA \) are set similarly in the multiple-dose intravenous model with regard to repeat dosing.
A typical multiple-dose extravascular PK model is shown in Figure 7. A steady state is achieved after a few doses.
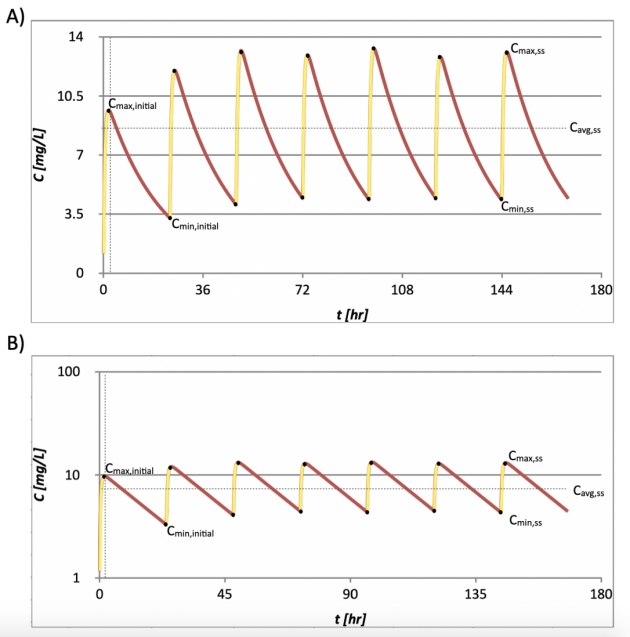
Figure 7. The PK function of a multiple-dose, extravascular dosed drug with plasma concentration in A) linear scale, and B) logarithmic scale. Cmax, Cmin at different stages (initial and steady-state) are noted.
These above PK models can be used to describe linear PK, where the relationship between drug dose and its resulting blood concentration is proportional. In other words, when a drug exhibits linear PK, doubling the dose will approximately double the drug concentration, and halving the dose will result in approximately half the blood concentration. In linear PK models, CL, V, ka, and F remain constant.
4. Elacridar PK model
With the four general PK models on hand, we set out to construct the PK model for elacridar.
Firstly, to build a PK model for elacridar, we used the reported human single-dose clinical PK at 25, 250, and 1000 mg doses.[9] This modeling process is carried out by fitting the reported clinical data using input PK parameters within the model. Having plotted these different values on the chart, the value of the parameters of the classical oral, single-dose PK function can be changed and adjusted so that it best fits these observed data.
Based on the clinical data at oral 25, 250, and 1000 mg, three sets of PK input parameters were obtained, shown in Figure 4 and Table 1. The CL/F and V/F appear relatively constant between 25 and 250 mg; in contrast, 1000 mg dose showed significantly decreased CL/F and much slower ka, which indicates saturation in the absorption and elimination processes. Saturation leads to nonlinear PK, which can no longer be predicted by the linear PK models set forth. Therefore, 1000 mg PK parameters were not used for elacridar PK model building. The final PK parameters were determined as CL/F = 138 (L/hr) and V/F = 2250 (L).
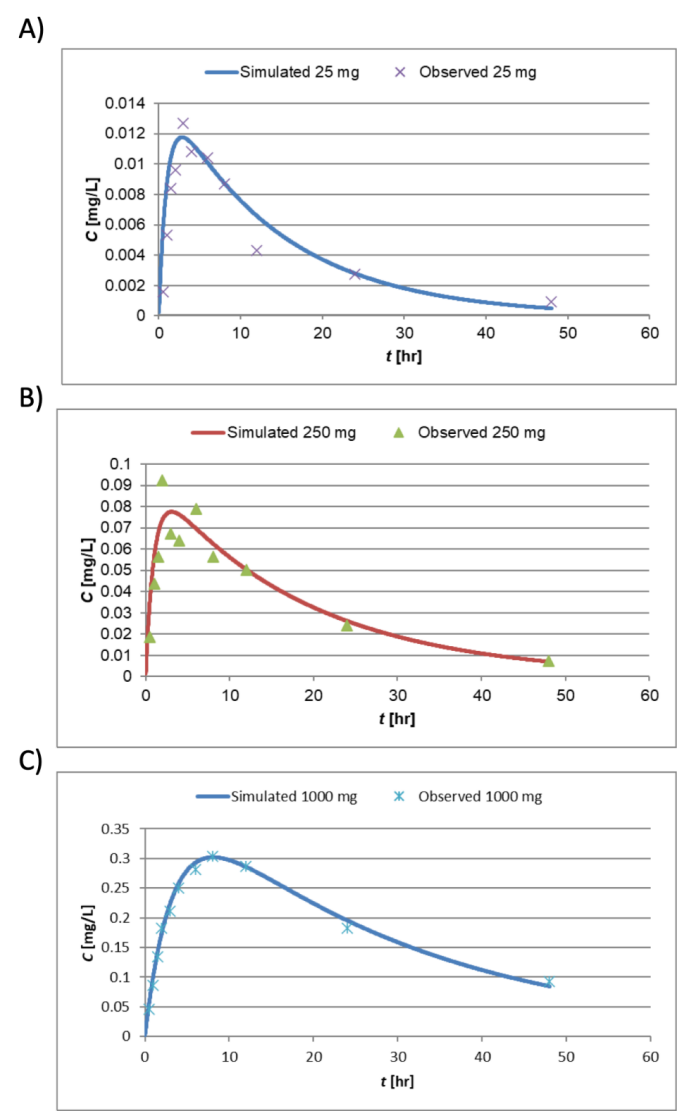
Figure 8. Curve fitting using input PK parameters listed in Table 1. Simulated PK curve overlayed with observed data for A) 25 mg, B) 250 mg, and C) 1000 mg.
Table 1. Input PK parameters used in curve fitting to generate Figure 4.
Input | Average of 25 and 250 mg PK input | |||
Dose (mg) | 25 | 250 | 1000 | <1000 |
CL/F (L/hr) | 125 | 150 | 87.5 | 138 |
V/F (L) | 1750 | 2750 | 2500 | 2250 |
ka (hr-1) | 1 | 1 | 0.3 | 1 |
The upper and lower bound of drug is important in that it provides information on concentrations at which the drug becomes toxic or ineffective. Upper bound is often determined by preclinical safety studies, and lower bound is often determined by IC50 (half maximal inhibitory concentration), an indicator of the inhibitory potency of a substance. The determination of upper and lower bound is discussed below.
Firstly, literature reported IC50 values were used to estimate the lower bound for drug efficacy.[10] These IC50 values were obtained using different probe substrates that elacridar exerts effect on. The literature reported IC50 values of five probe substrates are listed in Table 2. The probe substrates are calcein, digoxin, vinblastine, colchicine, and prazosin. The values displayed in the first row in are considered as naked IC50 as they are measured in the absence of plasma protein; the reported IC50 values in µM were converted to mg/L to match the concentration unit used in the PK model. Displayed in the third row is the protein adjusted IC50 (paIC50), accounted for plasma protein binding; paIC50 is calculated by dividing the naked IC50 over the fraction unbound (fu) of the drug. Adjusting for plasma protein binding is necessary because, based on free drug hypothesis, only the unbound fraction of a drug in the bloodstream is available to interact with its target and exert its therapeutic effects.[11]
As these IC50 values measure the ability of elacridar to effectively inhibit P-gp and allow the passage of these substances, the highest value should be chosen to calculate the lower bound to ensure elacridar’s inhibitory potency. Therefore, the IC50 values obtained in the calcein assay, with a value of 0.0569 mg/L, was used to calculate the lower bound. The paIC50 is calculated to be 0.34 mg/L after dividing 0.0569 by the unbound fraction of 0.168.[12] With this lower bound, the fold coverage is then calculated based on the predicted steady state minimum concentration (Css,min), which is discussed in detail later.
Table 2. The IC50 values of different probe substrates when co-dosed with elacridar. * values are calculated using PK output parameters obtained from the final model.
Calcein | Digoxin | Vinblastine | Cochicine | Prazosin | |
Reported IC50 (µM) | 0.101 | 0.055 | 0.043 | 0.027 | 0.025 |
Converted IC50 (mg/L) | 0.057 | 0.031 | 0.024 | 0.015 | 0.014 |
Calculated paIC50 (mg/L) | 0.34 | 0.18 | 0.14 | 0.09 | 0.08 |
Fold coverage* | 1.2 | 2.1 | 2.7 | 4.3 | 4.7 |
Next, the upper bound concentration describes the maximal concentration of elacridar within the body without causing toxicity and subsequently, harm. This is determined by elacridar exposure in preclinical safety studies reported from the literature, summarized in Table 3.[13] Elacridar was dosed at 300 mg/kg in mouse and rat, and at 30 mg/kg in dog and monkey. The reported exposure, AUC in µg*min/mL was converted to mg*hr/L, and Cmax in ng/mL to mg/L, to match the units used in the PK model. Margin is calculated by comparing the highest exposure level at which no adverse effects are observed in animal studies with the expected human exposure level. The margin calculation is discussed later when predicted human steady state exposure is determined.
Table 3. Reported exposure in preclinical animal studies. * values are calculated using PK output parameters obtained from the final model
Mouse (300 mg/kg) | Rat (300 mg/kg) | Dog (30 mg/kg) | Monkey (30 mg/kg) | |
AUC (µg*min/ml) | 1151 | 107 | 202 | 187 |
AUC (mg*hr/L) | 19.2 | 1.8 | 3.4 | 3.1 |
AUC human margin (fold)* | 2.94 | 0.27 | 0.52 | 0.48 |
Cmax (ng/mL) | 962 | 100 | 219 | 179 |
Cmax (mg/L) | 0.962 | 0.1 | 0.219 | 0.179 |
Cmax human margin (fold)* | 1.42 | 0.15 | 0.32 | 0.26 |
The human margin Cmax can be calculated by dividing the Cmax of tested animals over the steady-state Cmax output in the PK model (0.676 mg/L). As the Cmax human margin needs be greater than 1, the Cmax provided by mouse PK (1.42 mg/L) is selected as the upper bound for elacridar to be considered safe.
Now with PK parameters CL/F of 138 L/hr, V/F of 2250 L, and the therapeutic window set (upper bound = 1.42 mg/ml and lower bound = 0.34 mg/L), the PK model can be configured to find the optimal value of the two remaining input parameters, dose (D) and dosing interval (τ). Notably, as mentioned previously, a dose greater than 1000 mg leads to nonlinear PK and therefore this model cannot be applied at such high dose. On the other hand, short dose interval would be considered inconvenient which can lead to poor patient adherence.
To find the optimal value of the two input parameters (D and τ), the critical criteria is that the PK function should be controlled to fit within the upper and lower bounds. This means that the peaks and troughs of the function should be maintained within therapeutic window. At the same time, the less frequent dosing can improve patient adherence. For instance, a patient would prefer a drug that is administered once per day, rather than every hour.
After exploration of several combinations, we have obtained a dose size of 900 mg and dosing interval of 12 hours (BID) as values that give the best PK profile of elacridar, shown in Figure 5. In addition, combination of dose 500 mg and a dosing interval of 6 hrs (QID, quarter in die) is also attempted and proven plausible, but due to considerations of convenience, the BID dose can be concluded to be the optimal dosing regimen.
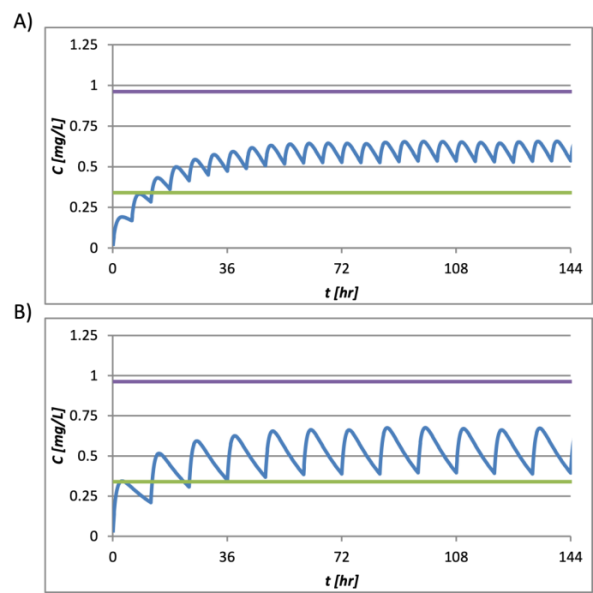
Figure 9. Predicted A) 900 mg BID and B) 500 mg QID PK profiles.
Using the previously constructed multiple-dose extravascular model with 900 mg dose, and 12 hours dose interval as input, we can obtain the following output parameters shown in Table 4. Using the Css,max of 0.676 mg/L and Css,min of 0.392 mg/L, fold coverage can be calculated using predicted human Css,min divided by in vitro paIC50 (listed in Table 2), as well as safety margin using preclinical Cmax divided by predicted human Css,max (listed in Table 3).
Table 4. Input and Output of the built PK model
Input | Output | ||
Dose (mg) | 900 | ke (hr-1) | 0.06 |
CL/F (L/hr) | 138 | t1/2 (hr) | 11.3 |
V/F (L) | 2250 | AUCss (mg*hr/L) | 6.52 |
ka (hr-1) | 1 | Css,max (mg/L) | 0.676 |
τ (hr) | 12 | Css,min (mg/L) | 0.392 |
Css,av (mg/L) | 0.543 | ||
5. Results
Existing preclinical and clinical data were utilized for the determination of elacridar’s therapeutic windows. Through curve fitting with clinical data of varying dose, we are able to determine apparent clearance (CL/F) = 138L/hr and apparent volume of distribution (V/F) = 2250L and the therapeutic window, of which the upper bound = 1.42mg/L and lower bound = 0.34mg/L. With the given therapeutic limits, the multiple-dose extravascular PK model is then used to simulate for the drug orally dosed by patients to obtain an optimal dose regiment with dose of 900 mg with a dose interval of 12 hours (BID).
6. Discussion
6.1. Implications
This project uses modeling to obtain a PK function of elacridar with its parameters derived from preclinical as well as clinical studies. The PK model can clarify the PK properties of elacridar and can be utilized by clinicians to optimize the clinical dose regimen as the phase of the development of the drug transits from preclinical animal tests to clinical test on patients and volunteers. Moreover, the model also provides a tool for efficient calculations of elacridar’s exposure at different regimens: for researchers to want to test elacridar potency while modulating the dose or dosing interval can again input them into the model and adjust them so to ensure that they fall within the therapeutic window. Hence, the results of this project provide valuable implications for researchers on the transition of elacridar development from a stage of preclinical experimentation to possessing more clarified information on elacridar’s human PK profile. This elacridar model also enables researchers and clinicians to better design and conduct clinical studies of elacridar in the future.
6.2. Limitations and Future Directions
Despite the optimal dose regimen being obtained from the model, certain limitations remain in this project that requires further research. As could be noted from Table 3, the parameter of bioavailability is incorporated into other parameters (CL/F, V/F) instead of being listed as an independent parameter. This is because there is no sufficient information provided specifically on elacridar’s bioavailability and it can vary significantly between preclinical animals (mice, rat, dog, monkey) and humans. Therefore, although the PK function and major parameters could be calculated from provided, existing research, future experiments and modeling should aim to clarify elacridar’s bioavailability in humans through different administration routes.
Furthermore, a potential area of exploration is the administration of elacridar through different routes, such as cerebrospinal (CSF) injection and peritoneal injection. A deeper study on balancing convenience from the patient’s perspective and potency on the clinician’s perspective should be instigated, after having compared the PK and PD profiles of elacridar through different administration routes.
7. Conclusion
A series of four basic PK models with different modes of dosing and pathways of administration (single-dose IV, multiple-dose IV, single-dose extravascular, and multiple-dose extravascular) were constructed in this project and used to study the PK profile of elacridar. Existing clinical data were leveraged to determine two of elacridar’s PK input parameters (CL/F and V/F) through curve fitting, and preclinical test results were used to determine elacridar’s therapeutic window. The multiple-dose, extravascular elacridar PK model is subsequently constructed to simulate for the repeat oral administration of the drug to patients. After adjustment, an optimized dose regimen with the value a dose of 900 mg with a dose interval of 12 hours (BID) was obtained, which holds the potential to improve patient adherence and clinical outcome.
References
[1]. Reichel, A. Addressing Central Nervous System (CNS) Penetration in Drug Discovery: Basics and Implications of the Evolving New Concept. Chem. Biodivers. 2009, 6 (11), 2030–2049.
[2]. Daneman, R.; Prat, A. The Blood–Brain Barrier. Cold Spring Harb. Perspect. Biol. 2015, 7 (1), a020412.
[3]. Di, L.; Kerns, E. H.; Carter, G. T. Strategies to Assess Blood–Brain Barrier Penetration. Expert Opin. Drug Discov. 2008, 3 (6), 677–687.
[4]. Dash, R. P.; Jayachandra Babu, R.; Srinivas, N. R. Therapeutic Potential and Utility of Elacridar with Respect to P-Glycoprotein Inhibition: An Insight from the Published in Vitro, Preclinical and Clinical Studies. Eur. J. Drug Metab. Pharmacokinet. 2017, 42, 915–933.
[5]. Chen, H.; Shien, K.; Suzawa, K.; Tsukuda, K.; Tomida, S.; Sato, H.; Torigoe, H.; Watanabe, M.; Namba, K.; Yamamoto, H.; others. Elacridar, a Third-Generation ABCB1 Inhibitor, Overcomes Resistance to Docetaxel in Non-Small Cell Lung Cancer. Oncol. Lett. 2017, 14 (4), 4349–4354.
[6]. Wagner, J. G. History of Pharmacokinetics. Pharmacol. Ther. 1981, 12 (3), 537–562.
[7]. Buxton, I. L. Pharmacokinetics and Pharmacodynamics. Goodman Gilman’s Pharmacol. Basis Ther. 11th Ed N. Y. McGraw-Hill 2006, 1–52.
[8]. Derendorf, H.; Meibohm, B. Modeling of Pharmacokinetic/Pharmacodynamic (PK/PD) Relationships: Concepts and Perspectives. Pharm. Res. 1999, 16, 176–185.
[9]. Sawicki, E.; Verheijen, R. B.; Huitema, A. D.; van Tellingen, O.; Schellens, J. H.; Nuijen, B.; Beijnen, J. H.; Steeghs, N. Clinical Pharmacokinetics of an Amorphous Solid Dispersion Tablet of Elacridar. Drug Deliv. Transl. Res. 2017, 7, 125–131.
[10]. Rautio, J.; Humphreys, J. E.; Webster, L. O.; Balakrishnan, A.; Keogh, J. P.; Kunta, J. R.; Serabjit-Singh, C. J.; Polli, J. W. In Vitro P-Glycoprotein Inhibition Assays for Assessment of Clinical Drug Interaction Potential of New Drug Candidates: A Recommendation for Probe Substrates. Drug Metab. Dispos. 2006, 34 (5), 786–792.
[11]. Bohnert, T.; Gan, L.-S. Plasma Protein Binding: From Discovery to Development. J. Pharm. Sci. 2013, 102 (9), 2953–2994.
[12]. Imai, S.; Arai, T.; Yamada, T.; Niwa, M. Improved In Vitro-In Vivo Correlation by Using the Unbound-Fraction-Adjusted IC 50 for Breast Cancer Resistance Protein Inhibition. Pharm. Res. 2020, 37, 1–11.
[13]. Ward, K. W.; Azzarano, L. M. Preclinical Pharmacokinetic Properties of the P-Glycoprotein Inhibitor GF120918A (HCl Salt of GF120918, 9, 10-Dihydro-5-Methoxy-9-Oxo-N-[4-[2-(1, 2, 3, 4-Tetrahydro-6, 7-Dimethoxy-2-Isoquinolinyl) Ethyl] Phenyl]-4-Acridine-Carboxamide) in the Mouse, Rat, Dog, and Monkey. J. Pharmacol. Exp. Ther. 2004, 310 (2), 703–709.
Cite this article
Yao,X. (2024). Improving brain penetration using elacridar—a P-glycoprotein and BCRP inhibitor. Theoretical and Natural Science,29,50-62.
Data availability
The datasets used and/or analyzed during the current study will be available from the authors upon reasonable request.
Disclaimer/Publisher's Note
The statements, opinions and data contained in all publications are solely those of the individual author(s) and contributor(s) and not of EWA Publishing and/or the editor(s). EWA Publishing and/or the editor(s) disclaim responsibility for any injury to people or property resulting from any ideas, methods, instructions or products referred to in the content.
About volume
Volume title: Proceedings of the 2nd International Conference on Modern Medicine and Global Health
© 2024 by the author(s). Licensee EWA Publishing, Oxford, UK. This article is an open access article distributed under the terms and
conditions of the Creative Commons Attribution (CC BY) license. Authors who
publish this series agree to the following terms:
1. Authors retain copyright and grant the series right of first publication with the work simultaneously licensed under a Creative Commons
Attribution License that allows others to share the work with an acknowledgment of the work's authorship and initial publication in this
series.
2. Authors are able to enter into separate, additional contractual arrangements for the non-exclusive distribution of the series's published
version of the work (e.g., post it to an institutional repository or publish it in a book), with an acknowledgment of its initial
publication in this series.
3. Authors are permitted and encouraged to post their work online (e.g., in institutional repositories or on their website) prior to and
during the submission process, as it can lead to productive exchanges, as well as earlier and greater citation of published work (See
Open access policy for details).
References
[1]. Reichel, A. Addressing Central Nervous System (CNS) Penetration in Drug Discovery: Basics and Implications of the Evolving New Concept. Chem. Biodivers. 2009, 6 (11), 2030–2049.
[2]. Daneman, R.; Prat, A. The Blood–Brain Barrier. Cold Spring Harb. Perspect. Biol. 2015, 7 (1), a020412.
[3]. Di, L.; Kerns, E. H.; Carter, G. T. Strategies to Assess Blood–Brain Barrier Penetration. Expert Opin. Drug Discov. 2008, 3 (6), 677–687.
[4]. Dash, R. P.; Jayachandra Babu, R.; Srinivas, N. R. Therapeutic Potential and Utility of Elacridar with Respect to P-Glycoprotein Inhibition: An Insight from the Published in Vitro, Preclinical and Clinical Studies. Eur. J. Drug Metab. Pharmacokinet. 2017, 42, 915–933.
[5]. Chen, H.; Shien, K.; Suzawa, K.; Tsukuda, K.; Tomida, S.; Sato, H.; Torigoe, H.; Watanabe, M.; Namba, K.; Yamamoto, H.; others. Elacridar, a Third-Generation ABCB1 Inhibitor, Overcomes Resistance to Docetaxel in Non-Small Cell Lung Cancer. Oncol. Lett. 2017, 14 (4), 4349–4354.
[6]. Wagner, J. G. History of Pharmacokinetics. Pharmacol. Ther. 1981, 12 (3), 537–562.
[7]. Buxton, I. L. Pharmacokinetics and Pharmacodynamics. Goodman Gilman’s Pharmacol. Basis Ther. 11th Ed N. Y. McGraw-Hill 2006, 1–52.
[8]. Derendorf, H.; Meibohm, B. Modeling of Pharmacokinetic/Pharmacodynamic (PK/PD) Relationships: Concepts and Perspectives. Pharm. Res. 1999, 16, 176–185.
[9]. Sawicki, E.; Verheijen, R. B.; Huitema, A. D.; van Tellingen, O.; Schellens, J. H.; Nuijen, B.; Beijnen, J. H.; Steeghs, N. Clinical Pharmacokinetics of an Amorphous Solid Dispersion Tablet of Elacridar. Drug Deliv. Transl. Res. 2017, 7, 125–131.
[10]. Rautio, J.; Humphreys, J. E.; Webster, L. O.; Balakrishnan, A.; Keogh, J. P.; Kunta, J. R.; Serabjit-Singh, C. J.; Polli, J. W. In Vitro P-Glycoprotein Inhibition Assays for Assessment of Clinical Drug Interaction Potential of New Drug Candidates: A Recommendation for Probe Substrates. Drug Metab. Dispos. 2006, 34 (5), 786–792.
[11]. Bohnert, T.; Gan, L.-S. Plasma Protein Binding: From Discovery to Development. J. Pharm. Sci. 2013, 102 (9), 2953–2994.
[12]. Imai, S.; Arai, T.; Yamada, T.; Niwa, M. Improved In Vitro-In Vivo Correlation by Using the Unbound-Fraction-Adjusted IC 50 for Breast Cancer Resistance Protein Inhibition. Pharm. Res. 2020, 37, 1–11.
[13]. Ward, K. W.; Azzarano, L. M. Preclinical Pharmacokinetic Properties of the P-Glycoprotein Inhibitor GF120918A (HCl Salt of GF120918, 9, 10-Dihydro-5-Methoxy-9-Oxo-N-[4-[2-(1, 2, 3, 4-Tetrahydro-6, 7-Dimethoxy-2-Isoquinolinyl) Ethyl] Phenyl]-4-Acridine-Carboxamide) in the Mouse, Rat, Dog, and Monkey. J. Pharmacol. Exp. Ther. 2004, 310 (2), 703–709.