


1. Introduction
Cardiac disease is a continuing source of concern due to its high mortality rate and ‘silent’ appearance. Left ventricular noncompaction (LVNC) is a disorder that has only recently gained prominence [1]. High-intensity exercise and pregnancy appear to be risk factors for LVNC, and autosomal mutations are also suspected. It is debatable whether LVNC should be categorised as pathological or physiological [1]. This uncertainty reflects a lack of understanding of the condition and, as a result, complicates the management of LNVC patients [2]. LVNC is distinguished by increased LV trabeculation and intertrabecular recesses that interact within the LV chamber [3]. This disease can cause insufficient blood supply, hypotension, myocardial ischemia, and, in severe cases, mortality due to the creation of a hollow in the myocardium of the ventricle [4]. The LV wall is initially spongy during normal cardiac growth due to the production of trabeculations [5]. As growth develops, these trabeculations become more compact, forming a dense ventricular wall. This compaction does not occur in LVNC. LVNC is frequently linked to cardiac hypertrophy [6]. Diagnoses of LVNC have increased in recent years as a result of major breakthroughs in medical imaging technologies and an increasing awareness of this ailment [7]. LVNC is diagnosed using cardiac imaging, history, and examination. The gold standard for diagnosing LVNC from imaging, however, remains unknown [8]. Recent research in this field has focused on two imaging modalities for diagnosing LVNC: cardiac magnetic resonance imaging (cMRI) and echocardiography; computed tomography (CT) is not preferred due to its high cost and unreliability [9]. As a result, this research will conduct a meta-analysis to compare the use of cMRI and echocardiography for identifying LVNC. The initial premise is that LVNC can be more accurately diagnosed using cMRI rather than echocardiography due to more published studies focusing on cMRI rather than echocardiography for LVNC diagnosis.
2. Materials and Methods
2.1. Identification of Articles
Over the last three years (2020–2022), records of published reports on the imaging utilised for LVNC diagnosis in the PubMed database were identified. Adults (18 years old) of both sexes were eligible for this study. Pregnant women and patients with concomitant cardiac problems were excluded from studies. A more exact judgement must be made using meta-analysis in Excel.
2.2. Article screening
The initial stage in data analysis is frequently article filtering. To filter the initial search results, the article screening method involves title and abstract screening. Once this is completed, data extraction and classification for analysis begin [5]. A fixed-effect model (which assumes a common effect or cause in all studies) and a random-effect model (which assumes different underlying effects or causes between studies) are the two meta-analysis models [10].
The primary objective of article screening is to eliminate research that is evidently unrelated to the subject matter at hand. The process of article screening was conducted in the following manner in this study:
(1) Search terms were defined. These were: left ventricular non-compaction, CT, Echocardiogram, Cardiac magnetic resonance imaging, and diagnosis.
(2) A set of search phrases were used to locate relevant publications. As an illustration, the research employed in this study:
• left ventricular non-compaction + diagnosis
• left ventricular non-compaction + CT
• left ventricular non-compaction + Echocardiogram
• left ventricular non-compaction + Cardiac magnetic resonance imaging
(3) PubMed provides an overview of results documented subsequent to each entry.
(4) Utilise the export feature of PubMed to generate a compilation of articles. The data, including the title of the paper, the year of publication, and the DOI or website address, was exported to Microsoft Excel.
(5) The title screen was utilised to initially identify and exclude articles that were not relevant to the study criteria. Entries excluded included: animals, adolescents, infants and LVNC genetic factors.
(6) The subsequent round of evaluation was the assessment of abstracts. Upon perusing the abstract, papers that were unable to match the established selection criteria were subsequently excluded. Articles that centre on the complexities and long-term outlook of LVNC serve as illustrative instances.
(7) The last stage of screening encompassed the evaluation of the complete text articles. Any articles that did not have primary data were eliminated from the analysis.
2.3. Data extraction
Data extraction is the process of collecting or retrieving data from the screening list of papers. The steps are shown below:
Document the relevant data extracted from the provided articles within a spreadsheet. The retrieved data encompasses all feature parameters observable in the medical image, including the mass ratio between the left ventricular noncompacted muscle and the healthy muscle, as well as the diameter of the left ventricular muscle layer, among others.
The mean, median, standard deviation, and minimum-maximum values were documented in distinct columns for each parameter. One obstacle encountered throughout the research process involved the identification of shared characteristics among the papers, as there existed differences in the terminology employed. Subsequently, the meta-analysis incorporated parameters derived from a minimum of three studies or more.
2.4. Meta-analysis
A random effects model was selected for this study. Due to the time limit for this study, Excel was used for the analysis.
2.5. Plots of forest
The following steps were performed to obtain the forest plots:
1. The upper and lower 95% confidence intervals (CI) were determined by adding and subtracting the standard deviation (SD) of each statistic.
2. Create a scatter chart with the feature values as the y-axis and the 95% CI as the x-axis.
3. Display the specific positive and negative values by adding standard error bars to the data.
3. Results
Table 1 shows that the initial screening had no time limit and yielded a large sample. The 2020–2022 time frame was introduced to allow for the timely completion of this investigation.
Table 1. Comparing search criteria with and without date constraints
Search results without date limit | Search Results for 2020-2022 |
• left ventricular non-compaction diagnosis: 268 • left ventricular non-compaction CT:10 • left ventricular non-compaction Echocardiogram:165 • left ventricular non-compaction Cardiac magnetic resonance imaging:114 | • left ventricular non-compaction diagnosis: 63 • left ventricular non-compaction CT:2 • left ventricular non-compaction Echocardiogram:30 • left ventricular non-compaction Cardiac magnetic resonance imaging: 47 |

Figure 1. The PRISMA flow diagram demonstrating article screening
Figure 1 shows the values for each key parameter from the three studies analysed, which are summarised in Table 2. These key features were external layer thickness, LV end-diastolic diameter, LV end-diastolic volume, LV mass, and end-systolic non-compacted mass/total mass.
Tables 2 to 6 summarise the values for each critical parameter from the three research examined. The significant features were external layer thickness, LV end-diastolic diameter, LV end-diastolic volume, LV mass, and end-systolic non-compacted mass/total mass.
Table 2. Dice external layer (EL)
Author, publish year | DEL value | DEL SD |
Rodríguez-de-Vera et al. 2022) | 0.89 | 0.25 |
(Guigui et al. 2022) | 0.52 | 0.24 |
(Gebhard et al. 2020) | 0.5 | 0.2 |
Table 3. Left ventricular end-systolic diameter (LVESd) (mm)
Author, publish year | LVESd value | LVESD SD |
Stämpfli et al. 2022 | 54.1 | 12.3 |
Guigui et al. 2022 | 3.2 | 0.6 |
Bogunovic et al. 2021 | 50 | 12 |
Table 4. LV end‐diastolic volume index (ml/m2)
Author, publish year | LVEDvi value | LVEDvi SD |
Femia et al. 2021 | 83.6 | 19.2 |
Choudhary et al. 2020 | 128 | 44 |
Donghi et al. 2020 | 77.1 | 30.1 |
Table 5. Left ventricular mass (g)
Author, publish year | LVM value | LVM SD |
Demir et al. 2022 | 78.8 | 25.6 |
Guigui et al. 2022 | 127.6 | 31.4 |
Bogunovic et al. 2021 | 104 | 37 |
Table 6. End-systolic non-compacted mass/total mass, mean (%)
Author, publish year | value | SD |
Demir et al. 2022 | 37.3 | 12.3 |
Guigui et al. 2022 | 40.4 | 6.7 |
Bogunovic et al. 2021 | 28.0 | 5.6 |
A forest graph was built for each parameter to analyse its similarity to the study outcomes. Figures 2-6 depict this.
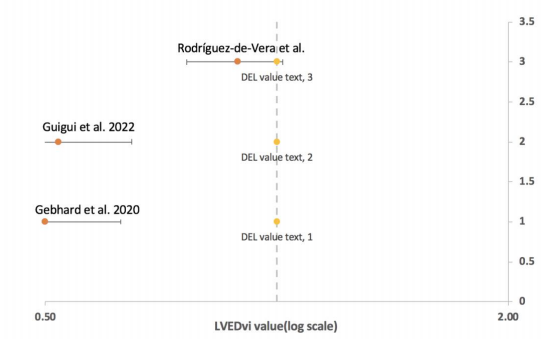
Figure 2. DEL value (log scale)
Figure 2 depicts the distribution of DEL values for three different articles, with DEL ranging from 0.50 to 2.00 on a log scale. The three horizontal lines are standard error bars, the label is the DEL value, and the article is displayed. The position of the crossbars is shown by the yellow dot on the vertical dotted line. This graph shows how Article 3 differs from Articles 1 and 2. Echocardiology was employed in Articles 1 and 2, and cMRI was used in Article 3.
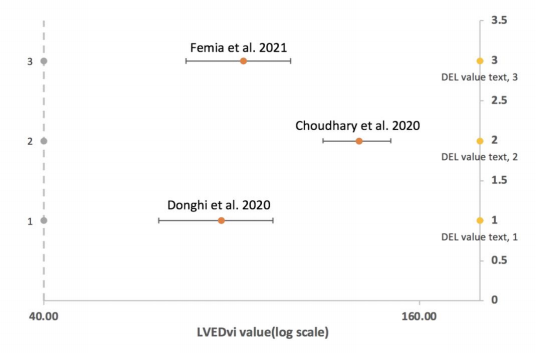
Figure 3. LV end‐diastolic volume index (ml/m2)
Figure 3 depicts the distribution of the: LV enddiastolic volume index of three articles, with the LV enddiastolic volume index ranging from 40 to 200 in the log scale. The three horizontal lines are standard error bars, the label is the LV end-diastolic volume index, and the article is displayed. The position of the crossbars is shown by the yellow dot on the vertical dotted line. This graph shows how Article 2 differs from Articles 1 and 3. Echocardiology was employed in Article 2, while cMRI was used in Articles 1 and 3.
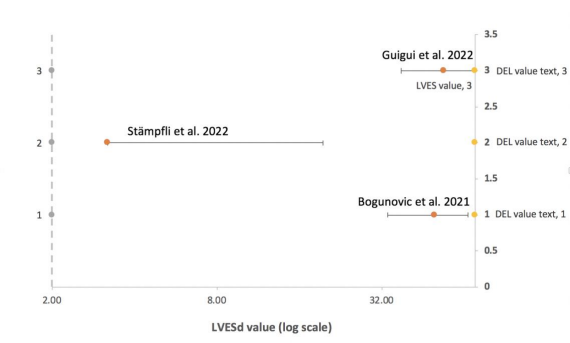
Figure 4. Left ventricular end-systolic diameter (LVESd) (mm)
Figure 4 depicts the distribution of the: LVESd of three different items, with the LVESd range being 2-70 in the log scale. The three horizontal lines reflect standard error bars, the label: LVESd, and the article. The position of the crossbars is shown by the yellow dot on the vertical dotted line. This graph shows how Article 2 differs from Articles 1 and 3. Echocardiology was employed in Articles 1 and 3, while cMRI was used in Article 2.

Figure 5. Left ventricular mass (g)
Figure 5 depicts the distribution of left ventricular mass in three separate publications, with a range of 50–170 in the log scale. The three horizontal lines are standard error bars, and the label reflects the following: Left ventricular mass, and the article. The position of the crossbars is shown by the yellow dot on the vertical dotted line. This graph shows how Article 3 differs from Articles 1 and 2. Echocardiology was employed in Articles 1 and 2, and cMRI was used in Article 3.

Figure 6. End-systolic non-compacted mass/total mass, mean (%)
Figure 6 depicts the distribution of the: Left ventricular mass of three separate articles, with a range of 20–60 in the log scale. The three horizontal lines are standard error bars, and the label reflects the following: Left ventricular mass, and the article. The position of the crossbars is shown by the yellow dot on the vertical dotted line. This graph shows how article 1 differs from Articles 2 and 3. Echocardiology was employed in Articles 1 and 2, while cMRI was used in Article 3.
4. Discussion
This study studied the imaging gold standard for the diagnosis of LVNC with the goal of comparing the gap between different diagnostic approaches, identifying data that deviates from the group, and determining a more reliable diagnostic method.
According to the techniques, the articles were screened to include all human adults. The final number of papers was 13 for LVNC diagnosis, 1 for LVNC CT, 5 for LVNC Echocardiogram, and 8 for LVNC cMRI. Because there has only been one report on CT diagnosis in the last three years, we will only compare cMRI and echocardiography in this study.
Data for the variables dice external layer (DEL), mean wall thickness (mm), NC/C ratio, and other data were retrieved and evaluated. The thickness of the left ventricular wall is a key factor in determining the progression of LVNC. LVNC patients typically have lower quality, less density, gaps, and diameter expansion [11]. End-systolic diameter and end-diastolic volume can indicate the extent of LV wall deterioration [12]. Due to uncompacted left ventricular walls, LVNC patients have lower output volume and (decreased end-systolic volume and end-diastolic volume) [11]. In the meta-analysis, the following features were used: dice external layer (DEL), left ventricular end-systolic diameter (LVESd) (mm), LV end-diastolic volume index (ml/m2), left ventricular mass (g), and end-systolic non-compacted mass/total mass, mean (%).
For each parameter, the data was visualised and evaluated using a forest plot (Figures 2–6). Rodrguez-de-Vera et al. 2022 (Article 1) is the one closest to the centre vertical dashed line (line of effect) in Figure 2. The line of effect denotes the point at which there are no discernible differences between the two groups. Article 1 data differs significantly from articles 2 and 3. While the distinctions between Articles 2 and 3 are minor, the first article employed cMRI for imaging, while the other two used echo. If the 95% CI crosses the line of no effect, the result is not significant (p > 0.05); if it does not, the data is significant [13]. As a result, all of the data in Figures 3-6 can be used for the next data analysis, except for the data for Article 3 in Figure 1, where no effect was seen; hence, we removed this data.
The dice coefficient was calculated as a measure of segmentation precision [14]. Its value ranges from 0 to 1, with one being the most accurate measurement result [15]. Except for the excluded number for Article 3 in Figure 2, there is no evident difference in the findings between Articles 2 and 1. Therefore, we cannot say which approach is more accurate in this figure. The data distribution of the LV end-diastolic volume index (ml/m2) is shown in Figure 3. Articles 1-3 are shown in Figure 2 from bottom to top (in the same reading order as Excel). The figure illustrates that the gap between Articles 1 and 3 [9] is smaller than the distance between Articles 2 and 3 [16]. Article 2 employs cMRI, whereas Articles 1 and 3 employ echocardiology. The diagnosis of cMRI is more accurate based on the results provided in this picture. This assumption, however, needs to be validated further.
In Figure 4, only Article 2 [6] demonstrated significant differences using the same way as before, and its diagnostic method was echocardiology. As seen in Figure 3, cMRI provided a more accurate diagnosis. Figure 5 shows that the difference between Articles 3 [17], 2 [6], and 1 [13] is not evident; therefore, we cannot determine which approach is more exact. The most noticeable difference is shown in Figure 6 by Article 1 [13]. The technique employed is cMRI. Unlike the previous conclusion, the outcome currently is that Echo has a more accurate diagnosis.
5. Conclusion
Since just these five people are currently involved in the enquiry, it is impossible to say which method is the gold standard for LVNC diagnosis. More data will be required in the future to rule out the possibility of the findings. After identifying which of cMRI and echocardiology is more diagnostically reliable, it is vital to investigate the factors that contribute to the failure to determine in this report. This may be related to gender, and whether male and female will alter LVNC diagnosis is also worth considering [18]. Furthermore, different jobs may be discussed, such as the interference of physiological factors such as high-intensity sports and pregnant women, and whether the diagnosis of LVNC would be influenced.
References
[1]. E. Kayvanpour et al., “Clinical and genetic insights into non-compaction: a meta-analysis and systematic review on 7598 individuals,” Clin Res Cardiol, vol. 108, no. 11, pp. 1297–1308, Nov. 2019, doi: 10.1007/s00392-019-01465-3.
[2]. E. National Academies of Sciences et al., “The Impact of Vision Loss,” in Making Eye Health a Population Health Imperative: Vision for Tomorrow, National Academies Press (US), 2016. Accessed: Oct. 27, 2023. [Online]. Available: https://www.ncbi.nlm.nih.gov/books/NBK402367/
[3]. S. B. Ross et al., “A systematic review and meta-analysis of the prevalence of left ventricular non-compaction in adults,” European Heart Journal, vol. 41, no. 14, pp. 1428–1436, Apr. 2020, doi: 10.1093/eurheartj/ehz317.
[4]. S. Gati et al., “Increased left ventricular trabeculation in highly trained athletes: do we need more stringent criteria for the diagnosis of left ventricular non-compaction in athletes?,” Heart, vol. 99, no. 6, pp. 401–408, Mar. 2013, doi: 10.1136/heartjnl-2012-303418.
[5]. P. Choudhary, W. Strugnell, R. Puranik, C. Hamilton-Craig, S. Kutty, and D. S. Celermajer, “Left ventricular non-compaction in patients with single ventricle heart disease,” Cardiol Young, vol. 30, no. 1, pp. 12–18, Jan. 2020, doi: 10.1017/S1047951119001872.
[6]. S. A. Guigui, S. A. Horvath, I. A. Arenas, and C. G. Mihos, “Cardiac geometry, function and mechanics in left ventricular non-compaction cardiomyopathy with preserved ejection fraction,” J Echocardiogr, vol. 20, no. 3, pp. 144–150, Sep. 2022, doi: 10.1007/s12574-021-00560-7.
[7]. “Noncompaction Cardiomyopathy—History and Current Knowledge for Clinical Practice - PMC.” Accessed: Oct. 27, 2023. [Online]. Available: https://www.ncbi.nlm.nih.gov/pmc/articles/PMC8199228/
[8]. C. Gebhard, B. E. Stähli, M. Greutmann, P. Biaggi, R. Jenni, and F. C. Tanner, “Reduced left ventricular compacta thickness: a novel echocardiographic criterion for non-compaction cardiomyopathy,” J Am Soc Echocardiogr, vol. 25, no. 10, pp. 1050–1057, Oct. 2012, doi: 10.1016/j.echo.2012.07.003.
[9]. G. Femia et al., “Long term clinical outcomes associated with CMR quantified isolated left ventricular non-compaction in adults,” Int J Cardiol, vol. 328, pp. 235–240, Apr. 2021, doi: 10.1016/j.ijcard.2020.12.017.
[10]. S. Hamilton, S. Cummings, and S. Shah, “Left Ventricular Non-compaction Cardiomyopathy: Delayed Diagnosis and Deleterious Outcomes,” Cureus, vol. 13, no. 6, p. e16041, doi: 10.7759/cureus.16041.
[11]. D. P. Singh and H. Patel, “Left Ventricular Noncompaction Cardiomyopathy,” in StatPearls, Treasure Island (FL): StatPearls Publishing, 2023. Accessed: Oct. 27, 2023. [Online]. Available: http://www.ncbi.nlm.nih.gov/books/NBK537025/
[12]. A. B. Bornstein, S. S. Rao, and K. Marwaha, “Left Ventricular Hypertrophy,” in StatPearls, Treasure Island (FL): StatPearls Publishing, 2023. Accessed: Oct. 27, 2023. [Online]. Available: http://www.ncbi.nlm.nih.gov/books/NBK557534/
[13]. J. M. Rodríguez-de-Vera, G. Bernabé, J. M. García, D. Saura, and J. González-Carrillo, “Left ventricular non-compaction cardiomyopathy automatic diagnosis using a deep learning approach,” Comput Methods Programs Biomed, vol. 214, p. 106548, Feb. 2022, doi: 10.1016/j.cmpb.2021.106548.
[14]. G. Bazoukis et al., “Predictors of fatal arrhythmic events in patients with non-compaction cardiomyopathy: a systematic review,” Heart Fail Rev, vol. 27, no. 6, pp. 2067–2076, Nov. 2022, doi: K. Høyland, A. Mohamed Ali, J. Vegsundvåg, J. B. Chambers, and S. Saeed, “Echocardiographic features of left ventricular recess, cleft, diverticulum, and aneurysm: A systematic review,” J Clin Ultrasound, vol. 50, no. 3, pp. 339–346, Mar. 2022, doi: 10.1002/jcu.23155.
[15]. V. Donghi et al., “Left-ventricular non-compaction-comparison between different techniques of quantification of trabeculations: Should the diagnostic thresholds be modified?,” Arch Cardiovasc Dis, vol. 113, no. 5, pp. 321–331, May 2020, doi: 10.1016/j.acvd.2020.01.004.
[16]. E. Demir et al., “Characteristics and long-term survival of patients with left ventricular non-compaction cardiomyopathy,” ESC Heart Fail, Sep. 2022, doi: 10.1002/ehf2.14081.
[17]. Z. Zhang et al., “Whole‐genome sequencing identifies novel candidate pathogenic variants associated with left ventricular non‐compaction in a three‐generation family,” Clin Transl Med, vol. 11, no. 8, p. e501, Aug. 2021, doi: 10.1002/ctm2.501.
Cite this article
Gu,Y. (2024). Research on the gold criteria of imaging to diagnose left ventricular non-compaction. Theoretical and Natural Science,29,122-130.
Data availability
The datasets used and/or analyzed during the current study will be available from the authors upon reasonable request.
Disclaimer/Publisher's Note
The statements, opinions and data contained in all publications are solely those of the individual author(s) and contributor(s) and not of EWA Publishing and/or the editor(s). EWA Publishing and/or the editor(s) disclaim responsibility for any injury to people or property resulting from any ideas, methods, instructions or products referred to in the content.
About volume
Volume title: Proceedings of the 2nd International Conference on Modern Medicine and Global Health
© 2024 by the author(s). Licensee EWA Publishing, Oxford, UK. This article is an open access article distributed under the terms and
conditions of the Creative Commons Attribution (CC BY) license. Authors who
publish this series agree to the following terms:
1. Authors retain copyright and grant the series right of first publication with the work simultaneously licensed under a Creative Commons
Attribution License that allows others to share the work with an acknowledgment of the work's authorship and initial publication in this
series.
2. Authors are able to enter into separate, additional contractual arrangements for the non-exclusive distribution of the series's published
version of the work (e.g., post it to an institutional repository or publish it in a book), with an acknowledgment of its initial
publication in this series.
3. Authors are permitted and encouraged to post their work online (e.g., in institutional repositories or on their website) prior to and
during the submission process, as it can lead to productive exchanges, as well as earlier and greater citation of published work (See
Open access policy for details).
References
[1]. E. Kayvanpour et al., “Clinical and genetic insights into non-compaction: a meta-analysis and systematic review on 7598 individuals,” Clin Res Cardiol, vol. 108, no. 11, pp. 1297–1308, Nov. 2019, doi: 10.1007/s00392-019-01465-3.
[2]. E. National Academies of Sciences et al., “The Impact of Vision Loss,” in Making Eye Health a Population Health Imperative: Vision for Tomorrow, National Academies Press (US), 2016. Accessed: Oct. 27, 2023. [Online]. Available: https://www.ncbi.nlm.nih.gov/books/NBK402367/
[3]. S. B. Ross et al., “A systematic review and meta-analysis of the prevalence of left ventricular non-compaction in adults,” European Heart Journal, vol. 41, no. 14, pp. 1428–1436, Apr. 2020, doi: 10.1093/eurheartj/ehz317.
[4]. S. Gati et al., “Increased left ventricular trabeculation in highly trained athletes: do we need more stringent criteria for the diagnosis of left ventricular non-compaction in athletes?,” Heart, vol. 99, no. 6, pp. 401–408, Mar. 2013, doi: 10.1136/heartjnl-2012-303418.
[5]. P. Choudhary, W. Strugnell, R. Puranik, C. Hamilton-Craig, S. Kutty, and D. S. Celermajer, “Left ventricular non-compaction in patients with single ventricle heart disease,” Cardiol Young, vol. 30, no. 1, pp. 12–18, Jan. 2020, doi: 10.1017/S1047951119001872.
[6]. S. A. Guigui, S. A. Horvath, I. A. Arenas, and C. G. Mihos, “Cardiac geometry, function and mechanics in left ventricular non-compaction cardiomyopathy with preserved ejection fraction,” J Echocardiogr, vol. 20, no. 3, pp. 144–150, Sep. 2022, doi: 10.1007/s12574-021-00560-7.
[7]. “Noncompaction Cardiomyopathy—History and Current Knowledge for Clinical Practice - PMC.” Accessed: Oct. 27, 2023. [Online]. Available: https://www.ncbi.nlm.nih.gov/pmc/articles/PMC8199228/
[8]. C. Gebhard, B. E. Stähli, M. Greutmann, P. Biaggi, R. Jenni, and F. C. Tanner, “Reduced left ventricular compacta thickness: a novel echocardiographic criterion for non-compaction cardiomyopathy,” J Am Soc Echocardiogr, vol. 25, no. 10, pp. 1050–1057, Oct. 2012, doi: 10.1016/j.echo.2012.07.003.
[9]. G. Femia et al., “Long term clinical outcomes associated with CMR quantified isolated left ventricular non-compaction in adults,” Int J Cardiol, vol. 328, pp. 235–240, Apr. 2021, doi: 10.1016/j.ijcard.2020.12.017.
[10]. S. Hamilton, S. Cummings, and S. Shah, “Left Ventricular Non-compaction Cardiomyopathy: Delayed Diagnosis and Deleterious Outcomes,” Cureus, vol. 13, no. 6, p. e16041, doi: 10.7759/cureus.16041.
[11]. D. P. Singh and H. Patel, “Left Ventricular Noncompaction Cardiomyopathy,” in StatPearls, Treasure Island (FL): StatPearls Publishing, 2023. Accessed: Oct. 27, 2023. [Online]. Available: http://www.ncbi.nlm.nih.gov/books/NBK537025/
[12]. A. B. Bornstein, S. S. Rao, and K. Marwaha, “Left Ventricular Hypertrophy,” in StatPearls, Treasure Island (FL): StatPearls Publishing, 2023. Accessed: Oct. 27, 2023. [Online]. Available: http://www.ncbi.nlm.nih.gov/books/NBK557534/
[13]. J. M. Rodríguez-de-Vera, G. Bernabé, J. M. García, D. Saura, and J. González-Carrillo, “Left ventricular non-compaction cardiomyopathy automatic diagnosis using a deep learning approach,” Comput Methods Programs Biomed, vol. 214, p. 106548, Feb. 2022, doi: 10.1016/j.cmpb.2021.106548.
[14]. G. Bazoukis et al., “Predictors of fatal arrhythmic events in patients with non-compaction cardiomyopathy: a systematic review,” Heart Fail Rev, vol. 27, no. 6, pp. 2067–2076, Nov. 2022, doi: K. Høyland, A. Mohamed Ali, J. Vegsundvåg, J. B. Chambers, and S. Saeed, “Echocardiographic features of left ventricular recess, cleft, diverticulum, and aneurysm: A systematic review,” J Clin Ultrasound, vol. 50, no. 3, pp. 339–346, Mar. 2022, doi: 10.1002/jcu.23155.
[15]. V. Donghi et al., “Left-ventricular non-compaction-comparison between different techniques of quantification of trabeculations: Should the diagnostic thresholds be modified?,” Arch Cardiovasc Dis, vol. 113, no. 5, pp. 321–331, May 2020, doi: 10.1016/j.acvd.2020.01.004.
[16]. E. Demir et al., “Characteristics and long-term survival of patients with left ventricular non-compaction cardiomyopathy,” ESC Heart Fail, Sep. 2022, doi: 10.1002/ehf2.14081.
[17]. Z. Zhang et al., “Whole‐genome sequencing identifies novel candidate pathogenic variants associated with left ventricular non‐compaction in a three‐generation family,” Clin Transl Med, vol. 11, no. 8, p. e501, Aug. 2021, doi: 10.1002/ctm2.501.