


1. Introduction
The stock market, a dynamic and ever-evolving arena, plays a multifaceted role in financial decision-making. Analysis and forecasting of stocks hold pivotal significance, aiding investors in making informed investment choices, mitigating risks, managing investor relations, and optimising asset allocations [1, 2]. Additionally, it serves as a vital source of capital for countless investors [3]. Within this dynamic landscape, the stock market offers an endless realm of possibilities for traders, investors, and corporate leaders. Google, now known as Alphabet Inc., stands as a technological powerhouse that consistently redefines innovation and growth. The understanding of Google’s stock price trends holds great importance for investors and offers a valuable case study for financial analysis and forecasting. In this ever-evolving market, tracking Google’s stock provides valuable insights into the evolving landscape of technology and finance, making it a subject of continuous interest and exploration.
The analysis and forecasting of stock prices encompass a multitude of diverse methodologies, each with its unique set of strengths and weaknesses. Fundamental analysis entails the evaluation of a stock’s intrinsic value based on financial data and market conditions [4]. This approach provides a comprehensive and holistic viewpoint but may struggle to elucidate the constantly shifting tides of market sentiment. On the other hand, technical analysis delves into historical price and trading volume data, primarily seeking to identify short-term trends and trading opportunities [5]. Nevertheless, it is prone to the influence of noise and might not effectively capture fundamental changes in a stock’s value. Sentiment analysis harnesses the power of social media and Natural Language Processing (NLP) to access real-time sentiment data [6], while machine learning and artificial intelligence employ sophisticated algorithms for data-driven predictions. Each of these methods brings its unique set of advantages and disadvantages to the table.
Mondal et al. (2014) studied ARIMA models on 56 Indian stocks from different industries to assess their predictive accuracy for stock market trends. ARIMA order selection was based on AIC, and the study found consistent accuracy across various training dataset sizes. Model accuracy, measured with MAE, reached 85%, albeit varying by industry. In this experiment, while the ARIMA model shows great potential in stock market forecasting, it exhibits subtle differences when analyzing specific industries and faces limitations in capturing non-linear market trends [7]. Bandyopadhyay & Guha (2016) employed ARIMA (1,1,1) to predict future gold prices, determined via ACF and PACF plots. The model was evaluated using RMSE, MAPE, MAE, BIC, and Lung’s box Q statistic. However, it has limitations in detecting small variations, unsuitable for rapid changes, and relies on linear historical data despite non-linearity in gold prices [8]. Kobiela, Dariusz, et al., study compared ARIMA and LSTM models using NASDAQ data to predict daily and monthly average prices for selected companies. It evaluates model performance based on input data, parameters, and features using mean square error (MSE) and mean absolute percentage error (MAPE). ARIMA is superior to LSTM, especially in multi-period forecasting, with specific parameters and a longer data window [9]. Zhou, Liwen used an ARIMA(2,1,2) model to predict the price of the Chinese corn market, providing short-term forecasting capabilities. While effective in capturing short-term price fluctuations, it may lack accuracy for long-term predictions and requires frequent data updates to maintain reliability [10].
The ARIMA model is a robust technique in econometrics and time series analysis used to predict future values based on historical data patterns [11]. Its application, particularly in the realm of financial analysis and stock price forecasting, has garnered significant attention. However, it necessitates stringent data requirements. This paper exclusively focuses on forecasting Google stock prices and delves into the application of the ARIMA model. The study reveals the methodology, challenges, and potential insights this approach can provide when analysing and predicting Google’s stock prices.
2. Methods
2.1. Data source
The data in this paper is gathered from Yahoo finance and includes multiple historical values for Amazon’s stock from 2018-01-01 to 2023-10-17. There are in total 6 variables in the dataset and 304 observations.
2.2. ARIMA Model
AutoRegressive Integrated Moving Average (ARIMA) model is a powerful tool in time series analysis, combining autoregressive (AR) and moving average (MA) processes to build models. It focuses on assessing the integrative properties of time series data, essentially achieving data stability through differencing. Stationary time series exhibit consistent mean and variance, with values not significantly deviating from their initial values, and covariance reliant on time intervals rather than start times. Constructing an ARIMA model typically involves three phases: identification, estimation and testing, and diagnostic examination. In the identification phase, time series characteristics are evaluated to determine if differencing is required for achieving stationarity. The estimation and testing phase entails parameter estimation and model selection based on various criteria, including parameter significance, error measures, and information criteria. The final step, diagnostic checks, analyse the properties of model residuals to assess its suitability for forecasting. ARIMA models find widespread application in the financial sector, notably in stock price prediction. They can be employed for the analysis of both stationary and non-stationary time series data, offering valuable insights into market trends and price movements. In summary, the ARIMA model assumes a pivotal role in time series analysis, facilitating comprehension and prediction of time-related data behaviors.
3. Results and discussion
The closing price, denoting a stock’s value at the end of a trading day [2], serves as a critical metric. Analyzing Google’s stock with a weekly focus on one day’s closing price offers a streamlined approach, simplifying the data while emphasising significant weekly trends. This method excels in capturing long-term trading patterns, making it particularly appealing to investors with a broader perspective. The approach effectively filters out market noise, enhancing the ability to identify overarching trends. Figure 1 presents a comprehensive dataset, encompassing the closing prices for each week from 2018 to 10/17/2023, totalling 304 data points. This extensive dataset provides a rich source of information for investors and analysts seeking to gain insights into Google’s stock performance over an extended period. The weekly granularity allows for a macroscopic view, aiding in the recognition of enduring trends and patterns in Google’s stock value (Figure 1).
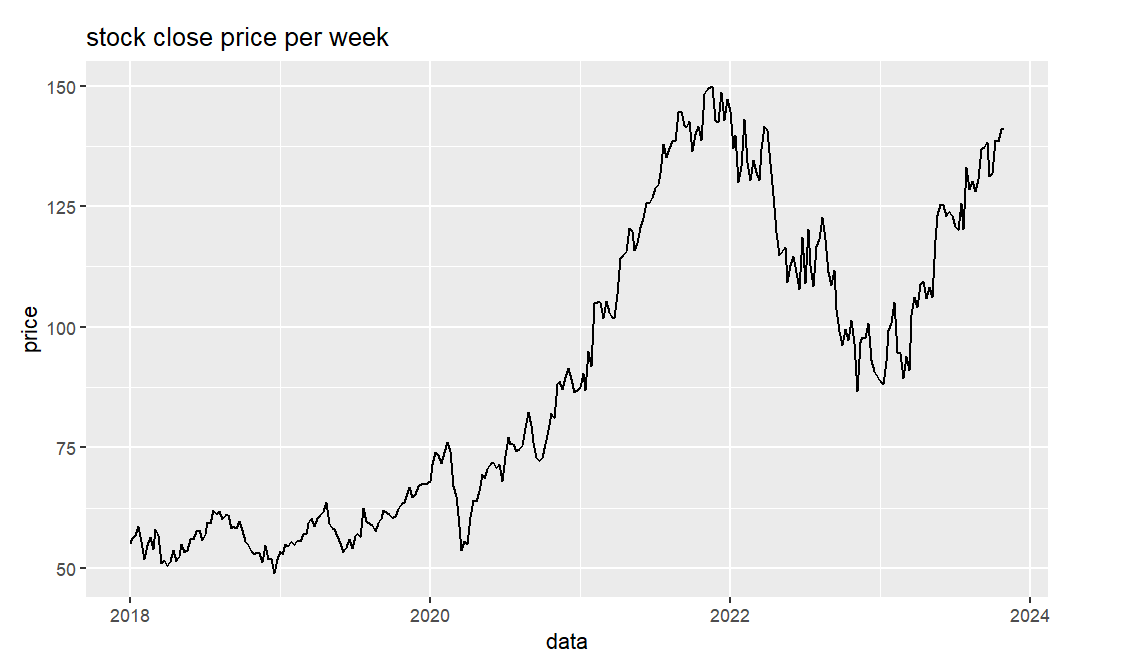
Figure 1. The closing stock price of Google per week from 01/01/2018-10/17/2023.
Prior to establishing the ARIMA model, it’s imperative that the data displays stationarity in both mean and variance. A thorough analysis of Figure 1’s time series data plot reveals a prominent upward trend along with fluctuations in stock growth, highlighting non-stationarity in both mean and variance. To optimise the fit of the ARIMA model, addressing this non-stationarity in the recorded closing prices is crucial. In the context of the dataset utilised in the article, it necessitates applying first-order differencing to achieve the desired stationarity, facilitating more accurate and effective time series modelling and analysis (Figure 2).
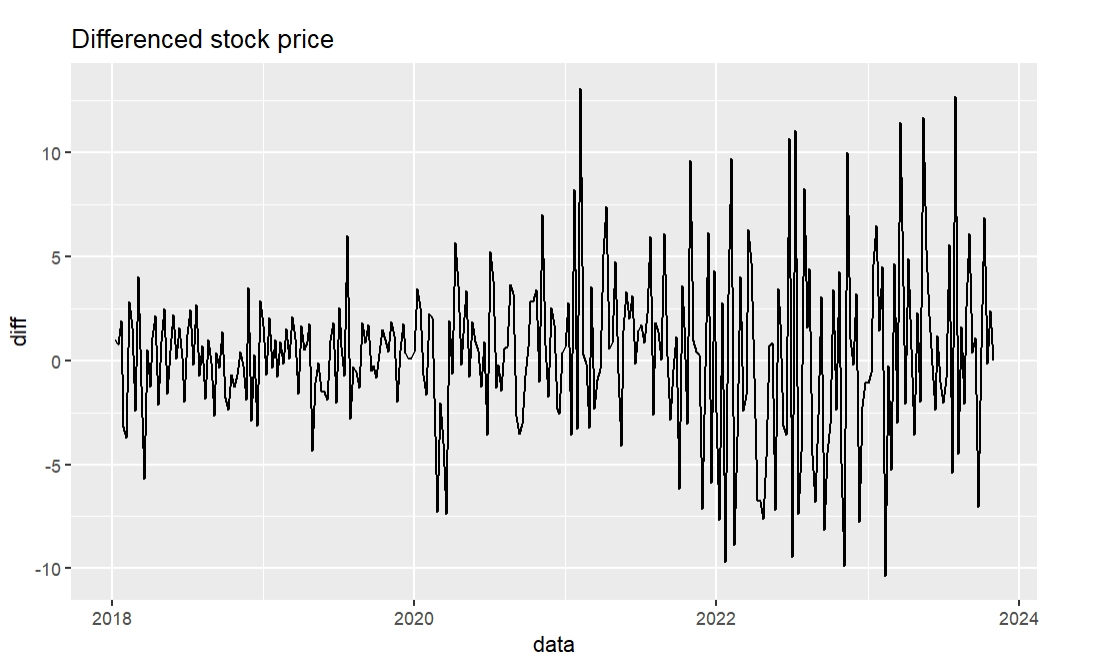
Figure 2. Differentiated stock price.
The results of the Augmented Dickey-Fuller (ADF) test for the time series ‘d_st’ (data after first differencing) suggest that the data is likely stationary. The Dickey-Fuller statistic of -6.9411, accompanied by a low p-value of 0.01, leads to the rejection of the null hypothesis in favour of stationarity, indicating that the data has indeed achieved stationarity. Stationary data is of paramount importance for various time series analysis methods, simplifying the data and facilitating more accurate modelling and forecasting. These results affirm that differencing or other techniques have effectively eliminated non-stationary components from the ‘d_st’ time series.
The stationarity of the data was tested using the Augmented Dickey-Fuller (ADF) test, and measures such as logarithmic transformation and differencing were applied to stabilise the time series data. Since the data didn’t exhibit any seasonal patterns, it was treated as non-seasonal and made stationary accordingly. In the ACF plot of the ARIMA model, a lag value of 2 was identified as the most suitable choice, indicating the strongest autocorrelation at this lag. This finding is pivotal for determining the order of the AR component in the model (Figure 3).
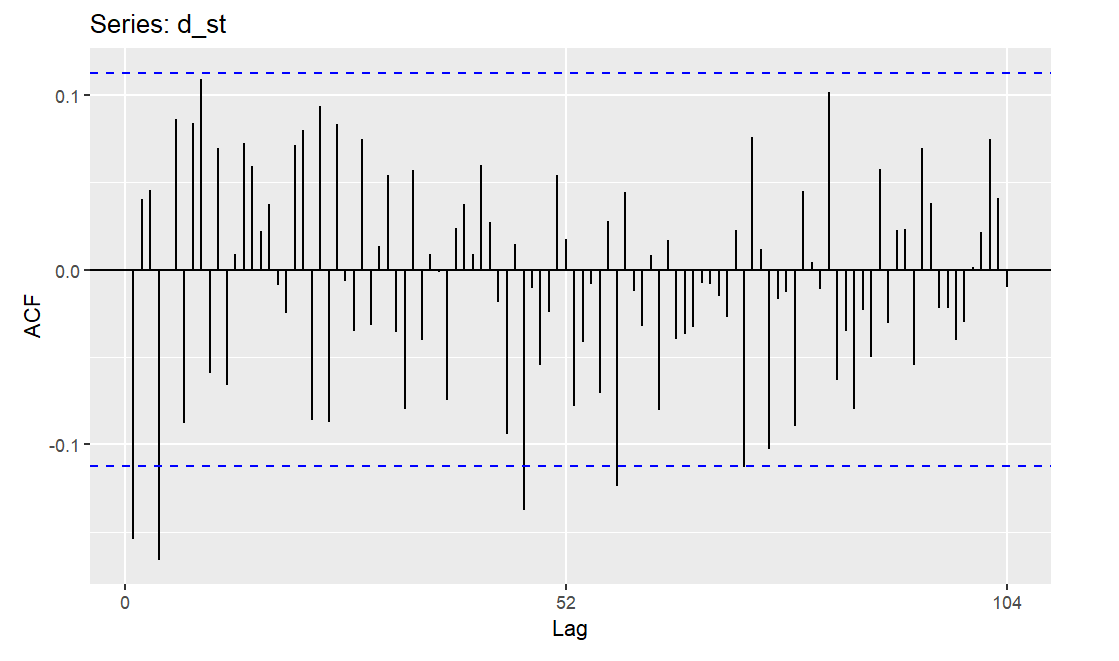
Figure 3. ACF Plot.
In the PACF plot of the ARIMA model, a lag value of 2 emerged as the most appropriate choice, signifying the highest partial autocorrelation at this particular lag. This observation plays a crucial role in establishing the order of the AutoRegressive (AR) component within the ARIMA model. Identifying the optimal value for ‘p’ in the model’s (p,d,q) parameters is essential for capturing the unidirectional influence of past observations on future data points, ensuring an accurate representation of the time series dynamics (Figure 4).
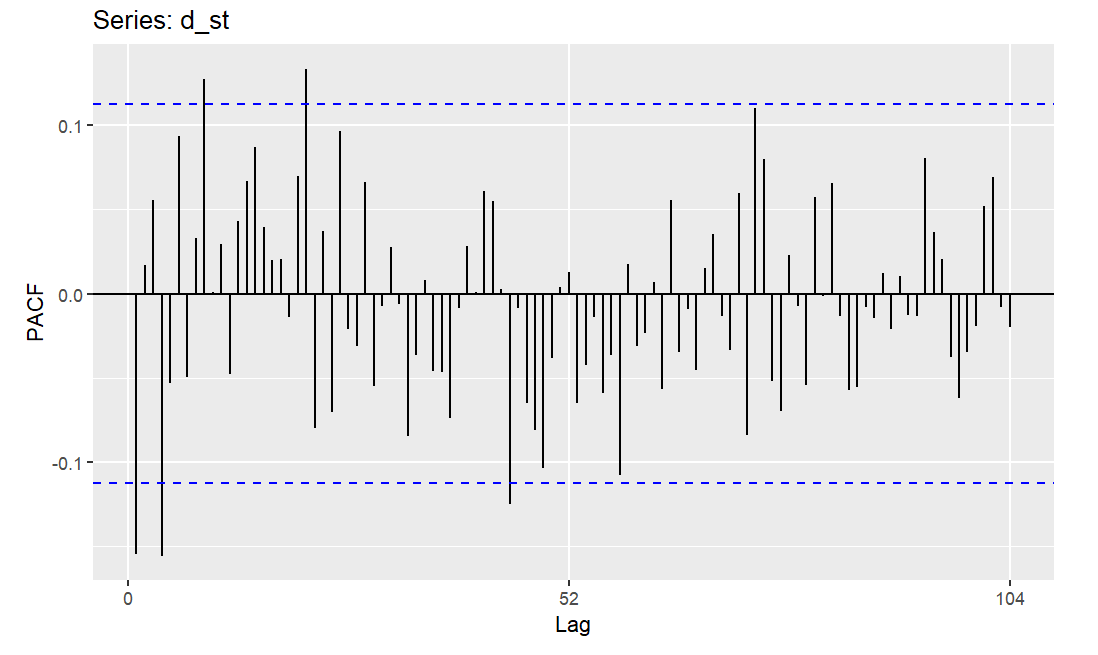
Figure 4. PACF Plot.
Drawing from an analysis of Google’s stock price data spanning from 2018 to October 2023, an ARIMA(2,1,2) model was employed to project future prices, further validating the model’s reliability. The forecasted plot reveals an overall upward trajectory in the stock data. Notably, the actual prices align with the forecasted confidence interval, demonstrated by the match between the closing price on 10/20 and that on 10/16. These findings indicate that the established model boasts a robust fit and can offer accurate predictions for Google’s stock prices, emphasising its credibility in forecasting the future performance of this market (Figure 5).
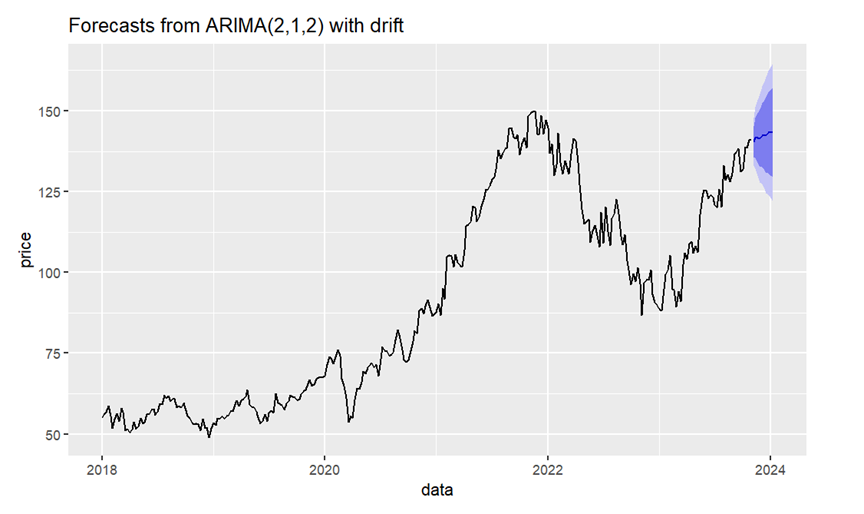
Figure 5. Stock forecasting.
4. Conclusion
In this paper, ARIMA model of time series analysis is used to predict the change of Google stock price, and ARIMA(2,1,2) model is established. Using this model to analyse the Chinese corn market price from 2018 to October 2023, we can predict the change of Chinese stock price. Since the price series in the actual analysis will change with the changes of many factors, this model can predict the changes of stock prices relatively well, and the prices in the series are generally random. When making forecasts using past real price data, there will inevitably be some error. But the overall trend is consistent with real data. While the ARIMA model shows promise, especially when it comes to capturing long-term trends, it may face limitations, such as difficulty capturing non-linear market trends. By understanding the strengths and weaknesses of the ARIMA model and adapting it to specific industries, the ARIMA model can serve as a valuable tool for stock price forecasting. The stock market remains an evolving field where the interplay of technology and finance continues to shape investment opportunities and decisions. As investors and analysts navigate this dynamic arena, they rely on a variety of methods, including the ARIMA model, to uncover valuable insights and make informed choices that contribute to the continued evolution of financial markets and the technology industry.
References
[1]. Staszkiewicz P and Staszkiewicz L 2014 Finance: A Quantitative Introduction. Academic Press.
[2]. Obthong M, et al. 2020 A survey on machine learning for stock price prediction: Algorithms and techniques. Proceedings of the 2nd International Conference on Finance, Economics, Management and IT Business, 63–71.
[3]. Shah J, et al. 2022 A comprehensive review on multiple hybrid deep learning approaches for stock prediction. Intelligent Systems with Applications, 16.
[4]. Selvin S, Vinayakumar R, Gopalakrishnan E, Menon V K and Soman K 2017 Stock price prediction using LSTM, RNN and CNN-sliding window model. In 2017 International Conference on Advances in Computing, Communications and Informatics (ICACCI), 1643–1647.
[5]. Wadia A and Mohd T I S 2011 Selecting Wavelet Transforms Model in Forecasting Financial Time Series Data Based on ARIMA Model. Applied Mathematical Sciences, 5, 315 – 326.
[6]. Medhat W, et al. 2014 Sentiment analysis algorithms and applications: A survey. Ain Shams Engineering Journal, 5, 1093–1113.
[7]. Mondal P, et al. 2014 Study of effectiveness of time series modeling (ARIMA) in forecasting stock prices. International Journal of Computer Science, Engineering and Applications, 13–29.
[8]. Bandyopadhyay G 2016 Gold price forecasting using Arima model. Journal of Advanced Management Science, 117–121.
[9]. Kobiela D, et al. 2022 Arima vs LSTM on NASDAQ Stock Exchange Data. Procedia Computer Science, 207, 3836–3845.
[10]. Zhou L 2021 Application of Arima model on prediction of China’s corn market. Journal of Physics: Conference Series, 12064.
[11]. Debski W 2001 Financial market and its mechanisms: Supplement: stock quotes in the new IT system. PWN.
Cite this article
Zhang,Y. (2024). The comprehensive analysis of Google’s stock using ARIMA model. Theoretical and Natural Science,30,72-77.
Data availability
The datasets used and/or analyzed during the current study will be available from the authors upon reasonable request.
Disclaimer/Publisher's Note
The statements, opinions and data contained in all publications are solely those of the individual author(s) and contributor(s) and not of EWA Publishing and/or the editor(s). EWA Publishing and/or the editor(s) disclaim responsibility for any injury to people or property resulting from any ideas, methods, instructions or products referred to in the content.
About volume
Volume title: Proceedings of the 3rd International Conference on Computing Innovation and Applied Physics
© 2024 by the author(s). Licensee EWA Publishing, Oxford, UK. This article is an open access article distributed under the terms and
conditions of the Creative Commons Attribution (CC BY) license. Authors who
publish this series agree to the following terms:
1. Authors retain copyright and grant the series right of first publication with the work simultaneously licensed under a Creative Commons
Attribution License that allows others to share the work with an acknowledgment of the work's authorship and initial publication in this
series.
2. Authors are able to enter into separate, additional contractual arrangements for the non-exclusive distribution of the series's published
version of the work (e.g., post it to an institutional repository or publish it in a book), with an acknowledgment of its initial
publication in this series.
3. Authors are permitted and encouraged to post their work online (e.g., in institutional repositories or on their website) prior to and
during the submission process, as it can lead to productive exchanges, as well as earlier and greater citation of published work (See
Open access policy for details).
References
[1]. Staszkiewicz P and Staszkiewicz L 2014 Finance: A Quantitative Introduction. Academic Press.
[2]. Obthong M, et al. 2020 A survey on machine learning for stock price prediction: Algorithms and techniques. Proceedings of the 2nd International Conference on Finance, Economics, Management and IT Business, 63–71.
[3]. Shah J, et al. 2022 A comprehensive review on multiple hybrid deep learning approaches for stock prediction. Intelligent Systems with Applications, 16.
[4]. Selvin S, Vinayakumar R, Gopalakrishnan E, Menon V K and Soman K 2017 Stock price prediction using LSTM, RNN and CNN-sliding window model. In 2017 International Conference on Advances in Computing, Communications and Informatics (ICACCI), 1643–1647.
[5]. Wadia A and Mohd T I S 2011 Selecting Wavelet Transforms Model in Forecasting Financial Time Series Data Based on ARIMA Model. Applied Mathematical Sciences, 5, 315 – 326.
[6]. Medhat W, et al. 2014 Sentiment analysis algorithms and applications: A survey. Ain Shams Engineering Journal, 5, 1093–1113.
[7]. Mondal P, et al. 2014 Study of effectiveness of time series modeling (ARIMA) in forecasting stock prices. International Journal of Computer Science, Engineering and Applications, 13–29.
[8]. Bandyopadhyay G 2016 Gold price forecasting using Arima model. Journal of Advanced Management Science, 117–121.
[9]. Kobiela D, et al. 2022 Arima vs LSTM on NASDAQ Stock Exchange Data. Procedia Computer Science, 207, 3836–3845.
[10]. Zhou L 2021 Application of Arima model on prediction of China’s corn market. Journal of Physics: Conference Series, 12064.
[11]. Debski W 2001 Financial market and its mechanisms: Supplement: stock quotes in the new IT system. PWN.