1. Introduction
As the social economy progresses, investing in stocks has grown increasingly prominent. Throughout the practice of stock investment, individuals constantly aspire to obtain the utmost returns and optimize their earnings. Investors aim to predict the forthcoming trends of stock prices, allowing them to prepare ahead of time, stay updated with market prospects, and secure substantial monetary gains with relatively mitigated risk [1]. That’s the reason why forecasting finances is one of the hottest topics these days.
Forecasting the trajectory of the stock market relies significantly on historical sequential data, as suggested by the basic principles governing the equity market [2]. A time series is a sequential dataset which is essentially strings of numerical values arranged chronologically. It records the shifts in the selected values in steady time segments. Time series analysis is the procedure of constructing models utilizing various statistical methods to depict the fundamental attributes of time series data. The significance of this task is undeniable given it enables the assessment of historical trend data, subsequently facilitating the forecasting of potential future patterns [3].
In recent years, machine learning has found extensive application in the research of stock forecasting, and has achieved good forecasting results. The mathematical tools introduced in stock research can be used to optimize data continuously through machine learning, improve the model, and improve the precision of forecasting stock prices, so as to achieve the purpose of successfully predicting the fluctuations in stock prices [4]. Through the modeling of stock data, machine learning deeply analyzes the intrinsic characteristics and laws of stocks, and improves the prediction effect of stocks.
This paper mainly uses two models to regress and predict the stock price. The Linear Regression Model primarily examines inter-variable relationships by employing line-fitting methods over all data points, aiming to lessen the variance between the line and each data point. This model manipulates the observed data to formulate a mathematical model representation, discovering patterns between independent and dependent variables, thereby facilitating the prediction of outcomes for unidentified data. The Random Forest Model consists of several decision trees, with each one being trained on a distinct data subset. When establishing the final output, the model amalgamates numerous decision trees, hence the output is influenced by multiple decision trees rather than just one. When dealing with regression problems, the ultimate output is determined as the average of all outputs generated by the decision trees involved.
2. Literature review
It is undoubted that Apple Inc. is recently one of the richest and most renowned companies in the world, whose stock market has been widely observed by using several models or methods. In the fourth month of 2013, the corporation committed to delivering $100 billion back to its shareholders by the closure of 2015, via equity repurchases and monetary dividends [5].
A broad spectrum of methodologies has been employed in the forecasting of stock prices. According to the study about the stock values by Tripathy and Jaipuria, the stock market has been recently anticipated by a large number of research to some degree, using both simple and complex models [6]. To be specific, Long relied exclusively on historical stock prices to forecast future values, while Singh used several technical indicators to augment the historical data [7]. Besides, various methods, such as Random Forest, Naïve Bayes, Decision Trees, and Support Vector Machines, are used to evaluate the accuracy of classifying stock market fluctuations [8]. Also, Bharadwaj articulated the importance of sentiment analysis to obtain an exact forecast of stock price [9].
3. Data Description
3.1. Descriptive Statistical Analysis
The data used for the empirical analysis in this paper is the price data of AAPL from January 2, 2018, to September 14, 2023, which includes the opening price, high price, low price, closing price, adjusted closing price, and volume indicator, totaling 1,435 pieces of data. Table 1 presents the descriptive statistical analysis of this dataset.
Table 1. Descriptive statistical analysis of data
Open | High | Low | Close | Adj Close | Volume | |
count | 1435 | 1435 | 1435 | 1435 | 1435 | 1435 |
mean | 106.5898 | 107.8351 | 105.4243 | 106.681 | 105.1585 | 110055400 |
std | 49.45928 | 50.00427 | 48.93159 | 49.48803 | 49.83856 | 55071980 |
min | 35.995 | 36.43 | 35.5 | 35.5475 | 34.16382 | 31458200 |
25% | 52.5975 | 53.26 | 52.09625 | 52.57375 | 50.81895 | 74167600 |
50% | 119.55 | 120.99 | 118 | 119.39 | 117.4726 | 95467100 |
75% | 148.98 | 150.69 | 147.68 | 149.29 | 148.0364 | 130206800 |
max | 196.24 | 198.23 | 195.28 | 196.45 | 196.1851 | 426510000 |
It is obvious from Table 1, after checking this dataset, all the labels have 1435 pieces of data, which means there are no missing values. The mean represents the central trend indicator, and it can be seen from the table that the Apple stock price is around 106. The standard deviation is around 50, stand for the discrete trend fluctuation. The maximum and minimum values combined with the quartile can illustrate that the data of open, high, low, and closing price are all right skewed. This means that the data is concentrated on smaller numbers, and the tail extends to larger numbers. The right skewed distribution is characterized by a dense right side and sparse left side.
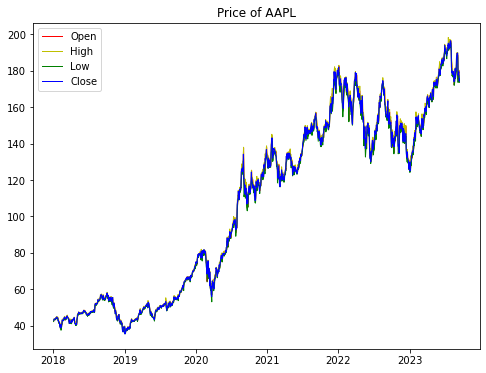
Figure 1 illustrates line graphs of the opening, high, low, and closing price data.

Figure 1. AAPL Price Chart
As shown in Figure 1, the Apple stock price increased with fluctuation during the past 5 years. To be specific, the stock price has grown faster since 2020, due to the reason of the 5G era. The advancement of related technologies around the world has made the stock price of Apple Inc., as a technology sector, rise rapidly. The stock price stayed relatively high through 2022-2023, because of the epidemic, the demand for electronic products had increased, while the demand for network services had also increased, and this network service business is precisely the focus of Apple’s development.
3.2. Constructing the Dataset
In this paper, the Open, High, Low, Close, and Volume of AAPL on the current day are used as independent variables (X) and the Close of AAPL on the next day is used as the dependent variable (Y), and the Open, High, Low, Close, and Volume of the current day are used to predict the next day’s closing price.
After the data construction is completed, this paper divides the dataset into training and validation sets according to 8:2. The training set data is used to train the model by inputting X and Y values and fitting them using the model respectively. After the model is trained, X from the validation set is input into the model to get the predicted Y value, which is compared with the true Y value to verify the accuracy of the model.
4. Methods
4.1. Linear Regression Model
Linear regression mainly studies the relationship between variables, using lines to fit all the data points, and then investigating how to minimize the difference in distance between the lines and all the data points. Linear regression processes the observed data to obtain a mathematical model expression and to find the law between the independent variable data and the dependent variable data, so as to predict the results of unknown data.
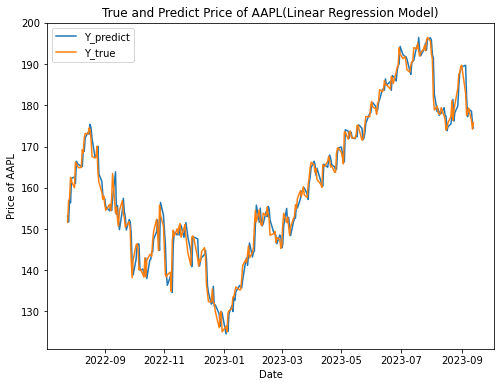
In this paper, a Linear Regression Model was used to fit and predict the dataset, and the results of the stock price prediction are shown in Figure 2.

Figure 2. True and Predict Price of AAPL (Linear Regression Model)
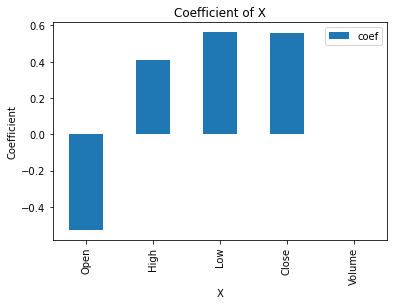
As the results in Figure 2, Linear Regression Model has a good predictive performance on this dataset, and the predicted results are basically consistent with the trend of the true values. In order to explore the contribution of the respective variables in the model fitting, the coefficients of each feature in the model are calculated in this paper, as shown in Figure 3.

Figure 3. Coefficient of X
It is obvious from Figure 3 that Open, High, Low, and Close coefficients are large and have a significant effect on the model, with calculated coefficient values of -0.5268, 0.4092, 0.5630, and 0.5566, respectively, whereas the coefficient value of Volume is close to 0 and contributes almost nothing to the model.
4.2. Random Forest Model
The random forest model is an ensemble learning algorithm composed of multiple decision trees. Each decision tree is trained on a subset of the data to increase the diversity of the model by a random selection of different samples and features. At the final output, the random forest will combine the predicted results of all the decision trees to get the final results. Compared with a single decision tree, the random forest is better able to cope with the overfitting problem, and has high accuracy and stability. Because each decision tree only sees part of the data and features, it is independent of each other and operates in parallel during the training process, thus reducing the variance of the model [10].
The random forest model is working as follows: First, N sample subsets are randomly selected from the data set, and these subsets are used to build a decision tree. Then, determine the number of trees to be used, and repeat the steps described above. In the regression problem, each tree will predict the Y value, and at the final output, the final result is obtained by calculating the average of the predicted values of all the decision trees.
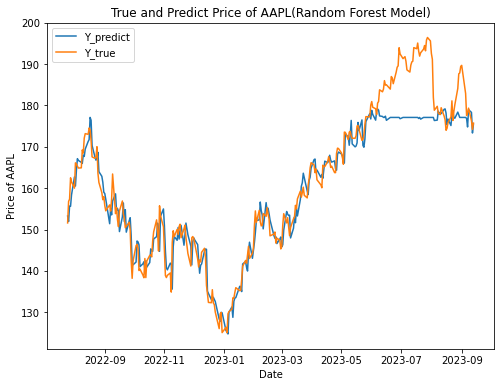
In this paper, a random forest model was used to fit and predict the dataset, and the prediction outcomes are illustrated in Figure 4.

Figure 4. True and Predict Price of AAPL (Random Forest Model)
As can be seen from Figure 4, before June 2023, the Random Forest Model has a better prediction performance on this dataset, and the results of the predictions are basically consistent with the trend of the real value, but after June, the real stock price data has a large fluctuation, but the predicted trend of Random Forest Model is basically flat, which may be related to the characteristics of the model.
5. Discussion
In order to compare and analyze the prediction results more specifically, this paper uses MSE, RMSE, and MAE indicators to evaluate the prediction results of the two models.
5.1. Indicators Description
Mean Absolute Error (MAE) is a metric utilized for assessing the performance of a regression model. It quantifies the mean magnitude of inaccuracies within a cluster of forecasts. It signifies the mean absolute deviation between the anticipated and realized values.
Mean Squared Error (MSE) is a metric employed to evaluate the performance of a regression model. It is computed by taking the average of the squared differences between the predicted and observed values. Lower MSE values indicate better model performance and a stronger correlation between predicted and actual data.
Root Mean Squared Error (RMSE) measures the accuracy of a model’s predictions. It represents the average difference between the observed values and the predicted values by the model.
5.2. Evaluation of the Prediction Results
The values of each indicator are presented in Table 2.
Table 2. Evaluation indexes of each model
Linear Regression Model | Random Forest Model | |
MAE | 2.0988 | 3.9967 |
MSE | 7.9001 | 34.2865 |
RMSE | 2.8017 | 5.8554 |
From the comparisons in the Table 2, it shows that the values of the three evaluation indexes of Linear Regression Model are smaller than those of the Random Forest Model, which indicates that Linear Regression Model outperforms Random Forest Model in the three evaluation indexes, and therefore, from an overall point of view, Linear Regression Model has a better prediction performance.
6. Conclusion
Based on the analysis conducted above, it can be concluded that the Linear Regression Model is more accurate than the Random Forest Model in the regression and prediction of stock price data by comparing the three indices: MSE, RMSE, and MAE.
In the analysis using the Linear Regression Model, the correlation analysis illustrated that the opening price exhibits a negative correlation with the dependent variable: the closing price, the highest and lowest price have a positive correlation with the closing price, and the trading volume is irrelevant and contributes almost nothing to the model.
As for the random forest model, its accuracy is relatively weak. The reason is that the number of the training set data is limited, so the value predicted by the model will not exceed the highest value observed in the training set of the input model for the prediction of the stock price future trend. Therefore, the prediction is not accurate. If the range of training set data can be expanded, the predictive accuracy of the model will be further improved.
References
[1]. Shivakoti, M. Jeeveth, K. Pradhan, N. R. Yesu Babu, M. 2023, Apple Stock Price Prediction Using Regression Techniques. (In International Conference on Intelligent Computing and Networking), pp. 59-75.
[2]. Ashfaq, N. Nawaz, Z. Ilyas, M. 2021. A comparative study of different machine learning regressors for stock market prediction. (arXiv preprint arXiv:2104.07469).
[3]. Song, D. Baek, A. M. C. Kim, N. 2021, Forecasting stock market indices using padding-based fourier transform denoising and time series deep learning models. (IEEE Access, vol. 9), pp. 83786-83796.
[4]. Singh, R. Srivastava, S. 2017, Stock prediction using deep learning. (Multimedia Tools and Applications, vol. 76), pp. 18569-18584.
[5]. Lazonick, W. Mazzucato, M. Tulum, Ö. 2013, Apple’s changing business model: What should the world’s richest company do with all those profits. (In Accounting Forum, vol. 37), no. 4, pp. 249-267.
[6]. Tripathy, N. Jaipuria, S. 2020, Forecasting stock market using discrete wavelet transforms and artificial neural networks model. (The Empirical Economics Letters, vol. 19), no. 11, pp. 1263-1277.
[7]. Long, W. Lu, Z. Cui, L. 2019, Deep learning-based feature engineering for stock price movement prediction. (Knowledge-Based Systems, vol. 164), pp. 163-173.
[8]. Gondaliya, C. Patel, A. Shah, T. 2021, Sentiment analysis and prediction of Indian stock market amid Covid-19 pandemic. (In IOP Conference Series: Materials Science and Engineering, vol. 1020), no. 1, pp. 012023.
[9]. Bhardwaj, A. Narayan, Y. Dutta, M. 2015, Sentiment analysis for Indian stock market prediction using Sensex and Nifty. (Procedia computer science, vol. 70), pp. 85-91.
[10]. Abraham, R. Samad, M. E. Bakhach, A. M. El-Chaarani, H. Sardouk, A. Nemar, S. E. Jaber, D. 2022, Forecasting a stock trend using genetic algorithm and random forest. (Journal of Risk and Financial Management, vol. 15), no. 5, pp. 188.
Cite this article
Gao,Y. (2024). The prediction of Apple stock price based on linear regression model and random forest model. Theoretical and Natural Science,30,103-109.
Data availability
The datasets used and/or analyzed during the current study will be available from the authors upon reasonable request.
Disclaimer/Publisher's Note
The statements, opinions and data contained in all publications are solely those of the individual author(s) and contributor(s) and not of EWA Publishing and/or the editor(s). EWA Publishing and/or the editor(s) disclaim responsibility for any injury to people or property resulting from any ideas, methods, instructions or products referred to in the content.
About volume
Volume title: Proceedings of the 3rd International Conference on Computing Innovation and Applied Physics
© 2024 by the author(s). Licensee EWA Publishing, Oxford, UK. This article is an open access article distributed under the terms and
conditions of the Creative Commons Attribution (CC BY) license. Authors who
publish this series agree to the following terms:
1. Authors retain copyright and grant the series right of first publication with the work simultaneously licensed under a Creative Commons
Attribution License that allows others to share the work with an acknowledgment of the work's authorship and initial publication in this
series.
2. Authors are able to enter into separate, additional contractual arrangements for the non-exclusive distribution of the series's published
version of the work (e.g., post it to an institutional repository or publish it in a book), with an acknowledgment of its initial
publication in this series.
3. Authors are permitted and encouraged to post their work online (e.g., in institutional repositories or on their website) prior to and
during the submission process, as it can lead to productive exchanges, as well as earlier and greater citation of published work (See
Open access policy for details).
References
[1]. Shivakoti, M. Jeeveth, K. Pradhan, N. R. Yesu Babu, M. 2023, Apple Stock Price Prediction Using Regression Techniques. (In International Conference on Intelligent Computing and Networking), pp. 59-75.
[2]. Ashfaq, N. Nawaz, Z. Ilyas, M. 2021. A comparative study of different machine learning regressors for stock market prediction. (arXiv preprint arXiv:2104.07469).
[3]. Song, D. Baek, A. M. C. Kim, N. 2021, Forecasting stock market indices using padding-based fourier transform denoising and time series deep learning models. (IEEE Access, vol. 9), pp. 83786-83796.
[4]. Singh, R. Srivastava, S. 2017, Stock prediction using deep learning. (Multimedia Tools and Applications, vol. 76), pp. 18569-18584.
[5]. Lazonick, W. Mazzucato, M. Tulum, Ö. 2013, Apple’s changing business model: What should the world’s richest company do with all those profits. (In Accounting Forum, vol. 37), no. 4, pp. 249-267.
[6]. Tripathy, N. Jaipuria, S. 2020, Forecasting stock market using discrete wavelet transforms and artificial neural networks model. (The Empirical Economics Letters, vol. 19), no. 11, pp. 1263-1277.
[7]. Long, W. Lu, Z. Cui, L. 2019, Deep learning-based feature engineering for stock price movement prediction. (Knowledge-Based Systems, vol. 164), pp. 163-173.
[8]. Gondaliya, C. Patel, A. Shah, T. 2021, Sentiment analysis and prediction of Indian stock market amid Covid-19 pandemic. (In IOP Conference Series: Materials Science and Engineering, vol. 1020), no. 1, pp. 012023.
[9]. Bhardwaj, A. Narayan, Y. Dutta, M. 2015, Sentiment analysis for Indian stock market prediction using Sensex and Nifty. (Procedia computer science, vol. 70), pp. 85-91.
[10]. Abraham, R. Samad, M. E. Bakhach, A. M. El-Chaarani, H. Sardouk, A. Nemar, S. E. Jaber, D. 2022, Forecasting a stock trend using genetic algorithm and random forest. (Journal of Risk and Financial Management, vol. 15), no. 5, pp. 188.


