


1. Introduction
SPX options, or S&P 500 Index options, are European-style options based on the S&P 500 Index, widely used for risk management and speculation. Their importance in financial markets lies in providing hedging tools and measuring market volatility expectations [1]. Volatility arbitrage profits by exploiting the differences between historical volatility and implied volatility [2]. This strategy is widely applied in options markets due to the high sensitivity of option prices to volatility. By buying or selling options with relatively overestimated or underestimated volatility, investors can achieve profits when volatility reverts to its mean.
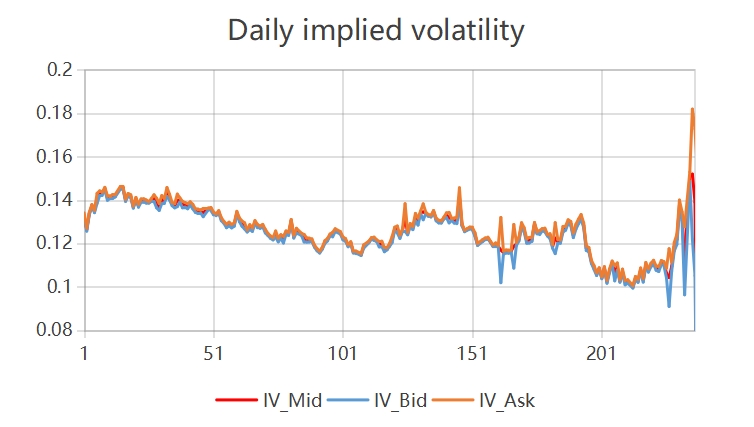
The objective of this study is to evaluate the effectiveness of volatility arbitrage strategies in the SPX options market by calculating the relative differences between daily historical volatility and the daily implied volatility of call option prices. Specifically, this study derives the daily relative difference from the daily historical and implied volatilities, then applies the corresponding option volatility arbitrage strategy based on this relative difference. One computes the final profit over the period from February 1, 2023, to January 18, 2024, to validate the feasibility and performance of the strategy. Despite extensive research on the relationship between historical volatility and implied volatility, there is limited work on systematically utilizing this relative difference for volatility arbitrage [3]. Moreover, most studies focus on static models and theoretical analysis, lacking empirical validation with real market data. This study aims to fill this gap by applying the relative difference indicator in an empirical analysis to evaluate the effectiveness of volatility arbitrage strategies under actual market conditions. The remaining portion of the paper is organized as follows: Section 2 presents the data, models, and results analysis. Section 3 discusses some limitations. Section 4 concludes the study.
2. Model Formulation
2.1. Application of 66 Trailing Days in Calculating Daily Historical Return
This study employs a volatility arbitrage trading strategy by calculating the daily historical volatility of the underlying mid price (the average price of the bid and ask prices) over a 66-trailing-day window, which corresponds to approximately three months. This period is selected to align with the 5-workday week convention commonly used in financial markets. The daily historical volatility, denoted as \( {σ_{h}}(t) \) , is computed without including the current day's data to avoid bias from future information that would not be available in real-time trading decisions. This methodology ensures that only past data is utilized, maintaining the integrity of the trading strategy by preventing the incorporation of yet-to-be-known market movements. The formula for calculating daily historical volatility is as follows:
\( {σ_{h}}(t)=\sqrt[]{\frac{1}{66}\sum _{i=t-67}^{i=t-1}({R_{i}}-\bar{R})}\ \ \ (1) \)
Here, \( {σ_{h}}(t) \) denotes the daily historical return of the day \( t \) , \( {R_{i}} \) denotes the return of the \( i \) th day, \( \bar{R} \) denotes the arithmetic average return for the 66 days preceding day \( t \) . Due to the inability to calculate the daily historical volatility for the first 67 days using a 66-day trailing window, this study reduced the trailing days from 66 to 2 to compute the daily historical volatility for days 4 through 67. The daily historical volatility can only be calculated starting from day 4 because the log return for the first day cannot be computed, and the volatility for day 4 requires the log returns from days 2 and 3. Although this approach may introduce some error, it allows for the necessary calculations.
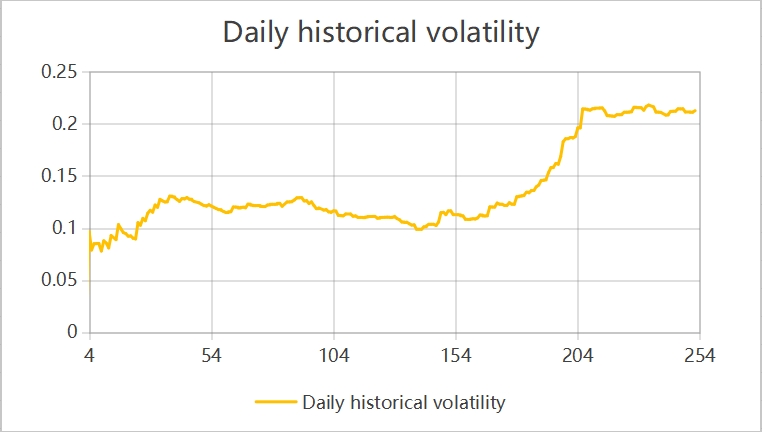
Figure 1: Daily historical return (Photo/Picture credit: Original).
Fig. 1 illustrates the trend of daily historical volatility from Day 4 to Day 254. It is evident that from Day 4 to Day 154, the daily historical volatility remained relatively low and stable. However, starting around Day 200, there was a significant increase in historical volatility, indicating heightened market fluctuations. Overall, this rise in volatility suggests that the market became increasingly unstable in the later period.
2.2. Determination the Theoretical Value Based on Black-Scholes-Merton Model
The Black-Scholes-Merton (BSM) model, developed by Fischer Black, Myron Scholes, and Robert Merton in 1973, is one of the most widely used models for pricing European-style options [4]. The BSM model assumes that the underlying asset prices follow a geometric Brownian motion, the market is frictionless with continuous trading, volatility remains constant, and there are no arbitrage opportunities [5]. While these assumptions provide theoretical elegance and simplicity to the model, they may not hold true in real-world markets. The model provides a theoretical estimate of the price of a call or put option. The formulas for BSM model are as follows:
\( C={S_{0}}N({d_{1}})-K{e^{-rT}}N({d_{2}})\ \ \ (2) \)
\( {d_{1}}=\frac{ln{(\frac{{S_{0}}}{K})+(r+\frac{{σ^{2}}}{2})T}}{σ\sqrt[]{T}}\ \ \ (3) \)
\( {d_{2}}={d_{1}}-σ\sqrt[]{T}\ \ \ (4) \)

References
[1]. Hazen, T. L. (1987) Volatility and market inefficiency: a commentary on the effects of options, futures, and risk arbitrage on the stock market. Wash. & Lee Review, 44, 789.
[2]. Loggie, K. (2008) Volatility Arbitrage Indices-A Primer. Available at SSRN 1321707.
[3]. Ammann, M., Herriger, S. (2002) Relative implied-volatility arbitrage with index options. Financial Analysts Journal, 58(6), 42-55.
[4]. Morales-Bañuelos, P., Muriel, N., Fernández-Anaya, G. (2022) A modified Black-Scholes-Merton model for option pricing. Mathematics, 10(9), 1492.
[5]. Onan, M., Salih, A., Yasar, B. (2014) Impact of macroeconomic announcements on implied volatility slope of SPX options and VIX. Finance Research Letters, 11(4), 454-462.
[6]. Li, M. (2006) You Don't Have to Bother Newton for Implied Volatility. Available at SSRN 952727.
[7]. Yen, J., Chen, B., Wu, K.Z., et al. (2021) Fast generation of implied volatility surface: optimize the traditional numerical analysis and machine learning. International Journal of Financial Engineering, 8(02)m 2150037.
[8]. Zulfiqar, N., Gulzar, S. (2021) Implied volatility estimation of bitcoin options and the stylized facts of option pricing[J]. Financial Innovation, 7(1), 67.
[9]. Shu, J., Zhang, J. E. (2011) The relation between implied and realized volatility of S&P 500 index. Wilmott magazine, 11, 83-91.
[10]. Cambone, E. (2016) Merits and Shortcomings of the Black-Scholes-Merton (BSM) Approach: An analysis of the role of volatility. Essex Student Journal, 8(1).
Cite this article
Lyu,Y. (2024). Empirical Analysis of SPX Options Volatility Arbitrage Strategies: Relative Differences in Historical and Implied Volatility. Advances in Economics, Management and Political Sciences,134,88-93.
Data availability
The datasets used and/or analyzed during the current study will be available from the authors upon reasonable request.
Disclaimer/Publisher's Note
The statements, opinions and data contained in all publications are solely those of the individual author(s) and contributor(s) and not of EWA Publishing and/or the editor(s). EWA Publishing and/or the editor(s) disclaim responsibility for any injury to people or property resulting from any ideas, methods, instructions or products referred to in the content.
About volume
Volume title: Proceedings of the 3rd International Conference on Financial Technology and Business Analysis
© 2024 by the author(s). Licensee EWA Publishing, Oxford, UK. This article is an open access article distributed under the terms and
conditions of the Creative Commons Attribution (CC BY) license. Authors who
publish this series agree to the following terms:
1. Authors retain copyright and grant the series right of first publication with the work simultaneously licensed under a Creative Commons
Attribution License that allows others to share the work with an acknowledgment of the work's authorship and initial publication in this
series.
2. Authors are able to enter into separate, additional contractual arrangements for the non-exclusive distribution of the series's published
version of the work (e.g., post it to an institutional repository or publish it in a book), with an acknowledgment of its initial
publication in this series.
3. Authors are permitted and encouraged to post their work online (e.g., in institutional repositories or on their website) prior to and
during the submission process, as it can lead to productive exchanges, as well as earlier and greater citation of published work (See
Open access policy for details).
References
[1]. Hazen, T. L. (1987) Volatility and market inefficiency: a commentary on the effects of options, futures, and risk arbitrage on the stock market. Wash. & Lee Review, 44, 789.
[2]. Loggie, K. (2008) Volatility Arbitrage Indices-A Primer. Available at SSRN 1321707.
[3]. Ammann, M., Herriger, S. (2002) Relative implied-volatility arbitrage with index options. Financial Analysts Journal, 58(6), 42-55.
[4]. Morales-Bañuelos, P., Muriel, N., Fernández-Anaya, G. (2022) A modified Black-Scholes-Merton model for option pricing. Mathematics, 10(9), 1492.
[5]. Onan, M., Salih, A., Yasar, B. (2014) Impact of macroeconomic announcements on implied volatility slope of SPX options and VIX. Finance Research Letters, 11(4), 454-462.
[6]. Li, M. (2006) You Don't Have to Bother Newton for Implied Volatility. Available at SSRN 952727.
[7]. Yen, J., Chen, B., Wu, K.Z., et al. (2021) Fast generation of implied volatility surface: optimize the traditional numerical analysis and machine learning. International Journal of Financial Engineering, 8(02)m 2150037.
[8]. Zulfiqar, N., Gulzar, S. (2021) Implied volatility estimation of bitcoin options and the stylized facts of option pricing[J]. Financial Innovation, 7(1), 67.
[9]. Shu, J., Zhang, J. E. (2011) The relation between implied and realized volatility of S&P 500 index. Wilmott magazine, 11, 83-91.
[10]. Cambone, E. (2016) Merits and Shortcomings of the Black-Scholes-Merton (BSM) Approach: An analysis of the role of volatility. Essex Student Journal, 8(1).
Cookies are used by this site.
Copyright © 2024 EWA Publishing, its licensors, and contributors. All rights reserved, including text and data mining, AI training, and similar technologies.