


1. Introduction
In today's globalized and digitized economic environment, the financial market, as an important place for resource allocation, has always been the focus of attention of both academia and the industry in terms of its volatility and trend prediction [1]. With the rapid development of big data and artificial intelligence technology, financial time series analysis has become increasingly important as a key tool for predicting market behavior and assessing investment risks [2]. Among them, ARIMA, as one of the classic methods of time series forecasting, has occupied a pivotal position in the field of financial forecasting by virtue of its powerful data processing capability and forecasting accuracy [3].
NVIDIA, as the world's leading graphics processing unit (GPU) manufacturer, has a pivotal position in artificial intelligence, deep learning, high-performance computing and other fields [4]. Its stock price performance often reflects the market's expectations of future technology trends and investor confidence [5-6]. Accurately predicting the closing price of NVIDIA's stock is not only important for investors to formulate investment strategies and manage their portfolios, but also provides a powerful support for studying the market dynamics of the technology industry and evaluating the value of companies [7]. Therefore, this report aims to explore the application of the ARIMA model in forecasting the closing price of NVIDIA, an important technology stock in the US stock market [8].
Using the historical closing price data of NVIDIA Corporation, the ARIMA model is used to make predictions and test the accuracy of the model in short-term price prediction, so as to achieve the research objective of assessing its future price movements. The significance of this study is to provide investors with a more scientific basis for decision-making and to enhance their risk management ability in the fast-changing technology stock market.
2. Methodology
2.1. Data Source
The data source is Yahoo Finance (https://finance.yahoo.com/) and covers monthly data from July 2014 through July 2024. Specifically, this study uses the average of NVIDIA's monthly closing prices to minimize the impact of day-to-day volatility and improve forecast stability. With this approach, the model is able to capture long-term trends and cyclical variations in stock prices.
2.2. Descriptive Statistics
2.2.1. Data Characterization
NVIDIA's monthly data from July 2014 through July 2024 were summarized as follow(Table 1). Table 1shows stock price and adjusted stock price have significant positive skewness and high volatility, while exhibiting distributional characteristics with sharp peaks and thick tails, which may imply the presence of some extreme price volatility situations. Trading volume also shows some volatility, but the distribution is less skewed and more kurtosis relative to the stock price, suggesting that trading volume has been relatively stable over the period, although there have been some instances of unusually high trading volume.
Table 1: NVIDIA's monthly data (July 2014 - July 2024).
CLOSE | ADJ_CLOSE | VOLUME | |
Mean | 14.73185 | 14.70279 | 9.75E+09 |
Median | 5.910750 | 5.866656 | 9.47E+09 |
Maximum | 123.5400 | 123.5299 | 2.34E+10 |
Minimum | 0.437500 | 0.416473 | 4.14E+09 |
Std. Dev | 21.78586 | 21.79102 | 3.41E+09 |
Skewness | 2.778598 | 2.778689 | 0.877967 |
Kurtosis | 11.60841 | 11.60747 | 4.298693 |
Jarque-Bera | 529.3099 | 529.2389 | 24.04830 |
Probability | 0.000000 | 0.000000 | 0.000000 |
Sum | 1782.554 | 1770.038 | 1.18E+12 |
Sum Sq. Dev. | 56954.82 | 56981.84 | 1.40E+21 |
Observations | 121 | 121 | 121 |
2.2.2. Time Series Diagram
From Figure 1(Generated by Eviews Time Series chart), NVIDIA's closing price appears to have a general upward trend over the period, suggesting that the company's value may have increased overall over the period. In terms of volatility, the stock price shows significant volatility with multiple highs and lows, suggesting that the stock has experienced varying degrees of volatility over time. In terms of seasonality, although the figure1 does not explicitly show a cyclical pattern, the volatility of the stock price may suggest certain cyclical factors, such as seasonal economic activity or industry-specific cyclical influences. In terms of stationarity, the stock price time series may not be stable in terms of volatility and trend as it shows non-constant mean and variance, which is a problem for using the ARIMA model, which requires the time series to be stable.
In summary the figure 1 shows that the monthly closing price of NVIDIA is unstable, so the data needs to be preprocessed, which can be done by processing the data through first-order difference.
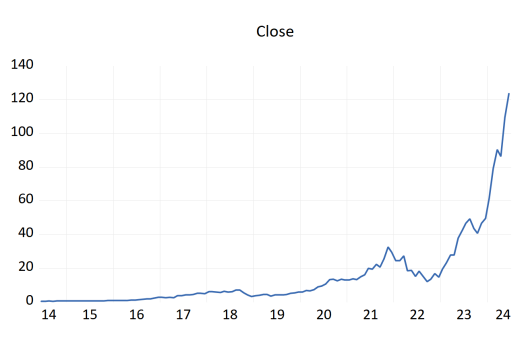
Figure 1: Time Series Diagram.
2.3. First-Order Difference
First-Order Difference:
\( ∆{Y_{t}}={Y_{t}}-{Y_{t-1}} \) (1)
Where,
\( {Y_{t}} \) is the closing price of NVIDIA at time t,
\( {Y_{t}} \) is the closing price of NVIDIA at time t-1,
\( ∆{Y_{t}} \) denotes the time the first-order differential at time t.
After the first-order difference, it is observed that the volatility of the data is reduced(Figure 2 ), but there is still a clear upward or downward trend. Therefore, it is necessary to do the second-order difference, after the second-order difference(Figure 3), there is no obvious upward trend in the data, and there is a convergence of the characteristics, so it is considered that the second-order difference after the NVIDIA stock price has been stable.
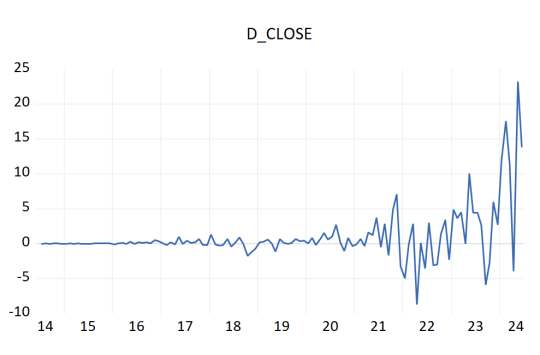
Figure 2: first-order difference.
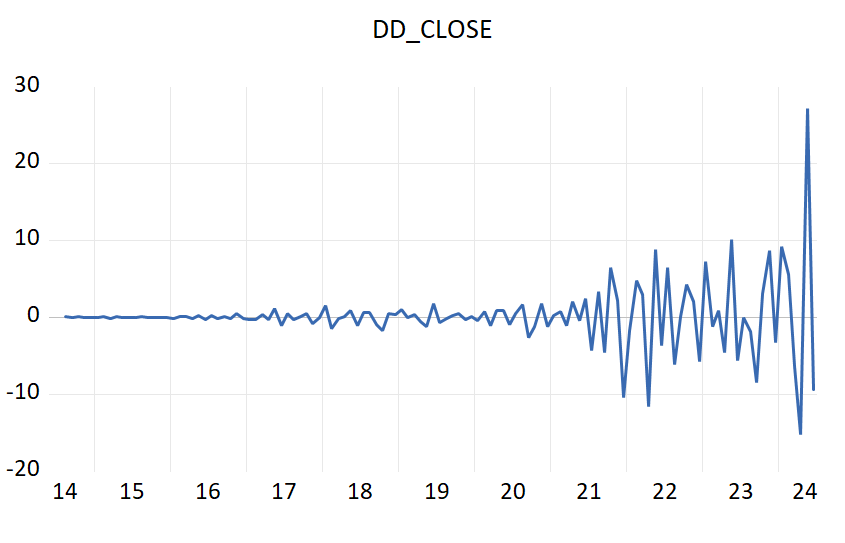
Figure 3: the second-order difference.
In order to ensure the validity of the results, data is done the ADF test (Figure 4). The test result showed that the test statistic is -7.163. Since this value is much smaller than the common critical value (the critical value at the 1% level is -2.58), this suggests that it is enough evidence to reject the original hypothesis. The original hypothesis is that the time series has a unit root, i.e. it is non-stationary. Since the ADF test statistic is much smaller than the critical value. In addition, the p-value is very small (2.091), much less than 0.05, which further supports our conclusion to reject the original hypothesis. And the output concluded that the series (DD_CLOSE) after second order differencing is smooth and can be used for further ARIMA model or other time series analysis.
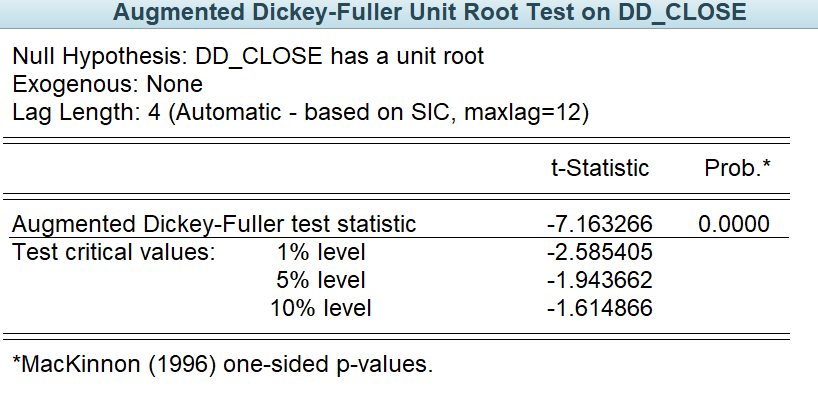
Figure 4: the ADF test.
2.4. Model
2.4.1. Determine the Lag Order
In the autoregressive part, the number of lags of the first significant partial autocorrelation coefficient (PAC) is usually chosen as the order of the AR part. As it can be seen from the figure 5, the PAC is significant at lag 1 and lag 2, so AR(2) can be considered. In the difference Part, since the second order difference (D(CLOSE,2)) is performed, this means that the data has been processed through difference twice to achieve smoothness. Therefore, the order of the I part is 2.
In moving average part, the lag of the last significant autocorrelation coefficient is usually chosen as the order of the MA part. From the figure 4, it can be seen that AC is significant at lag 1 and lag 2, so MA(2) can be considered.
In summary, ARIMA(2,2,2) will be chosen as the prediction model in this paper, However, suitable models also need to be compared by comparing the AIC and BIC values of each model.
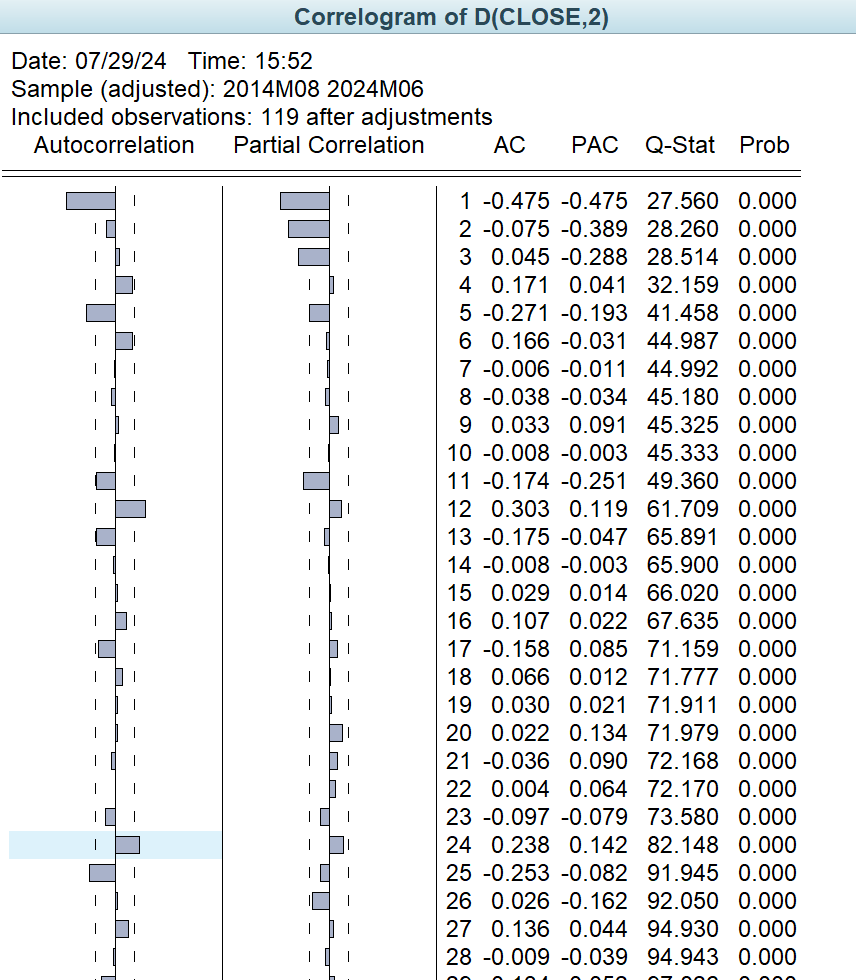
Figure 5: Correlogram of D(CLOSE,2).
2.4.2. Model Selection
Based on the Table 2, Model6 ARIMA(2,2,1)) and model3 ARIMA(0,2,1) had the lowest AIC value, indicating the best fit to the data of all the models while maintaining model simplicity. Since the model has low AIC and BIC values[9], this means that the model has better performance in fitting the data while penalizing the model complexity. In addition, Model 6 has a moderate amount of autoregressive and moving average terms, which helps capture the dynamic nature of the data while avoiding overfitting. In summary, Model 3 and Model 6 will be selected for predicting the closing price of NVIDIA in this paper.
Table 2: AIC and BIC criteria
Model | AIC | BIC | |
Model1 | ARIMA(1,2,0) | 5.562 | 5.632 |
Model2 | ARIMA(2,2,0) | 5.398 | 5.592 |
Model3 | ARIMA(0,2,1) | 5.343 | 5.414 |
Model4 | ARIMA(0,2,2) | 5.359 | 5.452 |
Model5 | ARIMA(1,2,1) | 5.359 | 5.452 |
Model6 | ARIMA(2,2,1) | 5.352 | 5.469 |
Model7 | ARIMA(2,2,2) | 5.369 | 5.509 |
Model Output
2.4.3. Model 6
The equation for model6 is as follows:
\( {∆^{2}}{y_{t}}=0.101388-0.24056{y_{t-1}}-{0.2611y_{t-2}}-0.558364{ϵ_{t-1}}+{ϵ_{t}} \) (2)
Where, \( {∆^{2}}{y_{t}} \) denotes the closing price after second-order differencing at time point t. The next two terms are autoregressive terms corresponding to \( {y_{t-1}} \) \( {y_{t-1}} \) and \( {y_{t-2}} \) \( {y_{t-2}} \) , respectively. This is closely followed by the moving average term, corresponding to \( {ϵ_{t-1}} \) \( {?_{t-1}} \) .
The inverse of the autoregressive roots of the model (Inverted AR Roots) is complex (-0.12 ± 0.50i), indicating that the model may have some oscillatory behavior. The inverse of the moving average roots (Inverted MA Roots) is 0.56 and its absolute value is less than 1, which indicates that the moving average component is stable (Figure 6). Additionally, the Durbin-Watson statistic is 2.009, which is close to 2, indicating that there is no significant autocorrelation between the residuals (Figure 5). From Figure 7, the autocorrelation coefficient and partial autocorrelation coefficient of the model do not show a significant cyclical pattern, which indicates that the model is stable to some extent. The P-value of the Q-statistic of the model at lag 4 is greater than 0.05, which indicates that there is no significant autocorrelation of the residuals of the model, and the model diagnosis results are good. In terms of the Model Predictive Power, the F-statistic value is 19.31 and the P-value is 0, indicating that the model as a whole is statistically significant and has some predictive power.
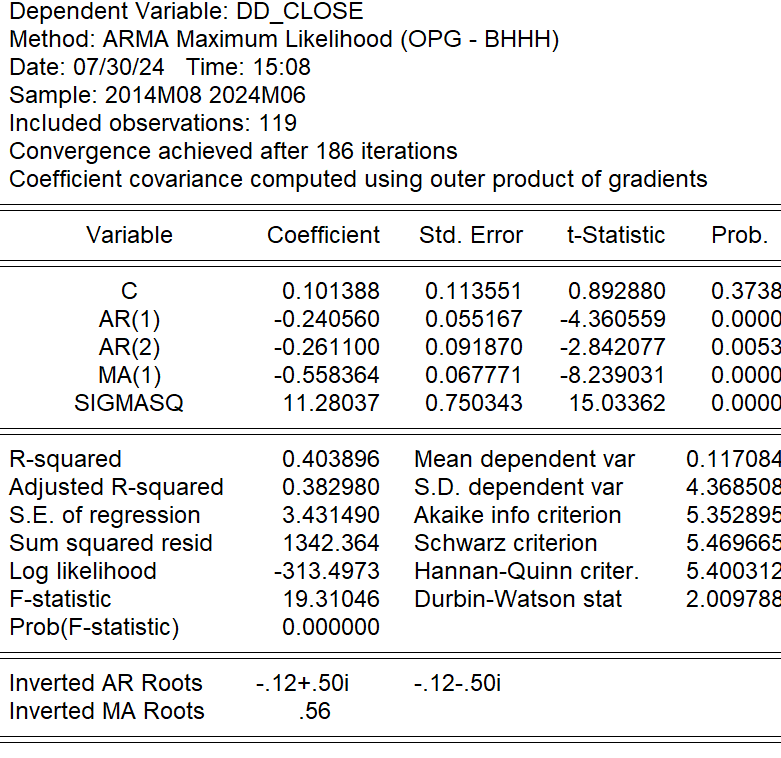
Figure 6: Model 6 output.
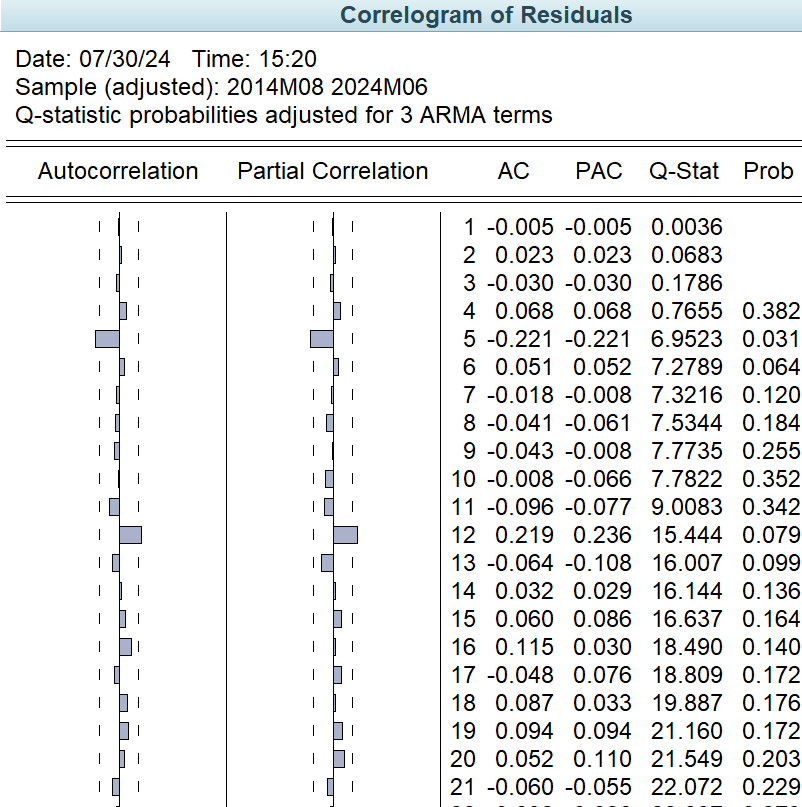
Figure 7: Model 6 - the autocorrelation test results.
2.4.4. Model 3
The equation for model3 is as follows:
\( {∆^{2}}{y_{t}}=0.092987-0.775265{ϵ_{t-1}}+{ϵ_{t}} \) (3)
In regards to stability analysis, model3 is an ARIMA(0,2,1) model and since there is no autoregressive (AR) component this paper will not discuss the inverse of the autoregressive root. The Inverted MA Roots of MA is 0.78 and its absolute value is less than 1, which suggests that the moving average component of the model is stable and does not lead to unstable oscillations in the model (Figure 8). In addition, the Durbin-Watson statistic is 2.043841 and this value is close to 2 which indicates that there is no significant positive or negative autocorrelation between the residuals as it implies that the error terms of the model are independent of each other (Figure 8). Regarding the autocorrelation test, the autocorrelation test of the residuals of Model3 shows that the p-value of all the lags is greater than 0.05 except for lag 12 which is close to 0.05, indicating that there is no significant autocorrelation between the residuals in most cases (Figure 9). In terms of the Model Predictive Power, the value of F-statistic is 36.95081 and the P-value is 0, which is much less than the significance level of 0.05, indicating that the parameters of the model are statistically significant and the model has some explanatory power.
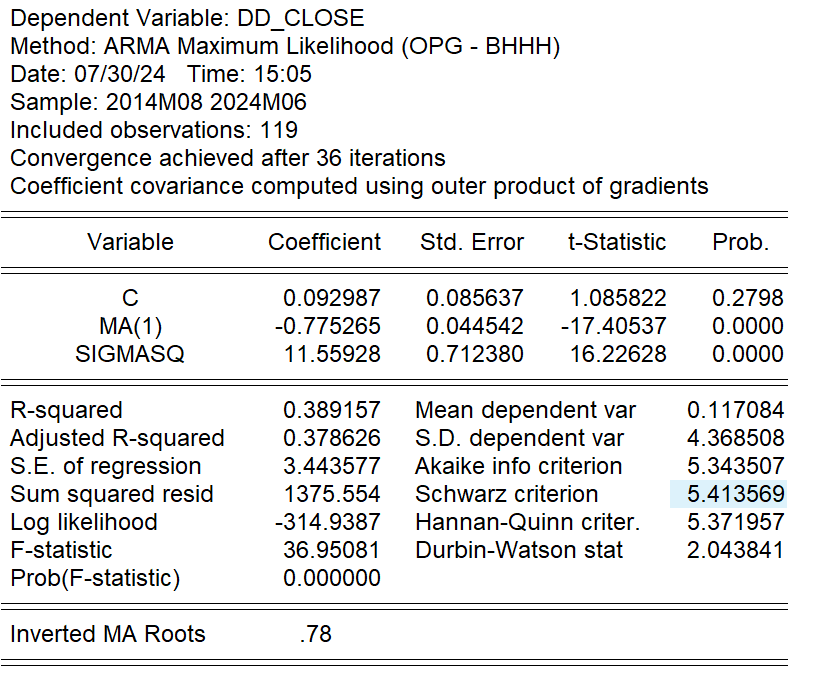
Figure 8: Model 6 output.
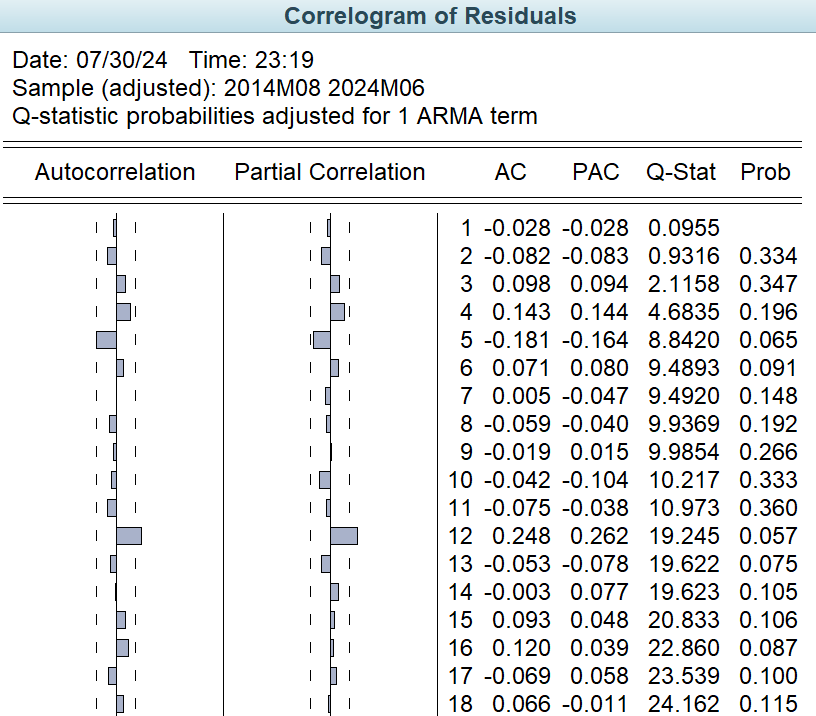
Figure 9: Model 3 - the autocorrelation test results.
2.5. Model Prediction
In this paper, the predicted values of ARIMA(2,2,1) and ARIMA(0,2,1) can be obtained as shown in the table3.
Table 3: the predicted values of ARIMA(2,2,1) and ARIMA(0,2,1).
Month Actual close | Predicted close | ||
ARIMA(0,2,1) | ARIMA(2,2,1) | ||
2024.01 | 61.527 | 61.174 | 61.482 |
2024.02 | 79.112 | 71.758 | 79.168 |
2024.03 | 90.356 | 80.422 | 90.494 |
2024.04 | 86.402 | 83.709 | 86.461 |
2024.05 | 109.633 | 119.421 | 109.669 |
2024.06 | 123.540 | 110.145 | 123.583 |
2024.07 | 125.908 | 123.701 | |
2024.08 | 125.836 | 123.652 | |
2024.09 | 125.996 | 123.998 | |
2024.1 | 126.202 | 124.186 | |
2024.11 | 126.245 | 124.306 | |
2024.12 | 129.846 | 124.365 | |
Based on the prediction results, it can be seen that the model ARIMA(2,2,1) has a tendency to converge from July to December. And it keeps converging to 124. The reason for this happening may be because the model is lacking in capturing the data with the dynamic changes, or the data used in this study is smoother and a bit fitted. In contrast, the predicted values of the ARIMA(0,2,1) model(Table 3), although also showing a certain convergence trend, are relatively more dispersed and better reflect the volatility of the data. Therefore, in comparison, the ARIMA(0,2,1) model is better and can more accurately predict the future trend of NVIDIA's stock price.That means model 3 will be better than model 6.
2.6. Comparison of Predicted Effectiveness
When comparing the effectiveness of Model3 and Model6 in predicting DD_CLOSE(see figure10), Model3 performs better on a number of key statistical indicators, particularly on RMSE, MAE, MAPE and Symmetric MAPE(The smaller the value, the more accurate the prediction), which show less deviation from the actual values. Although Model 6 performs slightly better on Theil's coefficient of inequality, indicating a more even distribution of forecasts and a higher proportion of covariances, implying that its forecast errors are more in sync with changes in the actual values, in terms of overall forecasting accuracy, Model 3 provides more precise forecasts. Therefore, if the main concern is the accuracy of the predictions and their proximity to the actual observations, Model 3 ARIMA(0,2,1) may be a more appropriate choice.
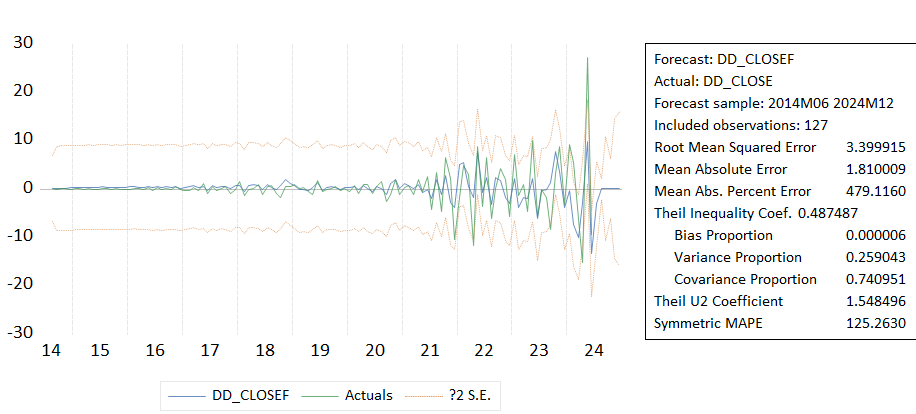
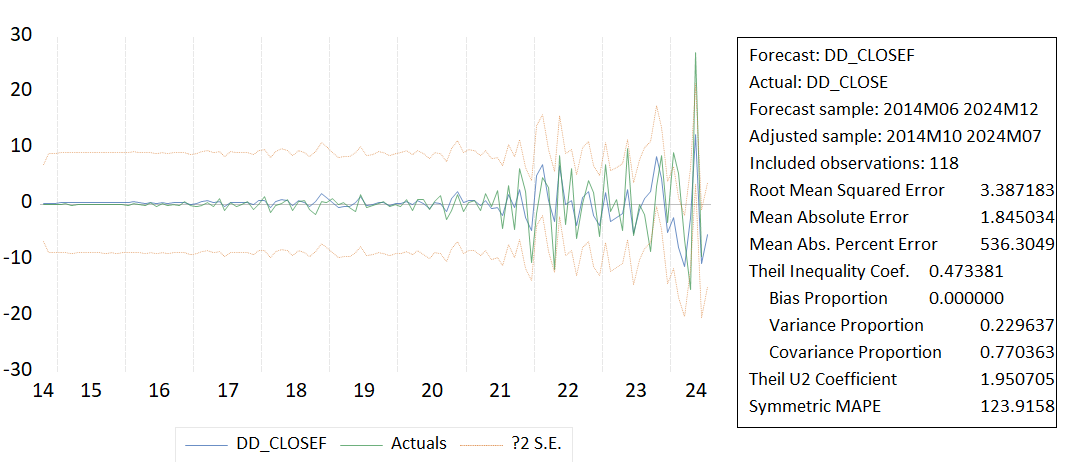
Figure 10: Comparison of Model 3 and Model 6.
3. Discussion
The ARIMA(0,2,1) model was chosen in the modelling section to forecast the monthly data of NVIDIA's stock price. The model effectively smoothes the original non-stationary time series data through second-order difference processing and captures key dynamic features in the stock price time series through a combination of autoregressive and moving average terms. Model diagnostic results show no significant autocorrelation in the residual series, demonstrating the effectiveness of the ARIMA(0,2,1) model in fitting NVIDIA's share price data.
3.1. Macro reasons for the Change in NVIDIA's Valuation
The first reason is the artificial intelligence field is currently located in a leading position. As AI technology develops rapidly and becomes popular, NVIDIA has occupied a dominant position in the AI domain through its strong GPU technique and deep learning framework CUDA. At the same time, its GPU products are extensively applied in fields such as image processing, bringing huge profits to the company [10].
The second reason is due to the rapid growth of the data center business. Over the past few years, cloud computing and big data technologies have developed quickly, triggering increasing demands for high-performance computing resources in data centres. By virtue of its powerful GPU products, NVIDIA has captured this market chance and attained quick business growth. In addition, the latest financial data reveals that NVIDIA’s data centre business revenue has surpassed 50%, becoming one of the company’s most crucial income sources [11].
The third is based on NVIDIA's strong R&D capabilities. Focusing on R&D investment, NVIDIA is dedicated to boosting sustained innovation of GPU technique. With a big R&D team and cutting-edge R&D facilities, the company constantly introduces competitive new products. Due to such strong R&D strength, the dominant position of NVIDIA in the market is greatly guaranteed [12].
Finally, with the popularization and application of technologies such as artificial intelligence, cloud computing, and big data, the demand and market for high-performance computing resources are increasing [13]. NVIDIA, as a leading company in GPU technology, has a wide range of application prospects and huge market demand for its products and technologies in the market. This rapid growth in market demand has provided strong support for NVIDIA's soaring market value [14].
3.2. Limitations of ARIMA Model
Although the ARIMA model provides this paper with a powerful predictive tool in theory, there are still some limitations in the predicted results [15]. For example, the predicted results all converge to $124, fluctuating within the range without demonstrating a great deal of variation. It is argued in this paper that the reasons for this phenomenon can be summarized into three, which are model limitations, insufficient consideration of realistic elements, and accumulation of forecasting errors.
First, the ARIMA model is mainly based on the statistical characteristics of historical data for prediction, it is difficult to fully capture the non-linear, non-stationary and sudden movements in the market. Financial markets are often affected by a variety of complex factors, including policy changes, market sentiment, macroeconomic indicators, etc., which are difficult to be fully captured by a single time series model [16].
Second, in practical applications, this paper needs to consider more realistic elements in addition to the limitations of the mathematical model itself. For example, a company's financial situation, industry development trend, market competition pattern, etc. will have an important impact on the stock price. These factors are often difficult to be directly represented in the ARIMA model, resulting in forecast results that may deviate from reality.
Furthermore, forecast errors may accumulate over time, especially in the face of complex and volatile financial markets. This means that even if the model is able to give more accurate forecasts in the short term, its accuracy may drop significantly in the long term.
4. Conclusion
The purpose of this study is to predict the closing price of NVIDIA stock using the ARIMA model, focusing on its validity and predictive accuracy. Through in-depth analysis of monthly data from July 2014 to July 2024, ARIMA(2,2,1) and ARIMA(0,2,1) were found to be the best-fitting models. The results of the study show that although both models provide valuable insights, ARIMA(0,2,1) is superior in terms of forecasting accuracy and captures stock volatility more effectively.
However, this study also has some limitations. Although the ARIMA model exhibits robustness, it appears to be weak in capturing nonlinear and sudden market volatility. The forecasts tend to converge, which highlights the limitations of the model in dealing with dynamic market changes. In addition, this study does not incorporate external factors such as macroeconomic indicators, market sentiment, or firm-specific events, which play a crucial role in fully predicting stock prices.
In order to improve subsequent studies, This paper plans to incorporate machine learning models capable of handling nonlinear patterns and integrating external economic and firm-specific factors to improve forecasting accuracy. Future research will focus on hybrid models that combine ARIMA with other forecasting techniques, such as neural networks, to better capture the complex behavior of the financial markets and thus improve the reliability of stock price forecasts.
References
[1]. QI L. Stock Data Analysis of Competing Companies in Competitive Market: The Case of NVIDIA Corporation [J]. Highlights in Science, Engineering and Technology, 2024, 94: 493-503.
[2]. KHANDERWAL S, MOHANTY D. Stock price prediction using ARIMA model [J]. International Journal of Marketing & Human Resource Research, 2021, 2(2): 98-107.
[3]. ARIYO A A, ADEWUMI A O, AYO C K. Stock price prediction using the ARIMA model; proceedings of the 2014 UKSim-AMSS 16th international conference on computer modelling and simulation, F, 2014 [C]. IEEE.
[4]. KAYA H, MARAMRAJU A, NALLAPU A. The Impact of Social Media Related Events on the Price Volatility of Mega-Cap Technology Stocks [J]. 2023.
[5]. YANG Z, WANG Z. The Research of NVIDIA Stock Price Prediction Based on LSTM And ARIMA Model [J]. Highlights in Business, Economics and Management, 2024, 24: 896-902.
[6]. SHAMIM R, AGARWAL T. MACHINE LEARNING-BASED NVIDIA STOCK PRICE PREDICTION USING AUTOTS [J]. CONNECTING: 114.
[7]. TAN J. NVIDIA Stock Price Prediction by Machine Learning [J]. Highlights in Business, Economics and Management, 2024, 24: 1072-6.
[8]. XING Y, YAN C, XIE C C. Predicting NVIDIA's Next-Day Stock Price: A Comparative Analysis of LSTM, MLP, ARIMA, and ARIMA-GARCH Models [J]. arXiv preprint arXiv:240508284, 2024.
[9]. FATTAH J, EZZINE L, AMAN Z, et al. Forecasting of demand using ARIMA model [J]. International Journal of Engineering Business Management, 2018, 10: 1847979018808673.
[10]. DONG Y, FAN H, ZHENG K. The Application of AI in Social Development And A Survey of The Stock Market of Leading Companies [J]. Highlights in Business, Economics and Management, 2024, 24: 1024-9.
[11]. CHEN S. Research on Nvidia Investment Strategies and Analysis [J]. Highlights in Business, Economics and Management, 2024, 24: 2234-40.
[12]. GAMEIRO P M R. Equity Research: Nvidia Corporation [D]; Universidade de Lisboa (Portugal), 2018.
[13]. DOS REIS GODINHO J P. Nvidia Corporation (NVDA) Nvidia: Reshaping the Foundations of Tomorrow [D]; Universidade NOVA de Lisboa (Portugal), 2022.
[14]. MARKIDIS S, DER CHIEN S W, LAURE E, et al. Nvidia tensor core programmability, performance & precision; proceedings of the 2018 IEEE international parallel and distributed processing symposium workshops (IPDPSW), F, 2018 [C]. IEEE.
[15]. PETRICĂ A-C, STANCU S, TINDECHE A. Limitation of ARIMA models in financial and monetary economics [J]. Theoretical & Applied Economics, 2016, 23(4).
[16]. KHALIFA A A, RAMESH G, DEEKSHITH R, et al. Forecasting Financial Frontiers: Real-time Insights in Stock Price Prediction through LSTM, Linear Regression, and Sentiment Analysis; proceedings of the 2024 International Congress on Human-Computer Interaction, Optimization and Robotic Applications (HORA), F, 2024 [C]. IEEE.
Cite this article
Yeung,K. (2024). ARIMA Model Application in Predicting NVIDIA’s Stock Price. Advances in Economics, Management and Political Sciences,128,220-230.
Data availability
The datasets used and/or analyzed during the current study will be available from the authors upon reasonable request.
Disclaimer/Publisher's Note
The statements, opinions and data contained in all publications are solely those of the individual author(s) and contributor(s) and not of EWA Publishing and/or the editor(s). EWA Publishing and/or the editor(s) disclaim responsibility for any injury to people or property resulting from any ideas, methods, instructions or products referred to in the content.
About volume
Volume title: Proceedings of the 3rd International Conference on Financial Technology and Business Analysis
© 2024 by the author(s). Licensee EWA Publishing, Oxford, UK. This article is an open access article distributed under the terms and
conditions of the Creative Commons Attribution (CC BY) license. Authors who
publish this series agree to the following terms:
1. Authors retain copyright and grant the series right of first publication with the work simultaneously licensed under a Creative Commons
Attribution License that allows others to share the work with an acknowledgment of the work's authorship and initial publication in this
series.
2. Authors are able to enter into separate, additional contractual arrangements for the non-exclusive distribution of the series's published
version of the work (e.g., post it to an institutional repository or publish it in a book), with an acknowledgment of its initial
publication in this series.
3. Authors are permitted and encouraged to post their work online (e.g., in institutional repositories or on their website) prior to and
during the submission process, as it can lead to productive exchanges, as well as earlier and greater citation of published work (See
Open access policy for details).
References
[1]. QI L. Stock Data Analysis of Competing Companies in Competitive Market: The Case of NVIDIA Corporation [J]. Highlights in Science, Engineering and Technology, 2024, 94: 493-503.
[2]. KHANDERWAL S, MOHANTY D. Stock price prediction using ARIMA model [J]. International Journal of Marketing & Human Resource Research, 2021, 2(2): 98-107.
[3]. ARIYO A A, ADEWUMI A O, AYO C K. Stock price prediction using the ARIMA model; proceedings of the 2014 UKSim-AMSS 16th international conference on computer modelling and simulation, F, 2014 [C]. IEEE.
[4]. KAYA H, MARAMRAJU A, NALLAPU A. The Impact of Social Media Related Events on the Price Volatility of Mega-Cap Technology Stocks [J]. 2023.
[5]. YANG Z, WANG Z. The Research of NVIDIA Stock Price Prediction Based on LSTM And ARIMA Model [J]. Highlights in Business, Economics and Management, 2024, 24: 896-902.
[6]. SHAMIM R, AGARWAL T. MACHINE LEARNING-BASED NVIDIA STOCK PRICE PREDICTION USING AUTOTS [J]. CONNECTING: 114.
[7]. TAN J. NVIDIA Stock Price Prediction by Machine Learning [J]. Highlights in Business, Economics and Management, 2024, 24: 1072-6.
[8]. XING Y, YAN C, XIE C C. Predicting NVIDIA's Next-Day Stock Price: A Comparative Analysis of LSTM, MLP, ARIMA, and ARIMA-GARCH Models [J]. arXiv preprint arXiv:240508284, 2024.
[9]. FATTAH J, EZZINE L, AMAN Z, et al. Forecasting of demand using ARIMA model [J]. International Journal of Engineering Business Management, 2018, 10: 1847979018808673.
[10]. DONG Y, FAN H, ZHENG K. The Application of AI in Social Development And A Survey of The Stock Market of Leading Companies [J]. Highlights in Business, Economics and Management, 2024, 24: 1024-9.
[11]. CHEN S. Research on Nvidia Investment Strategies and Analysis [J]. Highlights in Business, Economics and Management, 2024, 24: 2234-40.
[12]. GAMEIRO P M R. Equity Research: Nvidia Corporation [D]; Universidade de Lisboa (Portugal), 2018.
[13]. DOS REIS GODINHO J P. Nvidia Corporation (NVDA) Nvidia: Reshaping the Foundations of Tomorrow [D]; Universidade NOVA de Lisboa (Portugal), 2022.
[14]. MARKIDIS S, DER CHIEN S W, LAURE E, et al. Nvidia tensor core programmability, performance & precision; proceedings of the 2018 IEEE international parallel and distributed processing symposium workshops (IPDPSW), F, 2018 [C]. IEEE.
[15]. PETRICĂ A-C, STANCU S, TINDECHE A. Limitation of ARIMA models in financial and monetary economics [J]. Theoretical & Applied Economics, 2016, 23(4).
[16]. KHALIFA A A, RAMESH G, DEEKSHITH R, et al. Forecasting Financial Frontiers: Real-time Insights in Stock Price Prediction through LSTM, Linear Regression, and Sentiment Analysis; proceedings of the 2024 International Congress on Human-Computer Interaction, Optimization and Robotic Applications (HORA), F, 2024 [C]. IEEE.