


1. Introduction
Accurately predicting the spread of infectious diseases is critical for public health planning and response. Reliable forecasts of infection rates enable governments and healthcare systems to allocate resources, implement timely interventions, and mitigate the spread of the disease. For COVID-19, in particular, the ability to anticipate future outbreaks can directly influence the effectiveness of pandemic management strategies. Accurate predictions help avoid overwhelming healthcare infrastructures, inform vaccination distribution, and guide policy decisions such as travel restrictions and quarantine measures. Therefore, developing effective predictive models for COVID-19 infection rates is essential for maintaining public health and safety.
Over the past few years, numerous studies have focused on forecasting COVID-19 cases using a range of statistical and machine learning methods. For example, Petropoulos and Makridakis applied time series models to provide short-term forecasts of COVID-19 cases globally, highlighting the effectiveness of simple statistical methods in pandemic forecasting [1]. Similarly, Tuli et al. utilized machine learning models, including Random Forests and Long Short-Term Memory (LSTM) networks, to predict infection trends and assess healthcare demands. In another study, Chakraborty and Ghosh reviewed various forecasting techniques and proposed the use of ARIMA models to capture the temporal dynamics of COVID-19 spread in different regions [2-3].
Additional research efforts have employed hybrid models to enhance predictive accuracy. For instance, Arroyo-Marioli et al. combined classical epidemiological models with machine learning techniques to improve the forecasting of COVID-19 infection peaks [4]. Bandyopadhyay and Dutta leveraged deep learning models such as Convolutional Neural Networks (CNNs) to capture the spatial-temporal dynamics of COVID-19 transmission [5]. More recently, Vaid et al. incorporated vaccination rates and government policy stringency as features in their forecasting models, emphasizing the importance of integrating multiple factors for comprehensive pandemic forecasting [6].
Despite these efforts, the study of accurately predicting COVID-19 infection cases remains relatively underexplored given the scale of this pandemic. As the largest global health crisis of the 21st century, there is a pressing need for more research focused on precise infection case forecasting, which is crucial for future disease prevention and management.
In this study, this gap is addressed by undertaking the following tasks: first, utilizing data up to the end of March 2022 from four European countries—Germany, Italy, Malta, and Sweden—to predict COVID-19 infection numbers for April and May 2022; second, applying two different forecasting models: the Seasonal Autoregressive Integrated Moving Average (SARIMA) model, which is designed to capture seasonal patterns in time series data, and a Random Forest regression model, which is a machine learning technique capable of modeling complex, nonlinear relationships; third, incorporating various factors into the models, including lagged case numbers (lagcases7), daily vaccination rates, temperature (maximum daily), and jurisdictional policies to enrich the predictive analysis; fourth, evaluating the performance of both models using Root Mean Square Error (RMSE) and Mean Absolute Error (MAE) to identify the more effective forecasting method; fifth, conducting a feature importance analysis using the Random Forest model to identify key variables influencing COVID-19 case predictions, providing insights into the factors that drive infection trends.
The significance of this study lies in its comparative analysis of classical statistical models and advanced machine learning techniques in forecasting COVID-19 infections. The results not only highlight the potential of machine learning models in improving predictive accuracy but also offer valuable information for policymakers. By identifying critical factors that drive infection trends, this research contributes to the development of more effective strategies for future pandemic responses and public health interventions.
2. Data
2.1. Data Source and Time Range
The main data used in this study are collected from the European Centre for Disease Prevention and Control (ECDC) database which provides daily reported COVID-19 infection cases for various European countries. The analysis centers on data from representative countries, namely Germany, Italy, Malta, and Sweden, covering the period from 2020 to 2022.The prediction target is the infection cases for April and May of 2022, using data up until the end of March of 2022.
Additionally, complementary data on population, daily vaccinations, maximum temperature of the biggest city, death cases and national jurisdiction extents were sourced from Kaggle, Meteostat and OxCGRT, which serve as exogenous variables [7].
2.2. Data Processing
In this study, several data preprocessing techniques are implemented to ensure the quality and reliability of the dataset used for the prediction. First, the issue of missing values was addressed. For each country, the dataset was filtered to remove any missing entries in the daily reported COVID-19 cases. Following the removal of missing values, the process of identifying and handling outliers was carried out.
The Interquartile Range (IQR) method was applied to handle outliers, calculating the range between the first quartile (Q1) and the third quartile (Q3) of the data. This method is effective for detecting extreme values that fall below Q1 - 1.5 * IQR or above Q3 + 1.5 * IQR. Any values outside this range were considered outliers and replaced with the lower or upper bound, respectively.
A logarithmic transformation was applied to the population data to normalize the distribution, considering the large differences in population sizes across the countries. This transformation helps mitigate the impact of population skewness on the prediction model.
After preprocessing, the dataset was divided into training and test sets, with data up to April 1, 2022, used for training and validation, and data from April 1 to June 1, 2022, reserved for testing. This ensures that the model is evaluated on unseen data, simulating a real-world prediction scenario.
2.3. Descriptive Statistics
The basic descriptive statistics of infection cases in these countries are shown in Table 1.
Table 1: descriptive statistics of infection cases
Countries | count | mean | std | 25% | 50% | 75% | max |
Germany | 992.0 | 35572.268145 | 56682.109086 | 2088.0 | 11359.0 | 41831.75 | 307914.0 |
Italy | 974.0 | 23983.244353 | 35436.68566 | 2681.5 | 11672.5 | 28313.0 | 228123.0 |
Malta | 974.0 | 119.54668 | 180.373579 | 16.0 | 57.5 | 141.25 | 1403.0 |
Sweden | 982.0 | 2652.613035 | 5806.913301 | 315.0 | 800.0 | 2500.5 | 53881.0 |
For countries with larger populations, such as Germany and Italy, the average daily cases were considerably higher than for smaller nations like Malta. The standard deviation and the interquartile range fluctuate highly due to waves of infections, lockdowns, or changes in testing policies, especially in Germany, Italy and Sweden, which exhibited key trends for the training and validation data.
Analysis of the daily-updated positive testing data trend reveals that most countries experienced consistent increases in daily cases during major waves of the pandemic, influenced by factors such as new variants (e.g., Delta and Omicron) and varying lockdown measures [8]. What’s more, due to underreporting or weekends/holidays, the testing was potentially reduced. This led to the difficulties for handling missing values, outliers and misleading prediction during data experiment.
3. Methodologies
This paper mainly uses SARIMA and RANDOM FOREST to forecast the infection cases of covid19 in European countries based on the data by the end of March 2022. This chapter mainly introduces these two methods, which predict the cases in April and May in 2022 in several European countries and compare the prediction effect by calculating the RMSE and MAE of the predicted value and the real value, and finally visualize the prediction results.
3.1. SARIMA
The SARIMA model is an extension of the ARIMA (AutoRegressive Integrated Moving Average) model that explicitly accounts for seasonality in the data. The general form of SARIMA is denoted as SARIMA(p,d,q)(P,D,Q)[s], where:
p represents the order of the autoregressive part,
d represents the order of differencing to make the series stationary,
q represents the order of the moving average part,
P, D, and Q represent the seasonal components of autoregressive, differencing, and moving average parts, respectively,
s is the length of the seasonal cycle (e.g., 7 for weekly seasonality in daily data).
The analysis began with a time series decomposition to identify potential seasonality and trends. The auto.arima function was then applied to automatically select the optimal SARIMA model based on model selection criteria. The selection was guided by calculating metrics such as Akaike Information Criterion (AIC), corrected AIC (AICc), and Bayesian Information Criterion (BIC). Additionally, the model's performance was evaluated using error metrics, including Mean Error (ME), Root Mean Square Error (RMSE), Mean Absolute Error (MAE), Mean Percentage Error (MPE), Mean Absolute Percentage Error (MAPE), Mean Absolute Scaled Error (MASE), and the first lag of the autocorrelation function (ACF1). The final model was then used to generate forecasts for the validation period.
3.2. Random Forest
The Random Forest (RF) algorithm is a robust ensemble learning method based on decision trees, capable of handling high-dimensional data and non-linear relationships [9-10] (See Figure 1). The prediction of daily COVID-19 infection cases is treated as a regression problem in this approach.
Lagged infection case values and additional exogenous variables (e.g., deaths, logarithm of population, lagged cases from the past 7 days, maximum temperature of the largest city, daily vaccination rates, and national jurisdiction parameters) are utilized as input features for the model. The hyperparameters of the Random Forest model, such as the number of trees, maximum depth, and minimum samples per leaf, are optimized using cross-validation.
For each decision tree, a random subset of the features and training samples are selected, and predictions from multiple trees are averaged to generate the final forecast. This reduces overfitting and improves model robustness.
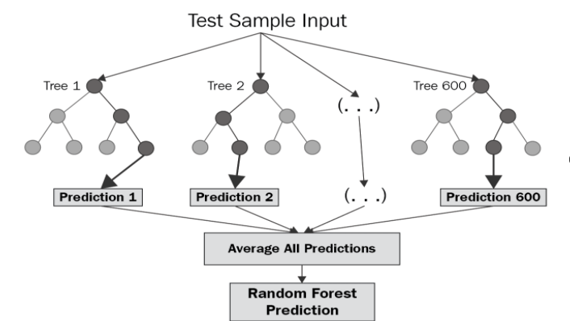
Figure 1: Random Forest prediction model
4. Results
4.1. Time Series Decomposition
A time series decomposition was conducted for each of the selected countries to better understand the trends and seasonality in the COVID-19 infection data: Malta, Sweden, Germany, and Italy. The decomposition breaks down the observed time series into three components: trend, seasonal, and random (or residual) (See Figure 2-Figure 5).
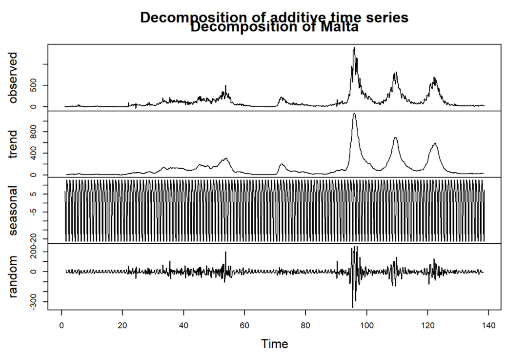
Figure 2: Decomposition for Malta
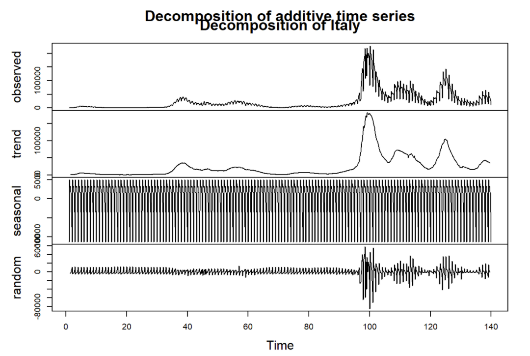
Figure 3: Decomposition for Italy
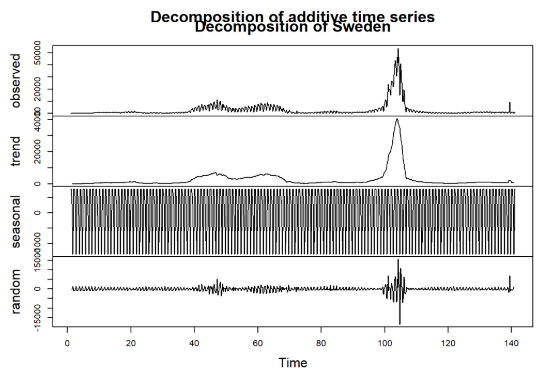
Figure 4: Decomposition for Sweden
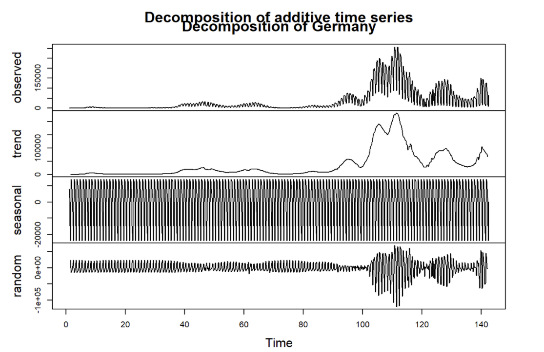
Figure 5: Decomposition for Germany
Observed: This is the original series, showing the daily infection cases over time for each country. Notable peaks and changes can be seen, corresponding to various waves of infections throughout the observation period.
Trend: The trend component illustrates the underlying direction of infection cases, smoothing out short-term fluctuations. As seen in the decomposed plots, countries such as Germany and Italy exhibit clear rising trends at certain intervals, indicating periods of increased infections. In contrast, the trend for Malta is relatively lower, reflecting its different infection dynamics.
Seasonal: The seasonal component reveals repeating patterns within the data, capturing periodic fluctuations over a specified cycle (e.g., weekly seasonality). All four countries show strong seasonal patterns, suggesting that infection rates may be influenced by recurring factors, possibly including weekly behavioral changes, public health policies, or variations in testing practices.
Random (Residual): The random component captures the noise and irregular variations in the data that cannot be explained by the trend or seasonality. Each country exhibits some degree of randomness, possibly resulting from unpredictable events or changes in external conditions, such as sudden policy implementations or shifts in public behavior.
This decomposition process provides a clearer view of how trends, seasonality, and random fluctuations contribute to the overall infection dynamics in each country. Understanding these components is crucial for selecting appropriate forecasting models and improving prediction accuracy in subsequent analyses.
4.2. SARIMA
The SARIMA model was employed to predict the number of daily COVID-19 infection cases for several European countries, including Germany, Italy, Malta and Sweden. The training data spanned from the beginning of the pandemic until the end of March 2022, with predictions generated for the period between April 1 and June 1, 2022 (See Figure 6-Figure 9).
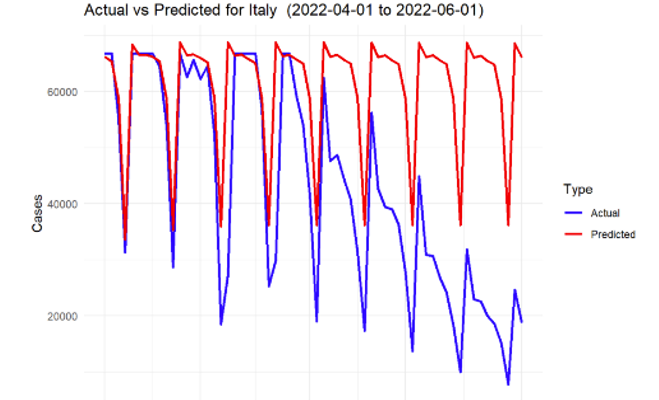
Figure 6: SARIMA prediction for Italy
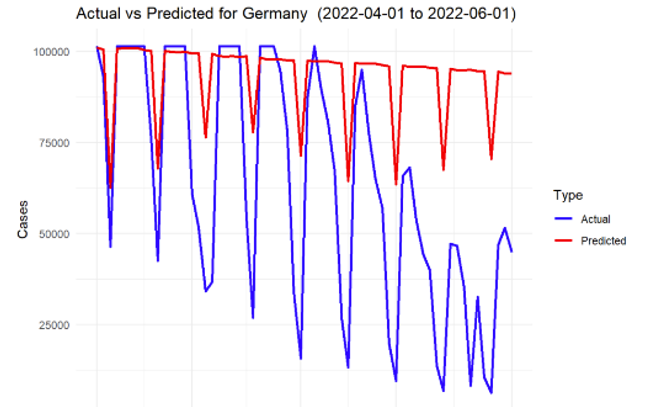
Figure 7: SARIMA prediction for Germany
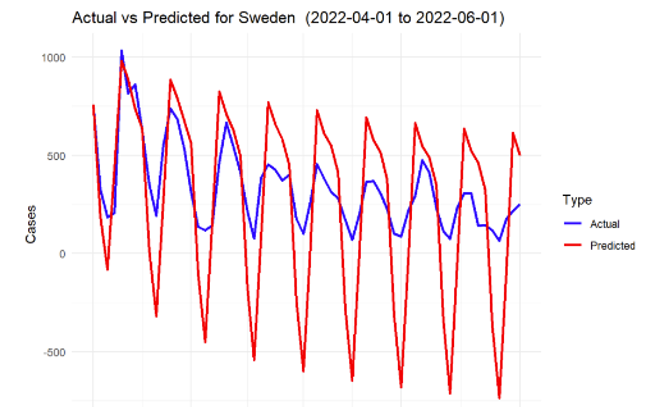
Figure 8: SARIMA prediction for Sweden
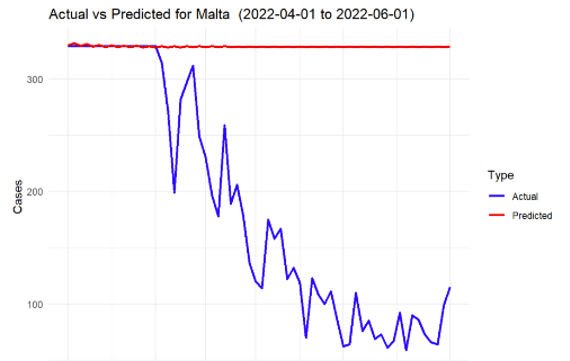
Figure 9: SARIMA prediction for Malta
The model was able to capture the overall trends in infection rates effectively for most of the countries. The predictions showed that during the spring of 2022, there was an overall decline in infection rates across all the countries, largely consistent with the easing of lockdown measures and the increasing number of vaccinations.
However, the accuracy of the model varied between countries. For example, the model performed exceptionally well for countries with stable infection patterns, such as Germany and Sweden, where the predicted values closely followed the actual reported cases. On the other hand, countries like Malta, with more volatile infection patterns, showed greater deviations between predicted and actual cases.
In general, the mean absolute error (MAE) and root mean square error (RMSE) values across all countries indicated satisfactory performance, with smaller error values for countries with more stable data. The following Table 2 presents a summary of the key performance metrics for each country.
Table 2: RMSE & MAE of the SARIMA prediction
Country | RMSE | MAE |
Germany | 40216.8535 | 30566.3015 |
Italy | 24281.4601 | 18247.6911 |
Malta | 176.1702 | 142.7981 |
Sweden | 344.1079 | 282.7384 |
The SARIMA model's ability to incorporate historical infection rates and account for seasonal patterns made it a robust choice for this forecasting task.
4.3. Random Forest
The Random Forest Regression model was applied to predict daily COVID-19 infection cases for five European countries: Germany, Italy, Malta and Sweden. The model training was based on data up until the end of March 2022, and predictions were generated for the period between April 1 and June 1, 2022 (See Figure 10-Figure 13).
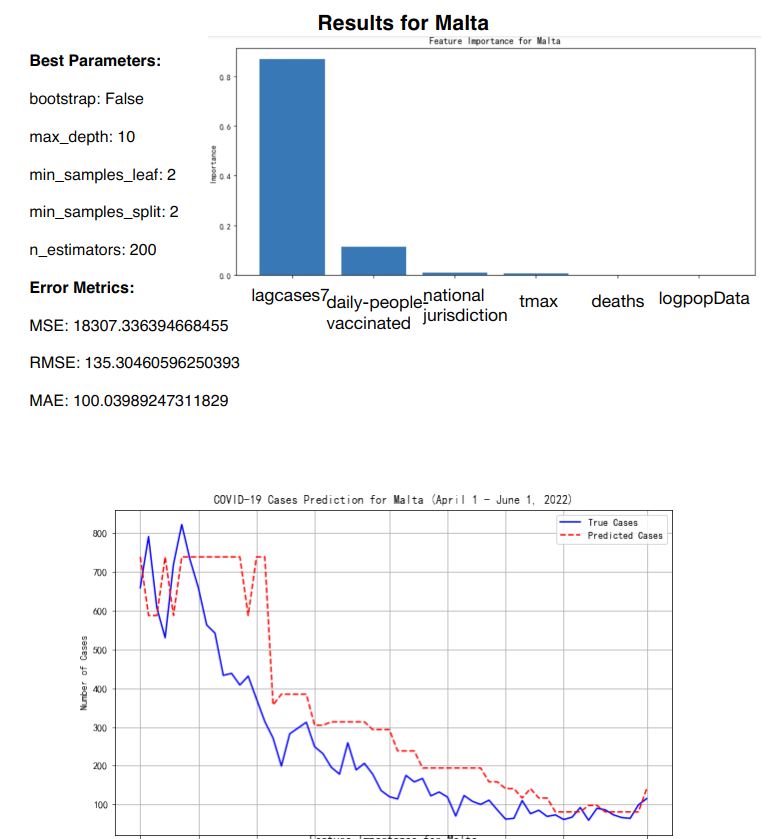
Figure 10: RF prediction for Malta
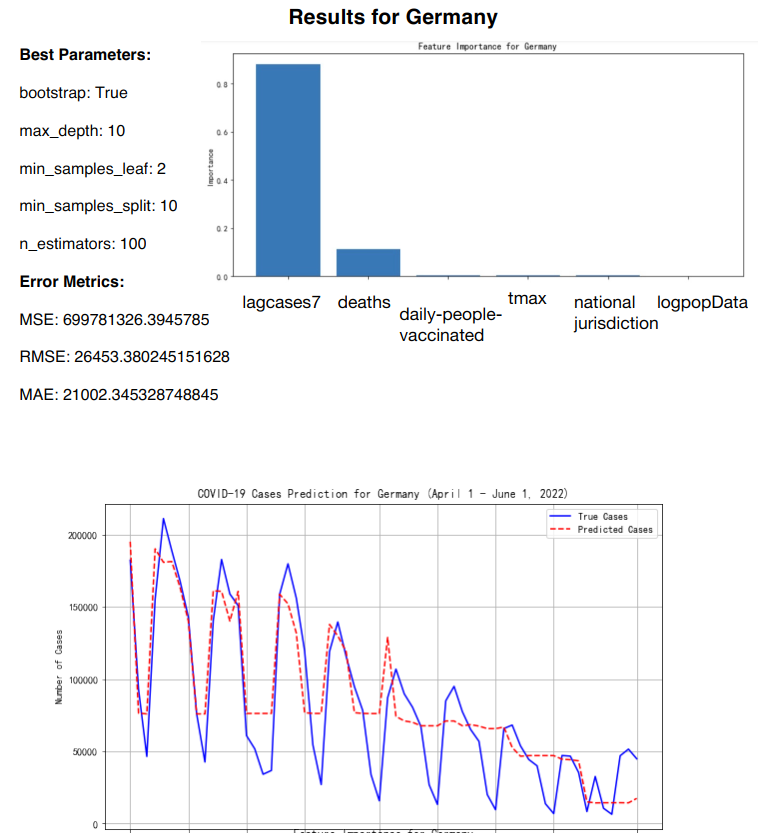
Figure 11: RF prediction for Germany
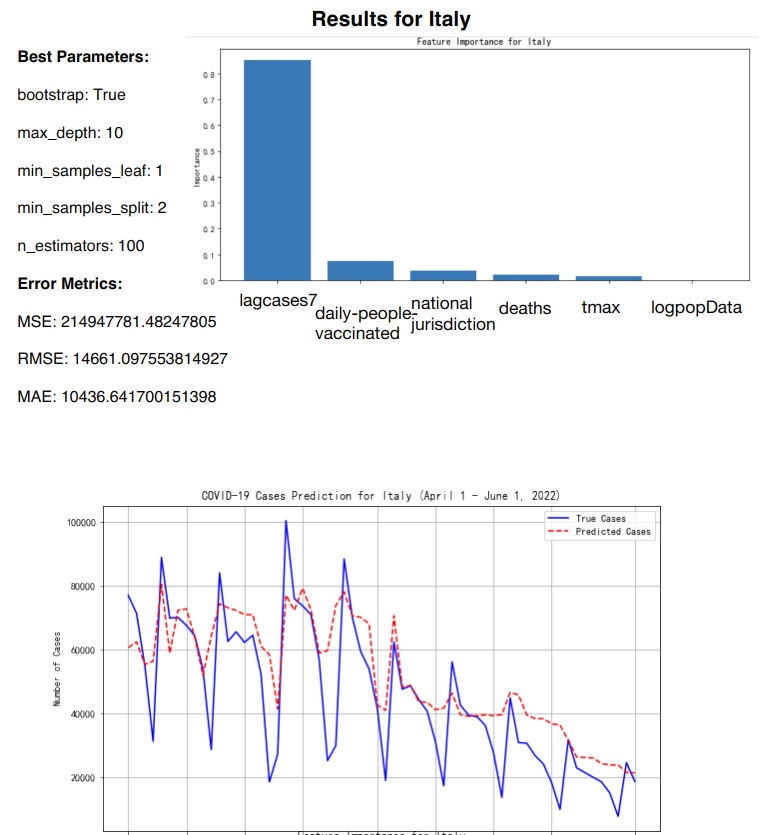
Figure 12: RF prediction for Italy
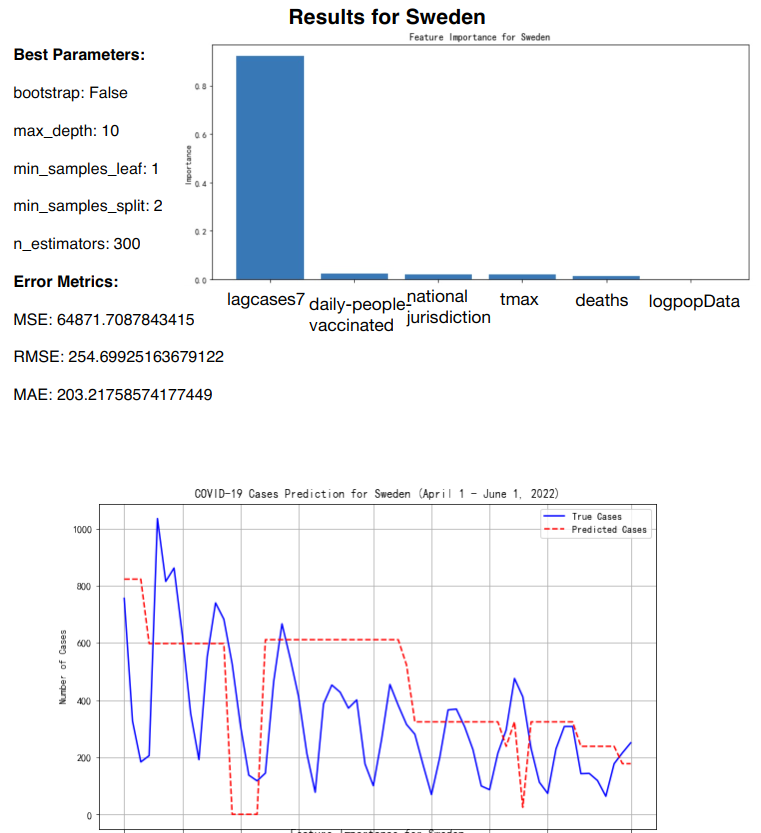
Figure 13: RF prediction for Sweden
The key features included in the model were the number of deaths, population size (logarithm of population), number of cases in the previous 7 days (lagcases7), daily maximum temperature (tmax), daily people vaccinated, and national jurisdiction stringency index [7] (See Table 3).
Table 3: Correlation coefficients between factors
deaths | logpopData2020 | lagcases7 | tmax | daily_people_vaccinated | national jurisdiction | |
deaths | 1 | 0.47085 | 0.335579 | -0.22254 | 0.1414 | 0.405918 |
logpopData2020 | 0.47085 | 1 | 0.363144 | 0.000247 | 0.3545 | 0.293518 |
lagcases7 | 0.335579 | 0.363144 | 1 | -0.11433 | 0.028942 | -0.10131 |
tmax | -0.22254 | 0.000247 | -0.11433 | 1 | 0.140819 | 0.064359 |
daily_people_vaccinated | 0.1414 | 0.3545 | 0.028942 | 0.140819 | 1 | 0.311882 |
national jurisdiction | 0.405918 | 0.293518 | -0.10131 | 0.064359 | 0.311882 | 1 |
The model performance, as measured by Root Mean Square Error (RMSE) and Mean Absolute Error (MAE), varied across countries. This indicates that the model performed better in countries with smaller, more stable infection rates, like Malta and Sweden, where the predicted values closely followed the actual cases. The MAE values showed a similar pattern, with Malta having the smallest error (100.04) and Germany the largest (21,002.35) (See Table 4).
Table 4: RMSE&MAE of the RF prediction
Country | RMSE | MAE |
Germany | 26453.38 | 21002.35 |
Italy | 14661.09 | 10436.64 |
Malta | 135.3 | 100.04 |
Sweden | 254.69 | 203.22 |
The feature importance analysis reveals that the most influential factor across all countries was "lagcases7" (the total number of cases over the past 7 days), which accounted for between 75% and 80% of the model's predictive power. Other features, such as "daily-people-vaccinated" and "deaths," played a minor but still notable role, particularly in countries with higher vaccination rates and more pronounced daily death counts. National jurisdiction, temperature, and population size contributed only minimally to the predictions, indicating their limited impact on daily case fluctuations (See Table 5).
Table 5: Feature importances for each country
Variable | Germany | Italy | Malta | Sweden |
lagcases7 | 0.8 | 0.77 | 0.75 | 0.78 |
daily-people-vaccinated | 0.05 | 0.08 | 0.1 | 0.07 |
national jurisdiction | 0.03 | 0.05 | 0.05 | 0.04 |
tmax | 0.02 | 0.04 | 0.03 | 0.03 |
deaths | 0.1 | 0.05 | 0.06 | 0.06 |
logpopData2020 | 0.0 | 0.01 | 0.01 | 0.02 |
In summary, while the Random Forest model demonstrated varying levels of accuracy across different countries, it performed well in capturing infection trends, especially in countries with more stable patterns. The predictive accuracy was largely driven by recent infection data (lagcases7), while other factors had more modest impacts. The model's predictions could be further refined by tuning the feature set or employing additional time-series-specific models.
4.4. Comparison
To evaluate the prediction performance of the SARIMA and Random Forest models, this paper focuses on the Root Mean Square Error (RMSE) and Mean Absolute Error (MAE) values for each country.
SARIMA Model:
The SARIMA model generally produced higher RMSE and MAE values across the countries, indicating more substantial deviations in its predictions compared to the observed values.
For instance, Germany had a significantly high RMSE of 40,216.85 and an MAE of 30,566.30, suggesting large errors in forecasting infection cases.
Other countries like Italy, Malta, and Sweden also exhibited high RMSE and MAE values, indicating that while SARIMA can capture the general trend and seasonality in time series data, it might struggle with sudden fluctuations.
Random Forest Model:
The Random Forest model demonstrated comparatively lower RMSE and MAE values for the same countries, indicating more accurate predictions.
For Germany, the RMSE was reduced to 26,453.38, and the MAE dropped to 21,002.35, showing a significant improvement over the SARIMA model.
Similarly, Italy, Malta, and Sweden had lower errors using the Random Forest model, highlighting its capability to capture complex patterns and interactions within the data more effectively than SARIMA.
The comparison between SARIMA and Random Forest models reveals that the Random Forest model achieves higher prediction accuracy, as indicated by the lower RMSE and MAE values across all countries. Additionally, the Random Forest model's feature importance analysis provides valuable insights into the primary drivers of COVID-19 case dynamics. In contrast, the SARIMA model, while useful for capturing general trends and seasonality, appears less capable of handling the complexities inherent in the data. Thus, for the countries and data considered, the Random Forest model outperforms the SARIMA model in terms of predictive accuracy.
5. Conclusion
This study aimed to forecast COVID-19 infection cases in four European countries—Germany, Italy, Malta, and Sweden—during April and May of 2022 using two distinct models: the Seasonal Autoregressive Integrated Moving Average (SARIMA) model and a Random Forest regression model. Data up to the end of March 2022, including lagged case numbers, vaccination rates, temperature, and jurisdictional policies, were utilized for this purpose. The results indicate that while the SARIMA model effectively captures general seasonal trends, the Random Forest model outperforms it in predictive accuracy, as demonstrated by lower Root Mean Square Error (RMSE) and Mean Absolute Error (MAE) values. Additionally, the feature importance analysis from the Random Forest model reveals that recent infection rates (lagcases7) significantly impact future case predictions, suggesting that machine learning techniques have strong potential for capturing complex interactions in epidemiological data. These findings offer valuable insights for policymakers, aiding in the planning of effective pandemic responses.
For future research, expanding the predictive models to include more countries and additional features such as mobility data, healthcare capacity, and varying policy measures could further enhance forecast accuracy. Moreover, integrating hybrid models that combine statistical and machine learning methods may yield more robust and adaptable predictions. Continuous refinement of these predictive models is crucial for their application in real-time pandemic management, helping to inform and guide public health policies effectively.
References
[1]. Petropoulos, F., & Makridakis, S. (2020). Forecasting the novel coronavirus COVID-19. PloS one, 15(3), e0231236.
[2]. Iqbal, M., Al-Obeidat, F., Maqbool, F., Razzaq, S., Anwar, S., Tubaishat, A., Khan, M. S., & Shah, B. (2021). COVID-19 Patient Count Prediction Using LSTM. IEEE transactions on computational social systems, 8(4), 974–981.
[3]. Chakraborty, T., & Ghosh, I. (2020). Real-time forecasts and risk assessment of novel coronavirus (COVID-19) cases: A data-driven analysis. Chaos, solitons, and fractals, 135, 109850.
[4]. Arroyo-Marioli, F., Bullano, F., Kucinskas, S., & Rondón-Moreno, C. (2021). Tracking of COVID-19: A new real-time estimation using the Kalman filter. PloS one, 16(1), e0244474.
[5]. Dutta, S., & Bandyopadhyay, S. K. (2020). Machine learning approach for confirmation of COVID-19 cases: Positive, negative, death, and release. Iberoamerican Journal of Medicine, 2(3), 172-177.
[6]. Yang, P., Yang, Z., Zhao, C., Li, X., Shao, Z., Liu, K., & Shang, L. (2022). Vaccination and Government Stringent Control as Effective Strategies in Preventing SARS-CoV-2 Infections: A Global Perspective. Frontiers in public health, 10, 903511.
[7]. Guevarra, E. (2020). oxcgrt: An interface to the Oxford COVID-19 Government Response Tracker API (R package version 0.1.0).
[8]. Chan, Y. L. E., Irvine, M. A., Prystajecky, N., Sbihi, H., Taylor, M., Joffres, Y., Schertzer, A., Rose, C., Dyson, L., Hill, E. M., Tildesley, M., Tyson, J. R., Hoang, L. M. N., & Galanis, E. (2023). Emergence of SARS-CoV-2 Delta Variant and Effect of Nonpharmaceutical Interventions, British Columbia, Canada. Emerging infectious diseases, 29(10), 1999–2007.
[9]. Galasso, J., Cao, D. M., & Hochberg, R. (2022). A random forest model for forecasting regional COVID-19 cases utilizing reproduction number estimates and demographic data. Chaos, solitons, and fractals, 156, 111779.
[10]. Demir, İ., & Kirisci, M. (2022). Forecasting COVID-19 Disease Cases Using the SARIMA-NNAR Hybrid Model. Universal Journal of Mathematics and Applications, 5(1), 15-23.
Cite this article
Zhou,S. (2024). Using SARIMA Method and Random Forest to Predict the Covid-19 Infection Cases. Advances in Economics, Management and Political Sciences,140,1-13.
Data availability
The datasets used and/or analyzed during the current study will be available from the authors upon reasonable request.
Disclaimer/Publisher's Note
The statements, opinions and data contained in all publications are solely those of the individual author(s) and contributor(s) and not of EWA Publishing and/or the editor(s). EWA Publishing and/or the editor(s) disclaim responsibility for any injury to people or property resulting from any ideas, methods, instructions or products referred to in the content.
About volume
Volume title: Proceedings of ICFTBA 2024 Workshop: Finance's Role in the Just Transition
© 2024 by the author(s). Licensee EWA Publishing, Oxford, UK. This article is an open access article distributed under the terms and
conditions of the Creative Commons Attribution (CC BY) license. Authors who
publish this series agree to the following terms:
1. Authors retain copyright and grant the series right of first publication with the work simultaneously licensed under a Creative Commons
Attribution License that allows others to share the work with an acknowledgment of the work's authorship and initial publication in this
series.
2. Authors are able to enter into separate, additional contractual arrangements for the non-exclusive distribution of the series's published
version of the work (e.g., post it to an institutional repository or publish it in a book), with an acknowledgment of its initial
publication in this series.
3. Authors are permitted and encouraged to post their work online (e.g., in institutional repositories or on their website) prior to and
during the submission process, as it can lead to productive exchanges, as well as earlier and greater citation of published work (See
Open access policy for details).
References
[1]. Petropoulos, F., & Makridakis, S. (2020). Forecasting the novel coronavirus COVID-19. PloS one, 15(3), e0231236.
[2]. Iqbal, M., Al-Obeidat, F., Maqbool, F., Razzaq, S., Anwar, S., Tubaishat, A., Khan, M. S., & Shah, B. (2021). COVID-19 Patient Count Prediction Using LSTM. IEEE transactions on computational social systems, 8(4), 974–981.
[3]. Chakraborty, T., & Ghosh, I. (2020). Real-time forecasts and risk assessment of novel coronavirus (COVID-19) cases: A data-driven analysis. Chaos, solitons, and fractals, 135, 109850.
[4]. Arroyo-Marioli, F., Bullano, F., Kucinskas, S., & Rondón-Moreno, C. (2021). Tracking of COVID-19: A new real-time estimation using the Kalman filter. PloS one, 16(1), e0244474.
[5]. Dutta, S., & Bandyopadhyay, S. K. (2020). Machine learning approach for confirmation of COVID-19 cases: Positive, negative, death, and release. Iberoamerican Journal of Medicine, 2(3), 172-177.
[6]. Yang, P., Yang, Z., Zhao, C., Li, X., Shao, Z., Liu, K., & Shang, L. (2022). Vaccination and Government Stringent Control as Effective Strategies in Preventing SARS-CoV-2 Infections: A Global Perspective. Frontiers in public health, 10, 903511.
[7]. Guevarra, E. (2020). oxcgrt: An interface to the Oxford COVID-19 Government Response Tracker API (R package version 0.1.0).
[8]. Chan, Y. L. E., Irvine, M. A., Prystajecky, N., Sbihi, H., Taylor, M., Joffres, Y., Schertzer, A., Rose, C., Dyson, L., Hill, E. M., Tildesley, M., Tyson, J. R., Hoang, L. M. N., & Galanis, E. (2023). Emergence of SARS-CoV-2 Delta Variant and Effect of Nonpharmaceutical Interventions, British Columbia, Canada. Emerging infectious diseases, 29(10), 1999–2007.
[9]. Galasso, J., Cao, D. M., & Hochberg, R. (2022). A random forest model for forecasting regional COVID-19 cases utilizing reproduction number estimates and demographic data. Chaos, solitons, and fractals, 156, 111779.
[10]. Demir, İ., & Kirisci, M. (2022). Forecasting COVID-19 Disease Cases Using the SARIMA-NNAR Hybrid Model. Universal Journal of Mathematics and Applications, 5(1), 15-23.