


1. Introduction
The first five years of the 2020s were dominated by economic recession, frequent geopolitical conflicts, and sustained volatility in financial markets. Nevertheless, driven by expectations of economic recovery, the credit lending market experienced expansions from time to time. However, the high-pressure market environment has brought significant default risks that threaten financial stability, necessitating more effective risk management strategies. For example, the non-performing loan balance of Chinese commercial banks reached 3.3 trillion yuan in the fourth quarter of 2024 [1]. In traditional risk assessment systems handling imbalanced data, single models such as logistic regression exhibit a recall rate below 40%. This shortfall increases the likelihood of missing high-risk clients. Consequently, leveraging ensemble learning to overcome the limitations of existing models has become a critical challenge. With the advancement of artificial intelligence, machine learning techniques are increasingly emerging as core tools for risk prediction. Focusing on a dataset where default samples account for 20%, we employ SMOTEENN (Synthetic Minority Over-sampling Technique with Edited Nearest Neighbors) hybrid sampling to optimize data distribution.
2. Literature review
In existing literature, numerous studies have employed various machine learning models and methods to evaluate and predict financial credit risks. Current study developed a credit risk evaluation model by constructing a Logistic regression model using principal component analysis [2]. Others improved the accuracy of the XGBoost model for credit default assessment through parameter optimization [3]. Previous research used classifiers such as LightGBM, XGBoost, Logistic regression, and Random Forest (RF) to develop a risk prediction model for principal non-recovery [4]. It compared XGBoost, decision trees, and K-nearest neighbors (K-NN) algorithms. To balance interpretability and default discrimination, they selected XGBoost to build a default prediction model [5]. In the book Artificial Intelligence in Financial Markets, Moro compared Support Vector Machines (SVM) with advanced models to construct a credit scoring model [6]. Goh et al. reviewed credit scoring models using SVM and meta-heuristic methods from 1997 to 2018, concluding that hybrid modelling represents the state-of-the-art approach for these two methods based on compiled experimental results [7]. It found that boosting-based tree ensemble feature transformation outperformed bagging-based counterparts in their P2P lending credit dataset [8].
In 2023, Kala proposed a Dual-staged Heterogeneous Stacked Ensemble Model (DH-SEM), an algorithm originally designed for gender recognition [9]. As a complex ensemble technique, DH-SEM was later adapted for credit default prediction, achieving an accuracy of 0.886 [10]. Building on this work, this study further explores the application of stacked logistic regression for predicting credit loan defaults, examining its methodological framework and performance. To address data imbalance, we introduce SMOTEENN (Synthetic Minority Oversampling Technique with Edited Nearest Neighbours), a hybrid sampling approach proven to enhance model performance in skewed datasets.
3. Method
3.1. Logistic regression
Logistic Regression (LR) is a common statistical method for binary classification. It uses the Sigmoid function (logistic function) to transform the results of linear regression into probabilities, constraining them within the range of 0 to 1. Fundamentally, it fits data to a logistic function to predict the likelihood of an event occurring.
First, the Sigmoid function, a characteristic S-shaped curve, is introduced. Widely used in machine learning and deep learning models such as logistic regression and neural networks for binary classification, its mathematical formula is:
\( y(x)=\frac{1}{1+{e^{-x}}}\ \ \ (1) \)
The curve of the Sigmoid function is shown in the figure 1 below:
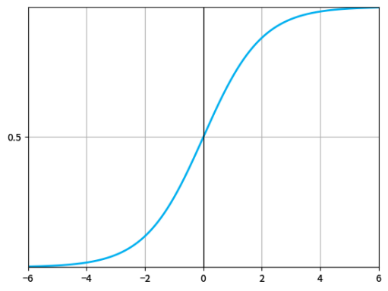
Figure 1: Sigmoid function curve
\( P(Y=1|X)=\frac{1}{1+{e^{-({β_{0}}+{β_{1}}{X_{1}}+⋯+{β_{p}}{X_{p}})}}}\ \ \ (2) \)
Where:
p(x) represents the probability that a sample belongs to the default category;
x is the feature variable;
θ is the parameter to be estimated;
e is the base of the natural logarithm.
Due to the need for the logistic regression model to make binary classification decisions based on probabilistic outputs (default probabilities between 0 and 1), maximum likelihood estimation (MLE) is employed to optimize model parameters. This approach minimizes the error between predicted probabilities and actual categories.
3.2. Random Forest
The Random Forest (RF) algorithm, proposed by Breiman in 2001 [11], is an ensemble learning method belonging to the Bagging strategy family. It constructs multiple decision tree sub-models and generates final predictions through voting (for classification tasks) or averaging (for regression tasks). Unlike traditional decision trees, RF randomly selects feature subsets for node splitting, which enhances model diversity. The core idea of RF is to build numerous decision trees, each trained on different subsets of samples and features, thereby improving the model’s generalization ability and robustness. Compared with single decision trees, random forests exhibit superior generalization, robustness, and resistance to overfitting.
3.3. XGBoost
XGBoost (Extreme Gradient Boosting), proposed by Tianqi Chen in 2016 [12], is a machine learning algorithm based on gradient boosting decision trees. By incorporating techniques such as second-order Taylor expansion and regularization terms, XGBoost significantly improves model training efficiency and prediction performance while mitigating overfitting. It excels in regression, classification, ranking, and time-series forecasting tasks, with wide applications in financial risk control, recommendation systems, medical analysis, and other fields.
XGBoost employs the Boosting ensemble strategy, constructing multiple weak predictors through residual fitting and combining their outputs to form a strong predictor. It uses an additive model, generating a collection of regression trees iteratively for prediction:
\( \hat{y}=\sum _{k=1}^{K}{f_{k}}({x_{i}}),{f_{k}}∈F\ \ \ (3) \)
where \( F \) represents the space of regression trees, the structure of each tree \( {f_{k}} \) is defined by \( q(x) \) , and \( {ω_{q(x)}} \) are the leaf node weights. The objective function integrates a loss function and regularization terms:
\( L(ϕ)=\sum _{i}l(\hat{{y_{i}}},{y_{i}})+\sum _{k}Ω({f_{k}}),Ω({f_{k}})=γT+\frac{1}{2}λ|w{|^{2}}\ \ \ (4) \)
Here,
\( T \) is the number of leaf nodes, and \( γ \) and \( λ \) are regularization coefficients to prevent excessive tree complexity;
\( {L(ϕ)^{t}} \) is the objective function at the \( t \) -th iteration, and \( Ω({f_{k}}) \) is the regularization term for the \( t \) -th tree. The regularization terms control tree complexity (via leaf node count \( T \) and \( {L_{2}} \) -norm of weights \( ω \) ) to avoid overfitting. The training process optimizes the objective function iteratively via gradient boosting. In the \( t \) -th iteration, a new tree \( {f_{t}} \) is added to minimize the approximate objective:
\( {L^{ \prime }}≈\sum _{i}[{g_{i}}{f_{t}}({x_{i}})+\frac{1}{2}{h_{i}}f_{t}^{2}({x_{i}})]+Ω({f_{t}}) \)
\( ≈\sum _{j=1}^{T}[(\sum _{i∈{I_{j}}}{g_{i}}){ω_{j}}+\frac{1}{2}(\sum _{i∈{I_{j}}}{h_{i}}+λ)ω_{j}^{2}]+{γ^{T}}\ \ \ (5) \)
where,
\( {I_{j}} \) is the subset of samples in the \( j \) -th leaf node, \( {ω_{j}} \) is the output value of the \( j \) -th leaf node, \( {g_{i}} \) is the first-order derivative, and \( {h_{i}} \) is the second-order derivative of the loss function. Solving for \( {ω_{j}} \) that minimizes the objective function yields:
\( ω_{j}^{*}=-\frac{\sum _{i∈{I_{j}}}{g_{i}}}{\sum _{i∈{I_{j}}}{h_{i}}+λ}\ \ \ (6) \)
\( {L^{(t)}}(q)=-\frac{1}{2}\sum _{j=1}^{T}\frac{{(\sum _{i∈{I_{j}}}{g_{i}})^{2}}}{\sum _{i∈{I_{j}}}{h_{i}}+λ}+γT\ \ \ (7) \)
These calculations evaluate the quality of tree models—higher values indicate poorer model performance.
3.4. CatBoost
The CatBoost algorithm, an optimization of the gradient boosting decision tree (GBDT) framework, is regarded as one of the most effective machine learning methods [13]. Alongside XGBoost and LightGBM, it constitutes the three major mainstream algorithms within the GBDT family, all of which are improved versions based on the foundational GBDT framework: XGBoost sees wide application across various fields, LightGBM significantly boosts GBDT computational efficiency, and CatBoost outperforms in aspects such as algorithm accuracy and GPU running speed. When conducting predictions with CatBoost, each feature is split independently, and sample ordering is randomized to enable simultaneous processing of multiple samples. In contrast, traditional GBDT methods like XGBoost train each new tree using data dependent on all previous trees’ outputs, a process that may induce gradient bias—where the model overfits early data and its generalization to new data diminishes.
CatBoost tackles this challenge through Ordered Boosting: when training each new tree, it generates multiple random data permutations and calculates gradients using only historical data (rather than directly incorporating predictions from all preceding trees), which reduces data leakage.
For categorical features, CatBoost uses Statistics-based Encoding to automatically process categorical variables, minimizing information loss. The algorithm’s symmetric tree structure and ordered boosting strategy allow efficient handling of categorical data, improving both model performance and prediction speed.
3.5. Stacked ensemble model
Ensemble methods train multiple classification or regression algorithms to create a final model with higher accuracy than any individual base algorithm. They achieve this through techniques like voting, stacking, and blending. Stacking, the ensemble approach used in this study, operates by organizing selected base algorithms into two layers: the first layer forms a "model stack," and the second layer is a meta-learner classifier. By combining the strengths of three or more distinct models, stacking enhances prediction accuracy and controls overfitting—its effectiveness is maximized when paired with base algorithms that produce diverse independent results.
Figure 2 illustrates the two stages of the stacked ensemble algorithm: training data first feeds into the model stack, and their predictions are then input into the second stage (meta-learner) to generate final results. The meta-learner matches these base model predictions to make more accurate forecasts. Here, we construct a two-layer Stacking fusion model with three base models—Random Forest, XGBoost, and CatBoost. Using five-fold cross-validation, each base model is trained and validated to produce predictions aligned with the training data length. These predictions are averaged and treated as new features to train the meta-model. Finally, the trained meta-model predicts outcomes for test data (see Figure 2).
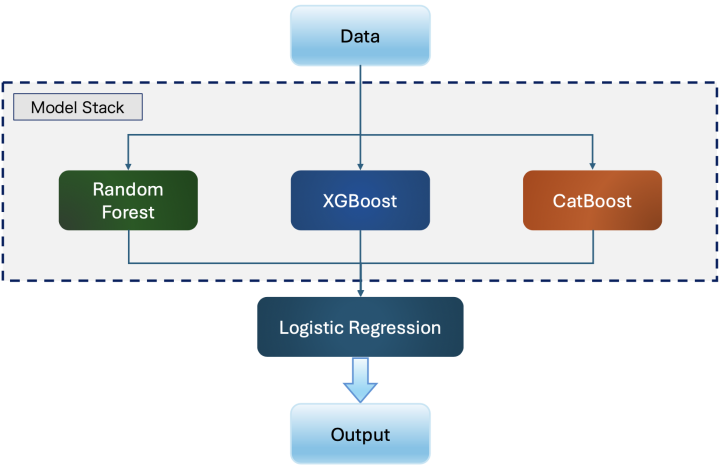
Figure 2: LR-Stacking model
4. Result
4.1. Dataset introduction
We used the loan dataset from the Alibaba Tianchi database for modeling and testing in this report. This dataset contains 42 columns of variable information, such as credit rating, loan amount, loan interest rate, and credit score, among which 15 columns are anonymous variables. Some of the fields included in the dataset are shown in Table 1.
Table 1: Partial attributes of the used dataset
Features | Description |
id | The unique credit letter identifier assigned to the loan to the loan list |
loanAmnt | Loan amount |
interestRate | Loan interest rate |
installment | Installment payment amount |
grade | Loan grade |
homeOwnership | The borrower's housing ownership status provided at registration |
annualIncome | Annual income |
isDefault | Whether it is in default (1 for default; 0 for non-default) |
purpose | The loan purpose category when the borrower applies for the loan |
dti | Debt - to - income ratio |
policyCode | Publicly available policy code = 1, new product not publicly available policy code = 2 |
n0-n14 | A series of anonymous features for processing some lender behavior count features |
Table 2: Partial descriptive statistic table
count | mean | std | min | 25% | 50% | 75% | max | |
id | 800000 | 399999.5 | 230940.252 | 0 | 199999 | 399999 | 599999 | 799999 |
policyCode | 800000 | 1 | 0 | 1 | 1 | 1 | 1 | 1 |
interestRate | 800000 | 13.23839 | 4.765756555 | 5.31 | 9.75 | 12.74 | 15.99 | 30.99 |
dti | 799761 | 18.28455 | 11.15015483 | -1 | 11.79 | 17.61 | 24.06 | 999 |
loanAmnt | 800000 | 14416.81 | 8716.086178 | 500 | 8000 | 12000 | 20000 | 40000 |
isDefault | 800000 | 0.199512 | 0.39963416 | 0 | 0 | 0 | 0 | 1 |
annualIncome | 800000 | 76133.91 | 68947.51367 | 0 | 45600 | 65000 | 90000 | 109992 |
installment | 800000 | 437.9477 | 261.4603933 | 15.7 | 248.45 | 375.13 | 580.71 | 1715.42 |
From Tables 1 and 2, the "policyCode" column is a constant, and "id" is a unique identifier, which are useless for the model. Therefore, the two meaningless fields "id" and "policyCode" were removed, as retaining them would lead to overfitting.
4.2. Target variable distribution analysis
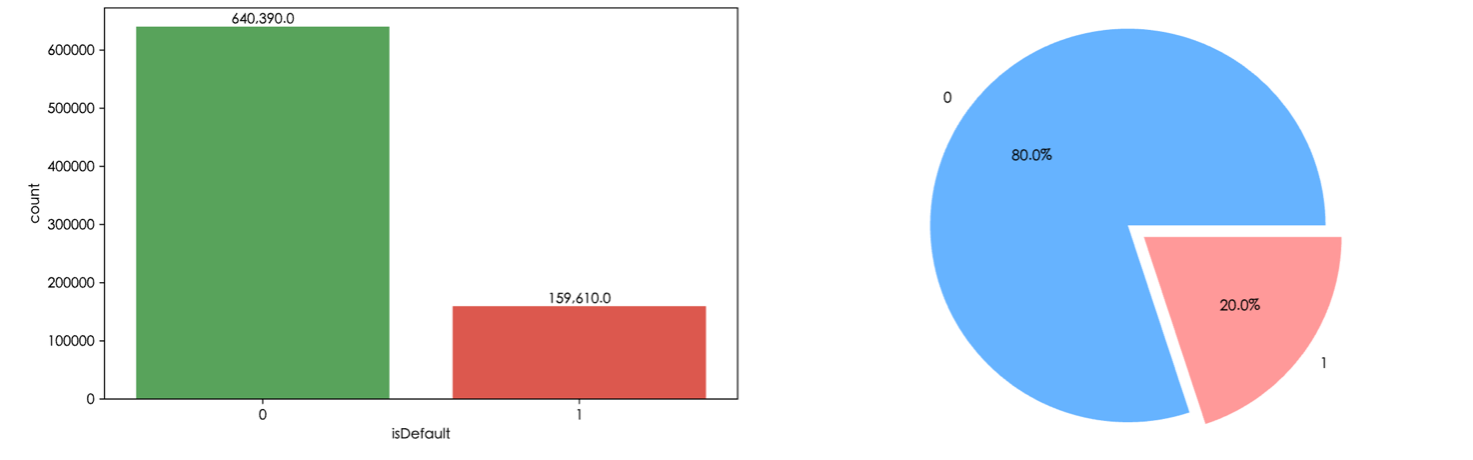
Figure 3: Credit default distribution histogram and proportion pie chart
Figure 3 indicates that the dataset consists of 800,000 records. Among these, 640,390 records have a non-default value (0), which accounts for approximately 80%, while 159,610 records have a default value (1), making up around 20%. Evidently, there is a moderate class imbalance in the data, with a ratio of default to non-default being 1:4. During model training, measures were taken to balance the data. Specifically, the SMOTEENN method was employed to address the data imbalance issue.
4.3. Continuous numerical data analysis
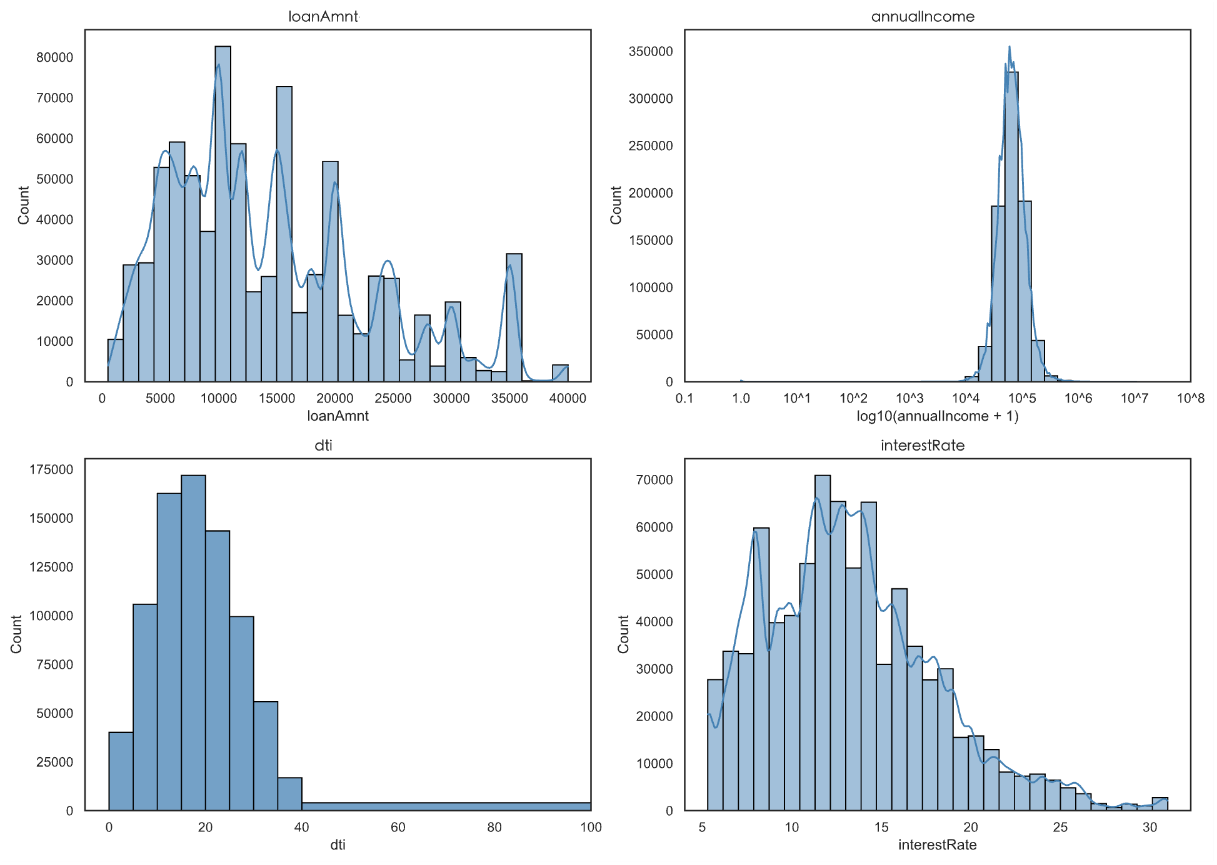
Figure 4: Histogram of the distribution of loan amount, annual income, debt-to-income ratio, and loan interest rate
“loanAmnt” (loan amount) and “interestRate” (interest rate) appear right-skewed in Figure 4, and standardization will be conducted during subsequent model processing. After the logarithmic transformation for annual income, the data concentrate in the interval of 4–6 (corresponding to the original annual income of about 10,000–1,000,000), with the highest frequency in the 4–5 interval (10,000–100,000). The original data are strongly right-skewed, and the high-income group accounts for a small proportion.
4.4. Categorical data feature analysis
From Figure 5, the lower the number of grades of loans, the higher the default rate generally. In the distribution of loan grades, the sample size of grade B and C is the largest, followed by A and D, while the sample size of E, F and G decreases successively, especially the sample size of grade G is the least. As loan grades move from low to high (e.g., A to G), default rates generally rise. This shows that the loan grade does reflect the level of risk: the higher the grade, the higher the credit risk of the borrower. The correlation between loan grade and default rate verifies the rationality of the grade classification system and can be used as an important basis for credit risk assessment.
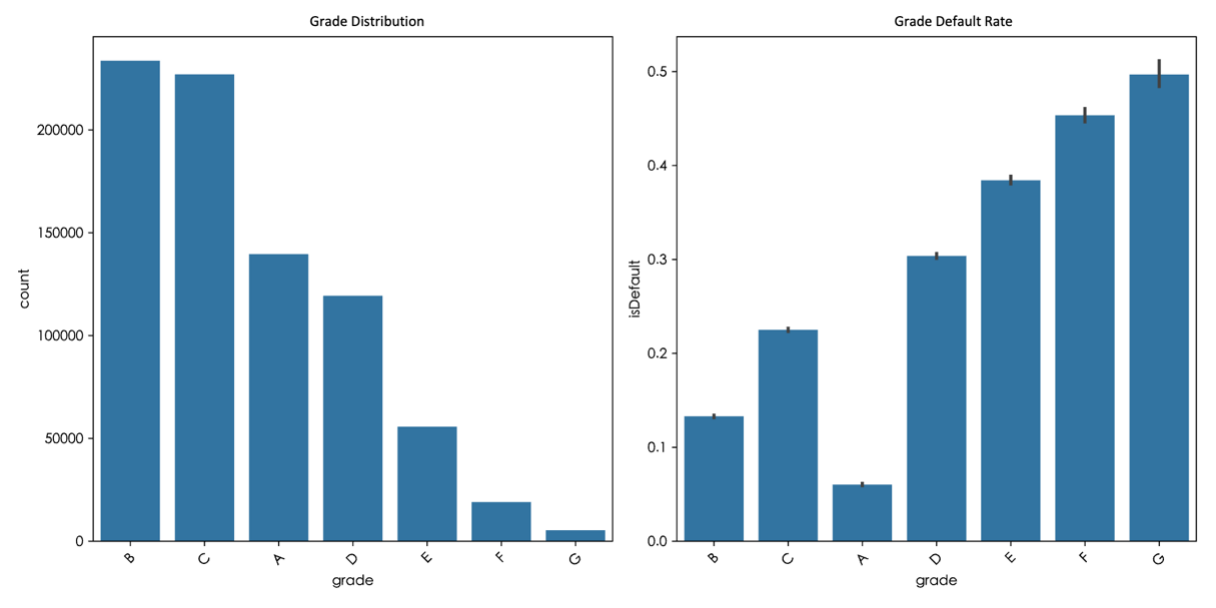
Figure 5: Histogram of loan grade distribution and default rates
4.5. Correlation analysis
Figure 6 presents features like "loanAmnt", "interestRate", "installment" , "annualIncome", "dti", and "isDefau for correlation analysis.
Firstly, the correlation coefficient between the loan interest rate and default is 0.26, showing a weak positive correlation. A higher loan interest rate means higher repayment costs for borrowers, and the default risk may increase. This reflects the role of the interest rate in promoting default.
The correlations between the remaining variables and "isDefault" are weak. The correlation coefficient between default and the loan amount is 0.07, between default and the debt-to-income ratio is 0.08, and between default and the installment payment amount is 0.05. All show weak positive correlations, indicating that these variables have no significant direct impact on default. The correlation coefficient between annual income and default is -0.04, showing a weak negative correlation. This means the default probability of high - income groups is slightly lower, though the correlation is weak.
Moreover, it's common sense that there's a high correlation between the loan amount and the installment amount. The installment amount is directly determined by factors like the loan amount, interest rate, and term. So, there's a strong logical connection between the two.
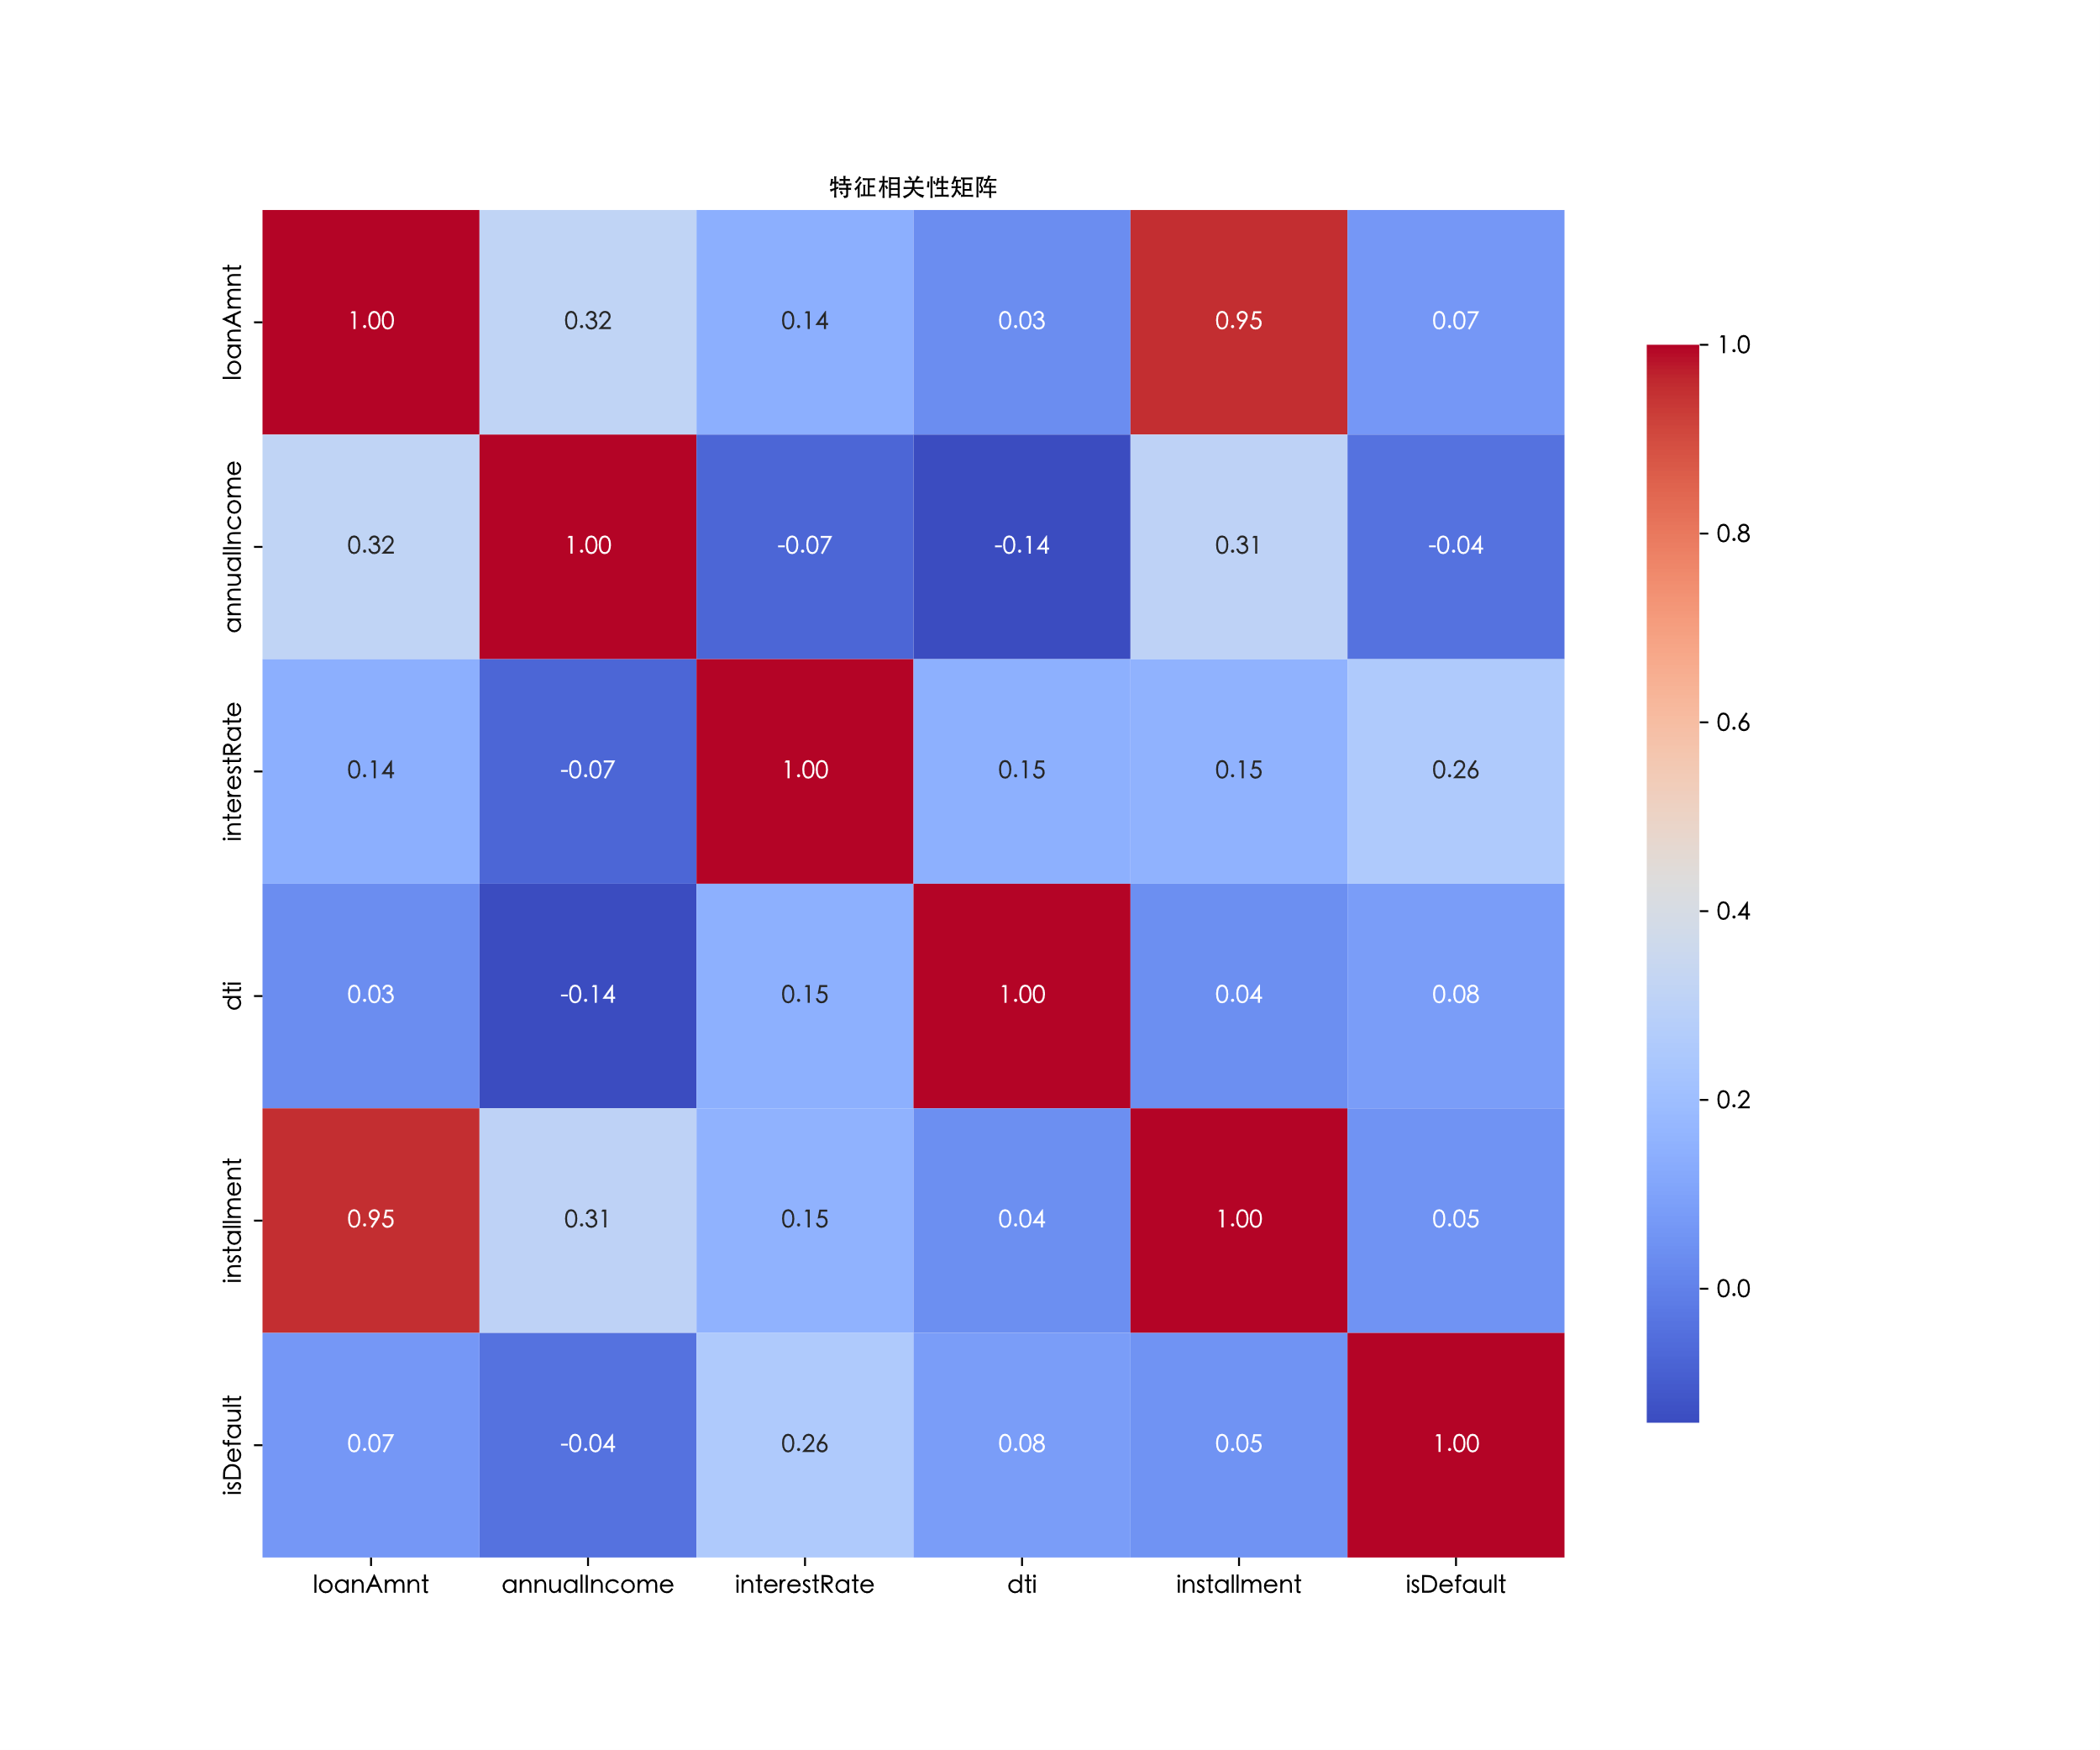
Figure 6: Histogram of loan grade distribution and default rates
5. Model contrast representation
5.1. Random Forest, XGBoost, CatBoost and Logistic Regression Results (SMOTE)
Table 3: Model evaluation report (using SMOTE)
Model Name | Accuracy | Precision | Recall | F1-score | AUC |
Random Forest | 0.81 | 0.56 | 0.08 | 0.14 | 0.7175 |
XGBoost | 0.48 | 0.26 | 0.88 | 0.40 | 0.7292 |
CatBoost | 0.45 | 0.25 | 0.91 | 0.40 | 0.7314 |
When XGBoost and CatBoost have higher recall rates 0.88 and 0.91, respectively, when evaluating various models for identifying default samples (Class 1). This allows them to capture more default samples, but their precision rates 0.26 and 0.25, which contain many errors, are low; Random Forest's Class 1 recall rate is only 0.08, indicating a weak ability to identify default samples. XGBoost and CatBoost have accuracies of 0.48 and 0.45, respectively, while Random Forest has the highest accuracy at 0.81, followed by logistic regression at 0.66. The low recall rate of non-defaulting samples in the latter two reduces the overall accuracy. All things considered, every single model has unique shortcomings: Random Forest has high accuracy but ignores default sample identification, whereas CatBoost and XGBoost are good at recalling defaulted samples but lack accuracy. It is evident that a single model finds it difficult to accurately identify all sample classes. The accuracy of credit default prediction needs to be improved from the following two angles (see Table 3).
5.2. Random Forest, XGBoost, CatBoost and Logistic Regression Results (SMOTEENN)
Table 4: Model evaluation report (using SMOTEENN)
Model Name | Accuracy | Precision | Recall | F1-score | AUC |
Random Forest | 0.77 | 0.41 | 0.37 | 0.39 | 0.7143 |
XGBoost | 0.44 | 0.25 | 0.90 | 0.39 | 0.7162 |
CatBoost | 0.40 | 0.24 | 0.94 | 0.38 | 0.7222 |
Compared to SMOTE oversampling, SMOTEENN reduces the model's reliance on redundant data. In order to eliminate noise, it undersamples. For example, the Class 1 recall rate under SMOTEENN increased from 0.08 to 0.37 with RandomForest. This demonstrates that the model now avoids overfitting due to oversampling and pays closer attention to default samples. SMOTEENN reduced the accuracy of some models, such as CatBoost, from 0.45 to 0.40, but it still has the ROC - AUC score (CatBoost AUC is 0.7222). Additionally, SMOTEENN improved the recall rate for powerful learners like XGBoost and CatBoost without appreciably lowering the AUC score (XGBoost AUC dropped marginally from 0.7292 to 0.7162). This indicates that the model's capacity to differentiate between the two sample classes remained constant. In order to address data imbalance and improve the identification of default classes, we decided to use SMOTEENN (see Table 4).
5.3. Forecasting model based on LR-Stacking
Here we compare the accuracy, precision, recall, F1-score, and AUC value of the LR model, which are more balanced than those of the random forest, XGBoost, and CatBoost models, in order to provide a more thorough explanation of why the LR model was selected as a meta-learner. Furthermore, 50-fold cross-validation is used by the base model in Stacking to produce prediction results, lowering the possibility of information leakage. As a meta-model, logistic regression lowers the probability and enhances the model's capacity for generalisation by learning the base model's prediction pattern. As a result, the stacking algorithm framework's second-layer meta-model in this paper is logistic regression, while the first-layer meta-models are XGBoost, CatBoost, and random forest. Furthermore, this study contrasts LR-Stacking and CatBoost-Stacking:
Table 5: Model comparison evaluation report
Model Name | Accuracy | Precision | Recall | F1-score | AUC |
Random Forest | 0.77 | 0.41 | 0.37 | 0.39 | 0.7143 |
XGBoost | 0.44 | 0.25 | 0.90 | 0.39 | 0.7162 |
CatBoost | 0.40 | 0.24 | 0.94 | 0.38 | 0.7222 |
CatBoost-Stacking | 0.81 | 0.59 | 0.11 | 0.18 | 0.7341 |
LR-Stacking | 0.61 | 0.30 | 0.72 | 0.42 | 0.7341 |
LR-Stacking is chosen as the best model for credit default prediction after a comparison of the performance of the single and stacking models. Its primary benefits are evident in (see Table 5):
1) The ability to cover risks is exceptional. Compared to random forest (0.37) and CatBoost-stacking (0.11), the Class 1 recall rate of 0.72 is substantially higher. It is possible to successfully identify 72% of default samples.
2) Balance of overall performance. Out of all the models, the highest F1-score is 0.42. Additionally, CatBoost-Stacking achieves the best possible balance between theoretical differentiation ability and actual risk identification, with an AUC value of 0.7341, ranking first.
3) Excellent business adaptability, a logistic regression model that integrates base model output while preserving interpretability, and a running time of just 38.7 seconds make it appropriate for real-time risk control scenarios. On the other hand, the requirements of financial risk control cannot be met by Random Forest default samples because of missed judgment (recall rate 0.37), XGBoost and CatBoost because of excessive misjudgment rate (accuracy rate 0.44/0.40), and CatBoost-stacking because of missed judgment rate of 89%. By using an integrated approach that strikes a balance between risk coverage and business viability.
6. Conclusion
This study proposes a credit default prediction model using LR-Stacking. The model integrates three base models—XGBoost, CatBoost, and Random Forest—to achieve a balance between risk identification and business adaptability. Empirical results show LR-Stacking’s advantages in key metrics: the recall rate for Class 1 samples exceeds 0.72. The F1-score of 0.42 and AUC value of 0.7341 demonstrate improvements in both precision and stability. This study enhances the model’s comprehensive performance through a two-fold optimization mechanism. At the algorithm level, logistic regression is adopted as the meta-model. In data preprocessing, the SMOTEENN hybrid sampling strategy boosts default identification rates (e.g., for Random Forest) while maintaining an AUC above 0.71. These optimizations validate the model’s improved accuracy, particularly its enhanced stability.
In the future, research can explore multi-stage stacking to further enhance the model’s generalization ability and to address current limitations. Deep learning models such as neural networks can also be introduced as base models to better capture complex feature interactions. Additionally, a more in-depth analysis of the dataset’s anonymous variables (n0-n14) is needed to uncover latent behavioral patterns. This will lay a solid foundation for developing more sophisticated credit default prediction models.
Authors contribution
All the authors contributed equally and their names were listed in alphabetical order.
References
[1]. Wang, A. Fourth Quarter (2024) Data on Key Regulatory Indicators for the Banking and Insurance Industries_Department Updates_Chinese Government Website n.d. https://www.gov.cn/lianbo/bumen/202502/content_7004983.htm (accessed March 21, 2025).
[2]. Xiong, X, Ma, J, Zhao, W, Wang, X, Zhang, J., (2009) Credit Risk Assessment under the Supply Chain Finance Model. Nankai Bus Rev, 12, 92–8, 106.
[3]. Wang J, Rong W, Zhang Z, Mei D., (2022) Credit Debt Default Risk Assessment Based on the XGBoost Algorithm: An Empirical Study from China. Wirel Commun Mob Comput ,20,8005493. https://doi.org/10.1155/2022/8005493.
[4]. Coser A, Maer-Matei MM, Albu C., (2023) Predictive Models for Loan Default Risk Assessment. Econ Comput Econ Cybern Stud Res, 201, 53:149–65.
[5]. Wang K, Li M, Cheng J, Zhou X, Li G., (2022) Research on personal credit risk evaluation based on XGBoost. Procedia Comput Sci, 199, 1128–35. https://doi.org/10.1016/j.procs.2022.01.143.
[6]. Moro S, Cortez P, Rita P., (2016) An Automated Literature Analysis on Data Mining Applications to Credit Risk Assessment. In: Dunis CL, Middleton PW, Karathanasopolous A, Theofilatos K, editors. Artif. Intell. Financ. Mark. Cut. Edge Appl. Risk Manag. Portf. Optim. Econ., London: Palgrave Macmillan UK, 3, 161–77. https://doi.org/10.1057/978-1-137-48880-0_6.
[7]. Goh RY, Lee LS, (2019). Credit Scoring: A Review on Support Vector Machines and Metaheuristic Approaches. Adv Oper Res, 1, 74-79. https://doi.org/10.1155/2019/1974794.
[8]. Liu J, Liu J, Wu C, Wang S, (2022). Enhancing credit risk prediction based on ensemble tree-based feature transformation and logistic regression. J Forecast, 43, 429–55. https://doi.org/10.1002/for.3040.
[9]. kala J, Taran S, Pandey A., (2023) A Dual-Staged heterogeneous stacked ensemble model for gender recognition using speech signalA Dual-Staged heterogeneous stacked ensemble model for gender recognition using speech signal. Appl Acoust, 205, 109271. https://doi.org/10.1016/j.apacoust.2023.109271.
[10]. Xiao J, Yu L., (2024) A Financial Credit Default Prediction Based on an Integrated Learning Model of Classification Algorithms. Model Simul, 13,17-19. https://doi.org/10.12677/mos.2024.132169.
[11]. Breiman L. Random Forests., (2021) Mach Learn, 45, 5–32. https://doi.org/10.1023/A:1010933404324.
[12]. Chen T, Guestrin C., (2016) Boost: A Scalable Tree Boosting System. Proc. 22nd ACM SIGKDD Int. Conf. Knowl. Discov. Data Min., 7, 85–94. https://doi.org/10.1145/2939672.2939785.
[13]. Yandex T., (2025) CatBoost - Yandex Technol n.d. https://yandex.com/dev/catboost/index (accessed April 23, 2025).
Cite this article
Wei,F.;Zhou,H. (2025). Credit Default Prediction via Stacked Logistic Regression Ensemble. Advances in Economics, Management and Political Sciences,185,24-34.
Data availability
The datasets used and/or analyzed during the current study will be available from the authors upon reasonable request.
Disclaimer/Publisher's Note
The statements, opinions and data contained in all publications are solely those of the individual author(s) and contributor(s) and not of EWA Publishing and/or the editor(s). EWA Publishing and/or the editor(s) disclaim responsibility for any injury to people or property resulting from any ideas, methods, instructions or products referred to in the content.
About volume
Volume title: Proceedings of ICEMGD 2025 Symposium: Innovating in Management and Economic Development
© 2024 by the author(s). Licensee EWA Publishing, Oxford, UK. This article is an open access article distributed under the terms and
conditions of the Creative Commons Attribution (CC BY) license. Authors who
publish this series agree to the following terms:
1. Authors retain copyright and grant the series right of first publication with the work simultaneously licensed under a Creative Commons
Attribution License that allows others to share the work with an acknowledgment of the work's authorship and initial publication in this
series.
2. Authors are able to enter into separate, additional contractual arrangements for the non-exclusive distribution of the series's published
version of the work (e.g., post it to an institutional repository or publish it in a book), with an acknowledgment of its initial
publication in this series.
3. Authors are permitted and encouraged to post their work online (e.g., in institutional repositories or on their website) prior to and
during the submission process, as it can lead to productive exchanges, as well as earlier and greater citation of published work (See
Open access policy for details).
References
[1]. Wang, A. Fourth Quarter (2024) Data on Key Regulatory Indicators for the Banking and Insurance Industries_Department Updates_Chinese Government Website n.d. https://www.gov.cn/lianbo/bumen/202502/content_7004983.htm (accessed March 21, 2025).
[2]. Xiong, X, Ma, J, Zhao, W, Wang, X, Zhang, J., (2009) Credit Risk Assessment under the Supply Chain Finance Model. Nankai Bus Rev, 12, 92–8, 106.
[3]. Wang J, Rong W, Zhang Z, Mei D., (2022) Credit Debt Default Risk Assessment Based on the XGBoost Algorithm: An Empirical Study from China. Wirel Commun Mob Comput ,20,8005493. https://doi.org/10.1155/2022/8005493.
[4]. Coser A, Maer-Matei MM, Albu C., (2023) Predictive Models for Loan Default Risk Assessment. Econ Comput Econ Cybern Stud Res, 201, 53:149–65.
[5]. Wang K, Li M, Cheng J, Zhou X, Li G., (2022) Research on personal credit risk evaluation based on XGBoost. Procedia Comput Sci, 199, 1128–35. https://doi.org/10.1016/j.procs.2022.01.143.
[6]. Moro S, Cortez P, Rita P., (2016) An Automated Literature Analysis on Data Mining Applications to Credit Risk Assessment. In: Dunis CL, Middleton PW, Karathanasopolous A, Theofilatos K, editors. Artif. Intell. Financ. Mark. Cut. Edge Appl. Risk Manag. Portf. Optim. Econ., London: Palgrave Macmillan UK, 3, 161–77. https://doi.org/10.1057/978-1-137-48880-0_6.
[7]. Goh RY, Lee LS, (2019). Credit Scoring: A Review on Support Vector Machines and Metaheuristic Approaches. Adv Oper Res, 1, 74-79. https://doi.org/10.1155/2019/1974794.
[8]. Liu J, Liu J, Wu C, Wang S, (2022). Enhancing credit risk prediction based on ensemble tree-based feature transformation and logistic regression. J Forecast, 43, 429–55. https://doi.org/10.1002/for.3040.
[9]. kala J, Taran S, Pandey A., (2023) A Dual-Staged heterogeneous stacked ensemble model for gender recognition using speech signalA Dual-Staged heterogeneous stacked ensemble model for gender recognition using speech signal. Appl Acoust, 205, 109271. https://doi.org/10.1016/j.apacoust.2023.109271.
[10]. Xiao J, Yu L., (2024) A Financial Credit Default Prediction Based on an Integrated Learning Model of Classification Algorithms. Model Simul, 13,17-19. https://doi.org/10.12677/mos.2024.132169.
[11]. Breiman L. Random Forests., (2021) Mach Learn, 45, 5–32. https://doi.org/10.1023/A:1010933404324.
[12]. Chen T, Guestrin C., (2016) Boost: A Scalable Tree Boosting System. Proc. 22nd ACM SIGKDD Int. Conf. Knowl. Discov. Data Min., 7, 85–94. https://doi.org/10.1145/2939672.2939785.
[13]. Yandex T., (2025) CatBoost - Yandex Technol n.d. https://yandex.com/dev/catboost/index (accessed April 23, 2025).