1. Introduction
In the modern financial industry, risk management is one of the most important tasks for businesses and corporations to fulfill specifically under the context of loan application. With the growing number of applicants nowadays and fast increasing volumes of financial transactions, the traditional ways of detecting whether or not an applicant is eligible such as manually checking certain criteria or relying on some credit scores are becoming less efficient. Therefore, machine learning algorithms comes into play in these scenarios to help identify the likelihood of an applicant going to default and enhance the overall security of loan application system. It is also more efficient as the algorithm comprehensively trains on the applicant’s several metrics such as income, employment, and history records etc. to generate a reliable model for the system to reference on.
Under the context of supply chain, one research by using the idea of multi-score information to evaluate performance of six different machine learning models. Among all, Random Forest achieved the best forecasting performance, and the CSL-RF model that extends the cost sensitive learning to the standard RF achieved the optimal result in terms of robustness and accuracy [1].
Another application showed that machine learning models such as clustered based K nearest neighbor (KNN), clustered based logistic regression (LR), and clustered based XGBoost outperformed some state-of-art methods under the context of determining the eligibility of loan applicants. Among all, XGBoost achieved the best result with shortest detection time and response time, and high accuracy [2].
Hierarchical Risk Parity (HRP) is also able to perform risk management tasks given the context of cryptocurrency assets. The study shows that HRP has high performance for diversification. The Reinforcement Learning (RL) also out performs other machine learning models through its capability to adapt and learn through the process of training [3].
Several surveys on the incorporation of artificial intelligence (AI) methods in financial markets provided thorough analyses of the current uptake of these technologies and algorithms, and how people adapt them into the field of risk management, fraud detection, and trading etc. The survey holds a positive attitude where people find those algorithms helpful and beneficial, while also proposing some ethical concerns such as job replacement [4].
Another study looked at how ML may be applied into SAP ERP systems to carry out tasks including anomaly detection and regression etc. The survey pointed out that by adopting these techniques, organizations will be able to identify and mitigate potential risks with high efficiency [5].
While there are various of applications of machine learning models on different areas with several optimization methods, this paper provides a case study into loan application with only baseline models applied on a relatively smaller dataset to test measurements including accuracy, precision, recall and f1-score. The paper identifies five classic algorithms to examine their performance on a loan application dataset. Then, a comparison is made between these models to determine which baseline model performs the best and is most reliable one without much optimization.
2. Methodology
2.1. Model introduction and selection
In this section, there are five selected machine learning algorithms being applied, which are Decision Tree, Logistic Regression, Random Forest, SVM, and XGBoost. Since all these models are able to perform problems such as classification, thus they are well suited for the purpose of making decisions of whether or not a loan applicant should be flagged as a risk applicant. In this section, different models will demonstrate different performances, and after evaluating certain criteria such as accuracy, precision, f1-score, Area Under Curve (AUC), an optimal model will be selected.
2.1.1. Decision Tree
Decision Tree is suitable for tasks such as classification. It has structures similar to a tree with structures including the root node, internal nodes, branches, and leaf nodes, with corresponding to the functions of the starting point of splitting; representing the features in a dataset; result after making a decision (usually represented by Yes or No); final decision and outcome gained by recursively making decisions [6].
2.1.2. Logistic Regression
Logistic Regression is good at classification tasks, and it determines how likely a data should fall into which class. It starts with some linear combinations of the original data, and then classify them based on a sigmoid function, which is usually represented by:
where σ(z) is between 0 and 1 depending on different values z. Eventually the model will apply a threshold to make final predictions [7].
2.1.3. Random Forest
Random Forest is a combination of several decision trees, and it is an ensemble learning technique that works well for tasks involving regression or classification. It is generally more reliable than a single decision tree, but the efficiency is lower [8].
2.1.4. SVM
SVM is targeted to find a hyperplane that separates two classes, and this hyperplane will maximize the margins between the two classes. For some 2-dimensional data, SVM will fit a straight line that separates each class with maximum margins. For higher dimensional data, SVM uses a kernel function to map the data to higher dimensions. One most well-known kernel function is RBF kernel:
which works well when the decision boundary is non-linear [9].
2.1.5. XGBoost
XGboost is similar to the idea of Random Forest where it builds from multiple simple models to form an ensemble, with each following model correcting and enhancing the previous one. XGBoost has built-in regularization which reduces overfitting and also perform more efficiently than Random Forest due to its parallelization [10].
2.2. Result demonstration
The dataset is taken from Kaggle, which contains features of each loan applicant’s income, age, professional experience (recorded in years), marital status, housing status, car ownership, profession, city, state, years of employment, years of residence in an area, risk flag with 1 being high risk and 0 being low risk. After that, the data is divided into 70% training, 30% testing sets, and a confusion matrix and ROC curve are produced for each model. In the following calculations, True Positive, False Positive, True Negative, False Negative are represented by TP, FP, TN, and FN respectively. The accuracy, precision, recall and f1-score are evaluated by the following equations (3), (4), (5) and (6):
2.2.1. Decision Tree
In Decision Tree, the baseline model achieved accuracy of 0.3986, precision of 0.4192, recall of 0.0888, and f-1 score of 0.1464 according to the confusion matrix (Figure 1). The calculation shows that decision tree preforms not ideally under the given dataset, and it is biased towards the negative class. It is also shown on the ROC curve (Figure 2) below:
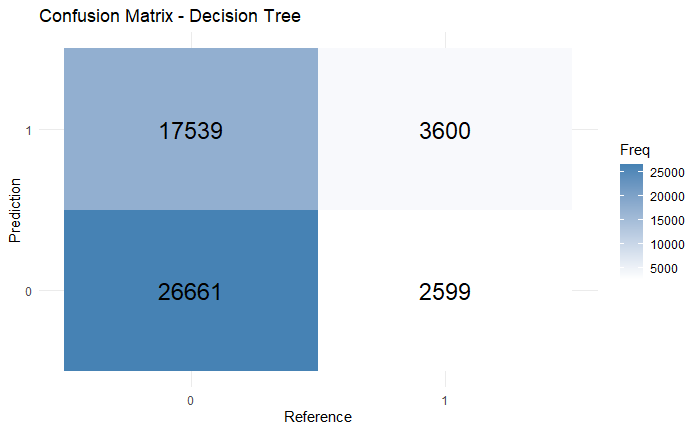
Figure 1: The confusion matrix of Decision Tree
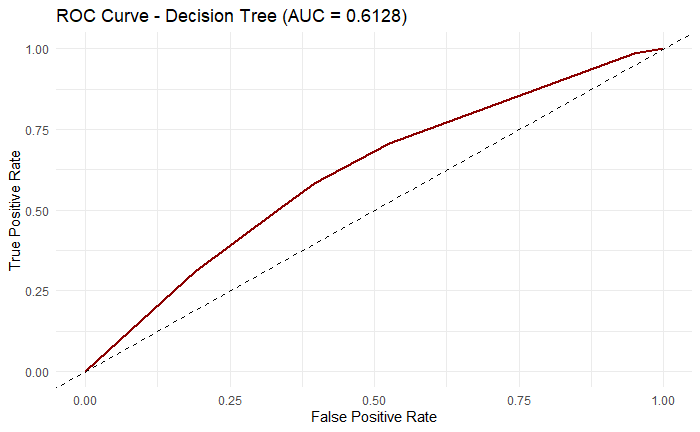
Figure 2: ROC curve for Decision Tree
The AUC value of 0.618 means that the model does perform slightly better than random guessing, however it is clearly unable to fully separate the two classes.
2.2.2. Logistic Regression
In Logistic Regression, it had 0.8753 accuracy, 0.7126 precision, 0.0287 recall, and 0.0552 f1-score based on the Figure 3. Although here accuracy and precision seem to be high overall, there are major problems on the recall and f1 score as they are extremely low, potentially means that the model is missing many positive cases and can’t achieve a balance between recall and precision. The ROC curve (Figure 4) also shows that the model can just do slightly better than random guessing for AUC value of 0.6274.
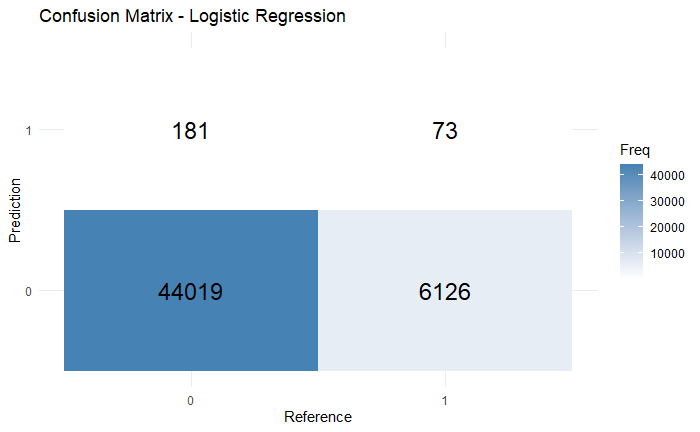
Figure 3: The confusion matrix of Logistic Regression
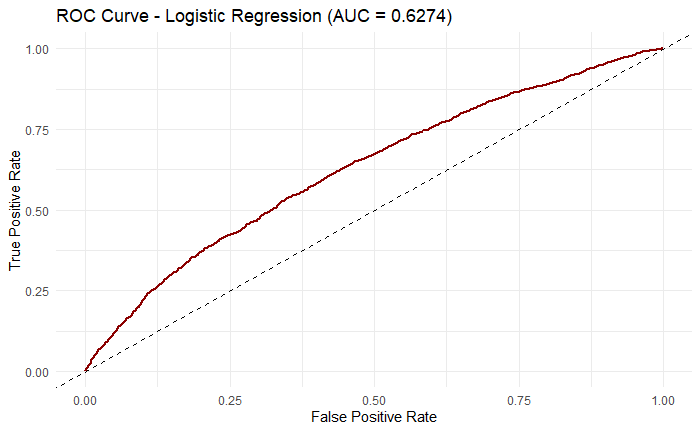
Figure 4: ROC curve for Logistic Regression
2.2.3. Random Forest
Random Forest had 0.8968 accuracy, 0.6012 precision, 0.5280 recall, and 0.5619 f1 score according to Figure 5. Here, the accuracy is relatively high with an acceptable precision, meaning that the model performs generally well, and it is also able to catch both positive and negative cases in a potentially unbalanced dataset. More importantly, compare to decision tree and logistic regression, random forest is able to achieve a much higher recall and f1 score, meaning that the model detects approximately half of the true positive class, and the f1 score tells that it is able to give a balanced evaluation of these positive class.
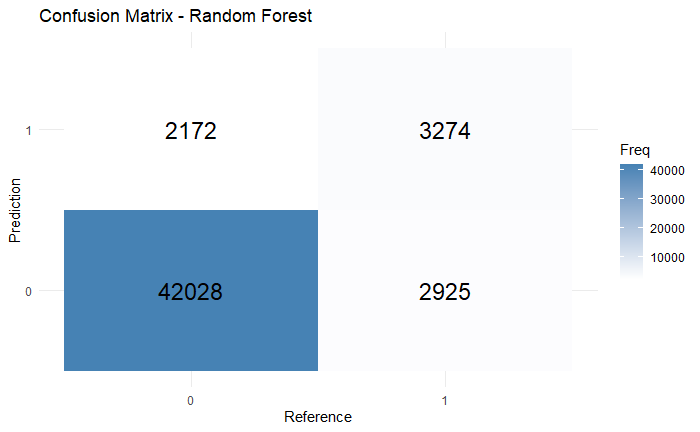
Figure 5: The confusion matrix of Random Forest
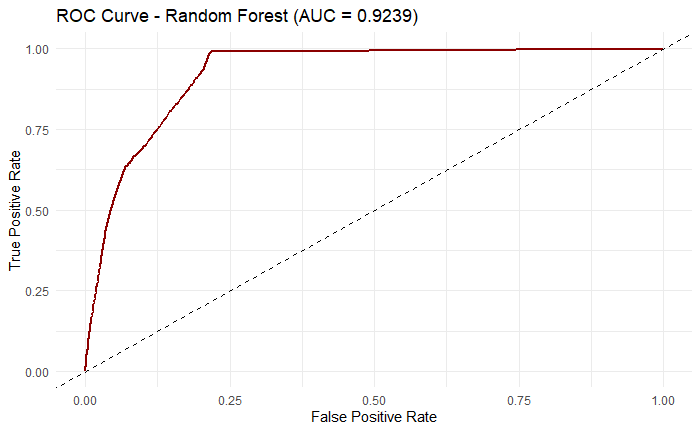
Figure 6: ROC curve for Random Forest
It is also shown in the ROC curve with an high AUC value of 0.9239 in Figure 6. The model is able to classify positive and negative classes with high confidence as figure 6 shows sharp increments and is away from the center random guessing dashed line.
2.2.4. Support Vector Machine
SVM had 0.608 accuracy, 0.1462 precision, 0.4517 recall, and 0.2208 confusion matrix f1 score (Figure 7). The reason why the model has lower precision than accuracy is due to its constant false alarms or predicting false positives. Also, although the recall seems to be around 50%, the low f1 score mean that the model also makes a lot of false negatives when doing the prediction. SVM seems have some general improvements over decision tree, but it is not an ideal solution to the dataset. The ROC curve also indicates that the prediction is rather more random as the AUC value is close to 50% (Figure 8).
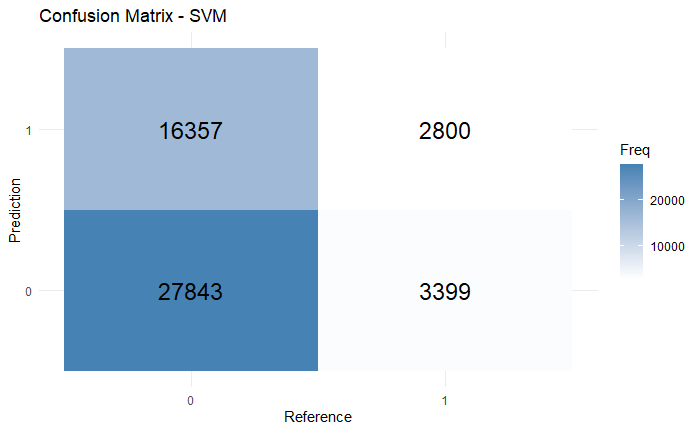
Figure 7: The confusion matrix of SVM
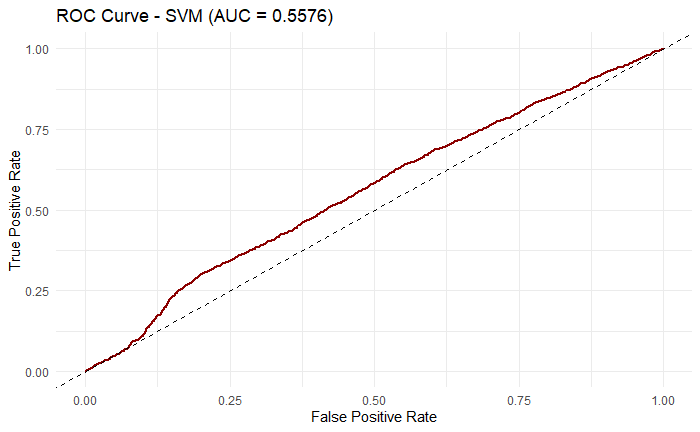
Figure 8: ROC curve for SVM
2.2.5. XGBoost
In XGBoost, the model faces similar dilemma as SVM, where it achieved accuracy 0.5487, precision 0.1432, recall 0.5357, and f1 score 0.2260. from the confusion matrix (Figure 9). The ROC curve is very centered with AUC value close to 0.5 (Figure 10), meaning that XGBoost did not perform well under this task with the given dataset.
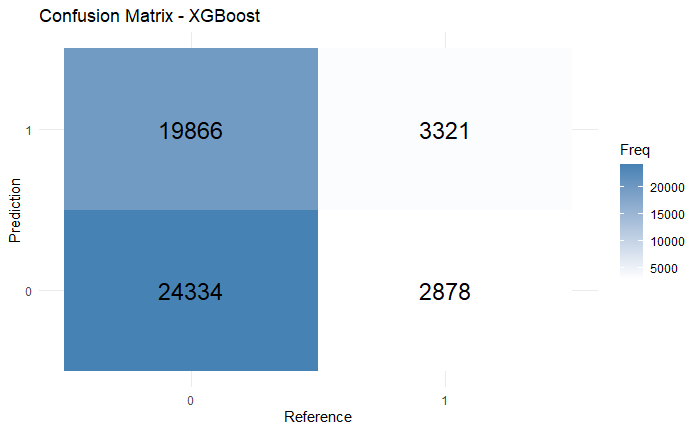
Figure 9: The confusion matrix of XGBoost
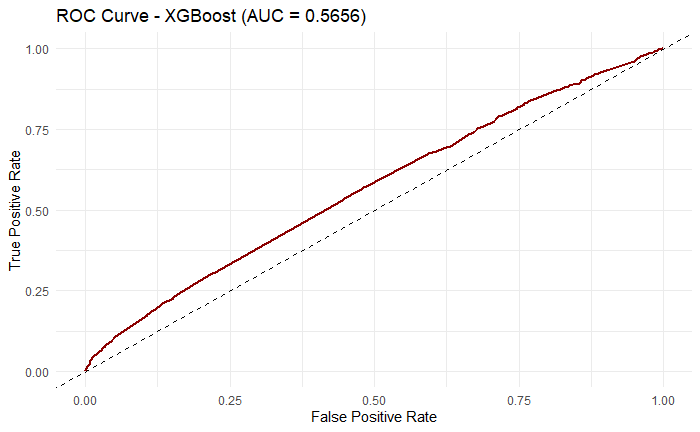
Figure 10: ROC curve for XGBoost
3. Discussion
Among all these models, Random Forest behaves the best due to its high accuracy and reliable AUC value of 0.9239. The major problem lies in the recall and f-1 score for the other models, and this is potentially caused by the imbalanced dataset which indeed after examining the dataset, there are more negative cases than positive cases and this causes the models to predict with high accuracy but low recall and f1 score. The summary of all the models’ performance is included in the Table 1:
|
Model |
Accuracy |
Precision |
Recall |
F1 Score |
|
Decision Tree |
0.3986 |
0.4192 |
0.0888 |
0.1464 |
|
Logistic Regression |
0.8753 |
0.7126 |
0.0287 |
0.0552 |
|
Random Forest |
0.8968 |
0.6012 |
0.5280 |
0.5619 |
|
Support Vector Machine |
0.608 |
0.1462 |
0.4517 |
0.2208 |
|
XGBoost |
0.5487 |
0.1432 |
0.5357 |
0.2260 |
4. Conclusion
This paper emphasizes on the comparisons of different ML models on a dataset, and the results are obtained by applying each model’s baseline performances on a raw dataset to test the standard performances of each model. In general, Logistic Regression, Random Forest, SVM achieved higher accuracies than others, while they all have low recall and f1 score except for Random Forest. Decision and XGBoost did not perform well under the dataset and they are rather not reliable. Since the entire experiment is based on the raw performances of different models, it lacks crucial optimizations and data processing which causes biases in the result. In the future, there are certainly various ways to improve the model performance, and possible improvements include data processing such as using the Synthetic Minority Oversampling Technique (SMOTE) to create and expand on the positive cases [11]. Also, adding hyperparameters would improve the model performance. One way to achieve this is by using Bayesian Optimization where it run through several iterations with each time updating a better hyperparameter based on the surrogate model and eventually selecting the best hyperparameter [12].
References
[1]. Wang, L. , Jia, F. , Chen, L. , and Xu, Q. (2023) Forecasting SMEs’ Credit Risk in Supply Chain Finance with a Sampling Strategy Based on Machine Learning Techniques. Annals of Operations Research, 331, 1-33.
[2]. Murugan, M. S. (2023) Large-Scale Data-Driven Financial Risk Management & Analysis Using Machine Learning Strategies. Measurement: Sensors, 27, 100756.
[3]. Shahbazi, Z. , and Byun, Y. C. (2022) Machine Learning-Based Analysis of Cryptocurrency Market Financial Risk Management. Ieee access, 10, 37848-37856.
[4]. El Hajj, M. , and Hammoud, J. (2023) Unveiling the Influence of Artificial Intelligence and Machine Learning on Financial Markets: A Comprehensive Analysis of AI Applications in Trading, Risk Management, and Financial Operations. Journal of Risk and Financial Management, 16, 434.
[5]. Chawla, N. V. , Bowyer, K. W. , Hall, L. O. , and Kegelmeyer, W. P. (2002) SMOTE: Synthetic Minority Over Sampling Technique. Journal of artificial intelligence research, 16, 321-357.
[6]. Snoek, J. , Larochelle, H. , and Adams, R. P. (2012) Practical Bayesian Optimization of Machine Learning Algorithms. Advances in neural information processing systems, 25.
[7]. Parimi, S. S. (2019) Automated Risk Assessment in SAP Financial Modules through Machine Learning. Available at SSRN 4934897.
[8]. Ying, L. U. (2015) Decision Tree Methods: Applications for Classification and Prediction. Shanghai archives of psychiatry, 27, 130.
[9]. Peng, C. Y. J. , Lee, K. L. , and Ingersoll, G. M. (2002) An Introduction to Logistic Regression Analysis and Reporting. The journal of educational research, 96, 3-14.
[10]. Breiman, L. (2001) Random Forests. Machine learning, 45, 5-32
[11]. Hearst, M. A. , Dumais, S. T. , Osuna, E. , Platt, J. , and Scholkopf, B. (1998) Support Vector Machines. IEEE Intelligent Systems and their applications, 13, 18-28.
[12]. Li, Y. , Li, M. , Li, C. and Liu, Z. (2020) Forest Aboveground Biomass Estimation using Landsat 8 and Sentinel-1A Data with Machine Learning Algorithms. Scientific Reports, 10, 9952-12.
Cite this article
Bao,K. (2025). Evaluations of Baseline Machine Learning Algorithms in Loan Application Tasks. Advances in Economics, Management and Political Sciences,193,62-69.
Data availability
The datasets used and/or analyzed during the current study will be available from the authors upon reasonable request.
Disclaimer/Publisher's Note
The statements, opinions and data contained in all publications are solely those of the individual author(s) and contributor(s) and not of EWA Publishing and/or the editor(s). EWA Publishing and/or the editor(s) disclaim responsibility for any injury to people or property resulting from any ideas, methods, instructions or products referred to in the content.
About volume
Volume title: Proceedings of ICEMGD 2025 Symposium: Innovating in Management and Economic Development
© 2024 by the author(s). Licensee EWA Publishing, Oxford, UK. This article is an open access article distributed under the terms and
conditions of the Creative Commons Attribution (CC BY) license. Authors who
publish this series agree to the following terms:
1. Authors retain copyright and grant the series right of first publication with the work simultaneously licensed under a Creative Commons
Attribution License that allows others to share the work with an acknowledgment of the work's authorship and initial publication in this
series.
2. Authors are able to enter into separate, additional contractual arrangements for the non-exclusive distribution of the series's published
version of the work (e.g., post it to an institutional repository or publish it in a book), with an acknowledgment of its initial
publication in this series.
3. Authors are permitted and encouraged to post their work online (e.g., in institutional repositories or on their website) prior to and
during the submission process, as it can lead to productive exchanges, as well as earlier and greater citation of published work (See
Open access policy for details).
References
[1]. Wang, L. , Jia, F. , Chen, L. , and Xu, Q. (2023) Forecasting SMEs’ Credit Risk in Supply Chain Finance with a Sampling Strategy Based on Machine Learning Techniques. Annals of Operations Research, 331, 1-33.
[2]. Murugan, M. S. (2023) Large-Scale Data-Driven Financial Risk Management & Analysis Using Machine Learning Strategies. Measurement: Sensors, 27, 100756.
[3]. Shahbazi, Z. , and Byun, Y. C. (2022) Machine Learning-Based Analysis of Cryptocurrency Market Financial Risk Management. Ieee access, 10, 37848-37856.
[4]. El Hajj, M. , and Hammoud, J. (2023) Unveiling the Influence of Artificial Intelligence and Machine Learning on Financial Markets: A Comprehensive Analysis of AI Applications in Trading, Risk Management, and Financial Operations. Journal of Risk and Financial Management, 16, 434.
[5]. Chawla, N. V. , Bowyer, K. W. , Hall, L. O. , and Kegelmeyer, W. P. (2002) SMOTE: Synthetic Minority Over Sampling Technique. Journal of artificial intelligence research, 16, 321-357.
[6]. Snoek, J. , Larochelle, H. , and Adams, R. P. (2012) Practical Bayesian Optimization of Machine Learning Algorithms. Advances in neural information processing systems, 25.
[7]. Parimi, S. S. (2019) Automated Risk Assessment in SAP Financial Modules through Machine Learning. Available at SSRN 4934897.
[8]. Ying, L. U. (2015) Decision Tree Methods: Applications for Classification and Prediction. Shanghai archives of psychiatry, 27, 130.
[9]. Peng, C. Y. J. , Lee, K. L. , and Ingersoll, G. M. (2002) An Introduction to Logistic Regression Analysis and Reporting. The journal of educational research, 96, 3-14.
[10]. Breiman, L. (2001) Random Forests. Machine learning, 45, 5-32
[11]. Hearst, M. A. , Dumais, S. T. , Osuna, E. , Platt, J. , and Scholkopf, B. (1998) Support Vector Machines. IEEE Intelligent Systems and their applications, 13, 18-28.
[12]. Li, Y. , Li, M. , Li, C. and Liu, Z. (2020) Forest Aboveground Biomass Estimation using Landsat 8 and Sentinel-1A Data with Machine Learning Algorithms. Scientific Reports, 10, 9952-12.


